

Disruption of Core Planar Cell Polarity Signaling Regulates Renal Tubule Morphogenesis but Is Not Cystogenic
- PMID: 29033332
- PMCID: PMC5683414
- DOI: 10.1016/j.cub.2017.09.011
Disruption of Core Planar Cell Polarity Signaling Regulates Renal Tubule Morphogenesis but Is Not Cystogenic
Abstract
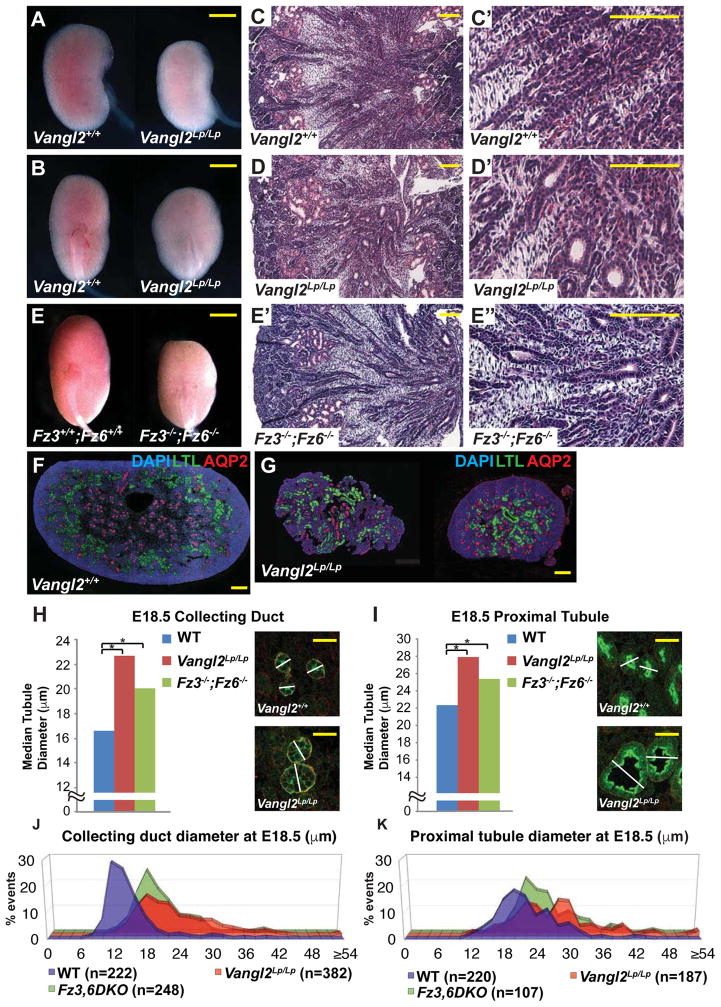
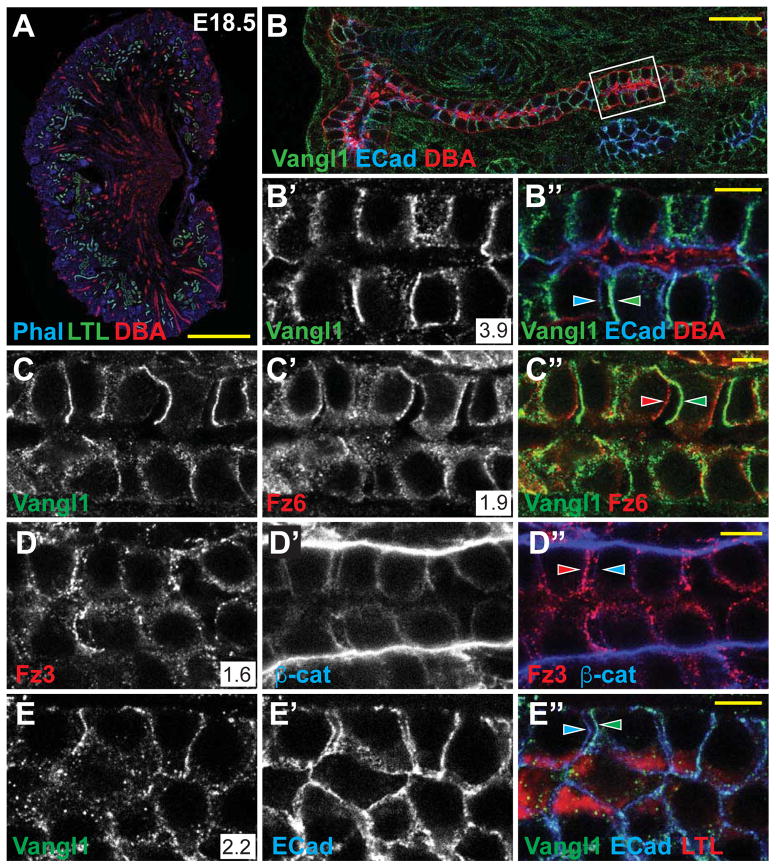
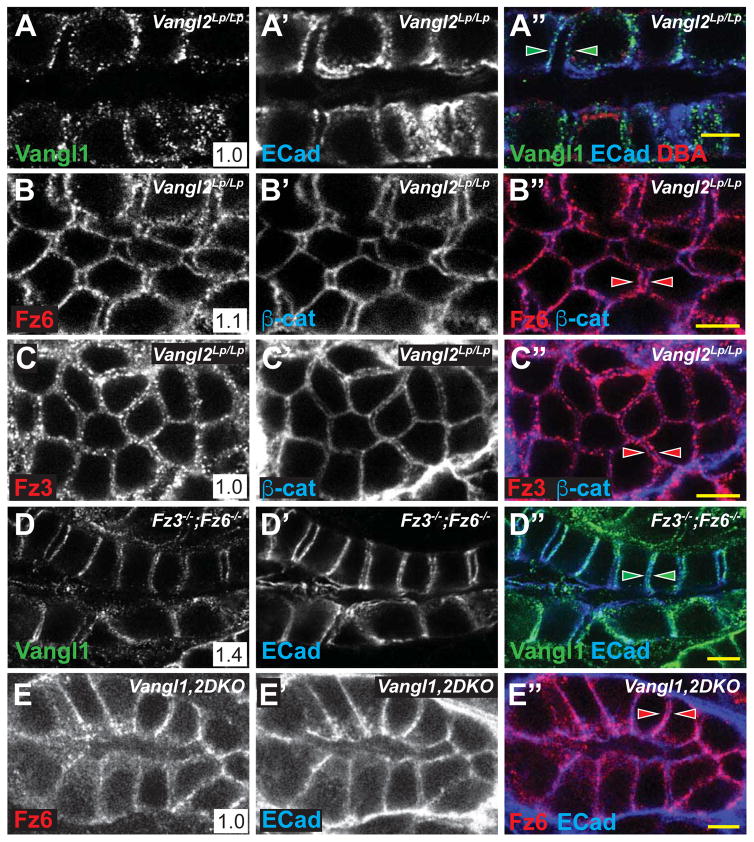
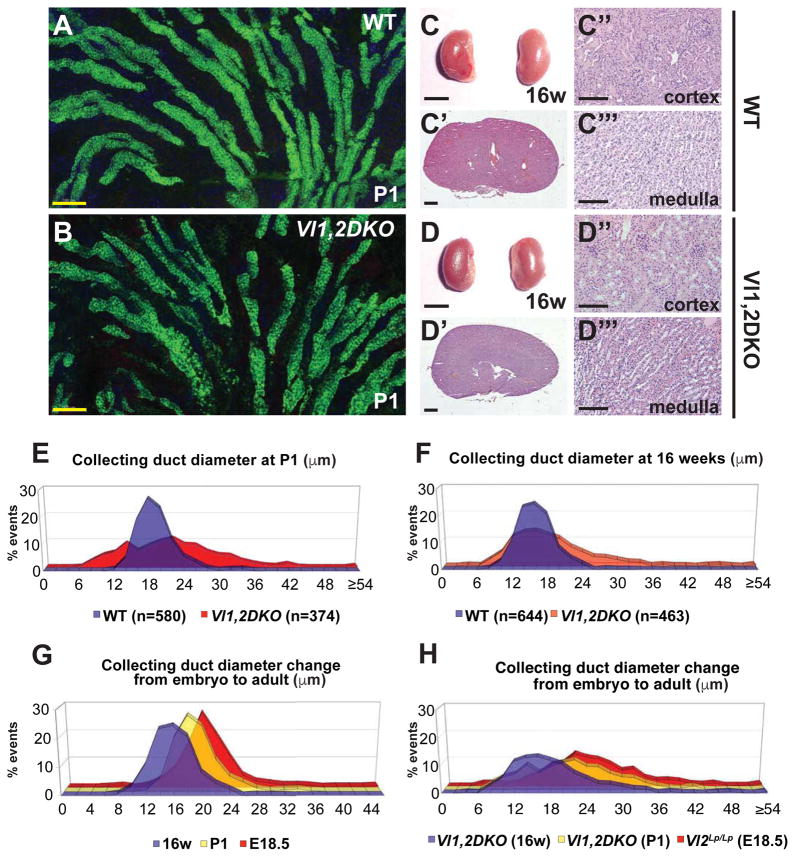
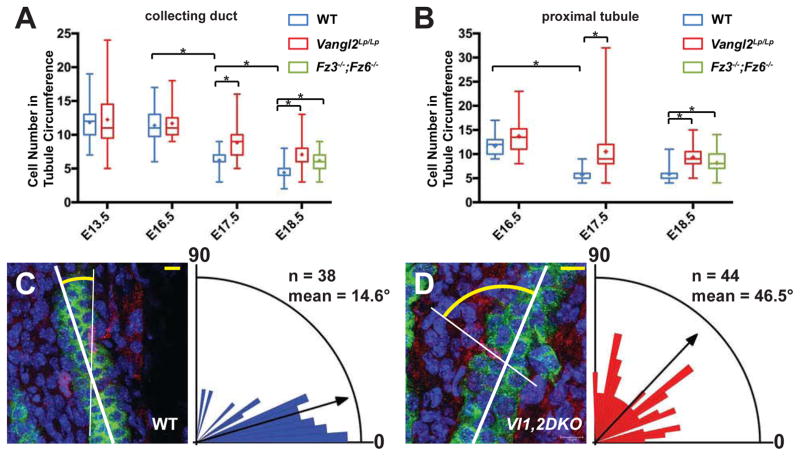
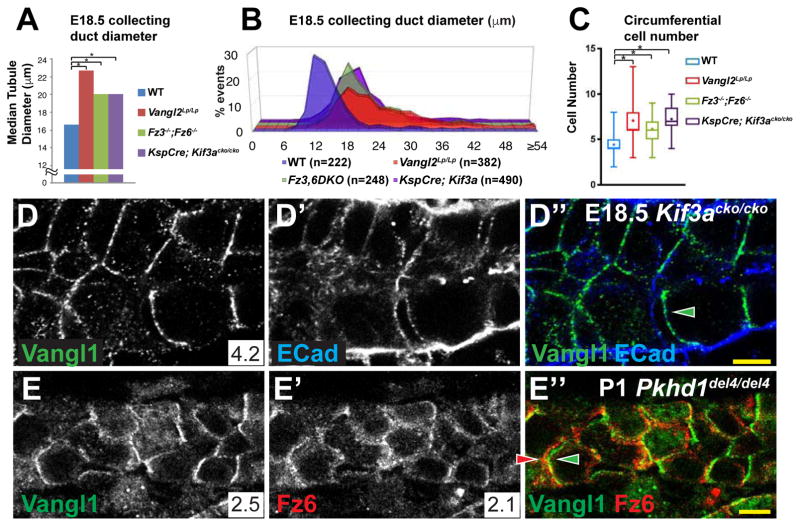
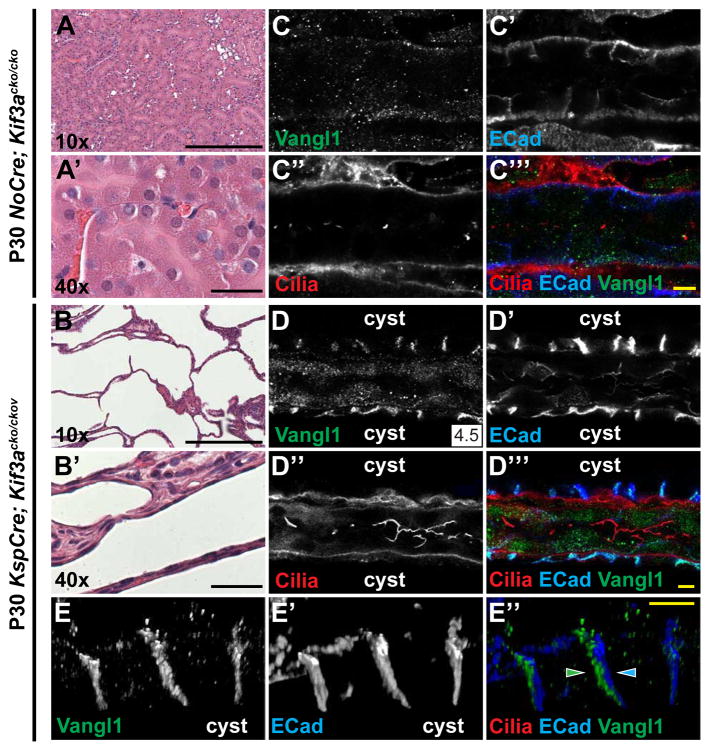
Oriented cell division (OCD) and convergent extension (CE) shape developing renal tubules, and their disruption has been associated with polycystic kidney disease (PKD) genes, the majority of which encode proteins that localize to primary cilia. Core planar cell polarity (PCP) signaling controls OCD and CE in other contexts, leading to the hypothesis that disruption of PCP signaling interferes with CE and/or OCD to produce PKD. Nonetheless, the contribution of PCP to tubulogenesis and cystogenesis is uncertain, and two major questions remain unanswered. Specifically, the inference that mutation of PKD genes interferes with PCP signaling is untested, and the importance of PCP signaling for cystogenic PKD phenotypes has not been examined. We show that, during proliferative stages, PCP signaling polarizes renal tubules to control OCD. However, we find that, contrary to the prevailing model, PKD mutations do not disrupt PCP signaling but instead act independently and in parallel with PCP signaling to affect OCD. Indeed, PCP signaling that is normally downregulated once development is completed is retained in cystic adult kidneys. Disrupting PCP signaling results in inaccurate control of tubule diameter, a tightly regulated parameter with important physiological ramifications. However, we show that disruption of PCP signaling is not cystogenic. Our results suggest that regulating tubule diameter is a key function of PCP signaling but that loss of this control does not induce cysts.
Keywords: oriented cell division; planar cell polarity; polycystic kidney disease; renal tubule diameter.
Copyright © 2017 Elsevier Ltd. All rights reserved.
Figures
Similar articles
-
Polycystic kidney disease: the complexity of planar cell polarity and signaling during tissue regeneration and cyst formation.Biochim Biophys Acta. 2011 Oct;1812(10):1249-55. doi: 10.1016/j.bbadis.2011.05.005. Epub 2011 May 27. Biochim Biophys Acta. 2011. PMID: 21640821 Review.
-
Role of the Polycystins in Cell Migration, Polarity, and Tissue Morphogenesis.Cells. 2015 Oct 30;4(4):687-705. doi: 10.3390/cells4040687. Cells. 2015. PMID: 26529018 Free PMC article. Review.
-
Loss of oriented cell division does not initiate cyst formation.J Am Soc Nephrol. 2010 Feb;21(2):295-302. doi: 10.1681/ASN.2009060603. Epub 2009 Dec 3. J Am Soc Nephrol. 2010. PMID: 19959710 Free PMC article.
-
Mechanism of cystogenesis by Cd79a-driven, conditional mTOR activation in developing mouse nephrons.Sci Rep. 2023 Jan 10;13(1):508. doi: 10.1038/s41598-023-27766-2. Sci Rep. 2023. PMID: 36627370 Free PMC article.
-
Wnt9b signaling regulates planar cell polarity and kidney tubule morphogenesis.Nat Genet. 2009 Jul;41(7):793-9. doi: 10.1038/ng.400. Epub 2009 Jun 21. Nat Genet. 2009. PMID: 19543268 Free PMC article.
Cited by
-
Prickle isoform participation in distinct polarization events in the Drosophila eye.PLoS One. 2022 Feb 11;17(2):e0262328. doi: 10.1371/journal.pone.0262328. eCollection 2022. PLoS One. 2022. PMID: 35148314 Free PMC article.
-
Differential role of planar cell polarity gene Vangl2 in embryonic and adult mammalian kidneys.PLoS One. 2020 Mar 23;15(3):e0230586. doi: 10.1371/journal.pone.0230586. eCollection 2020. PLoS One. 2020. PMID: 32203543 Free PMC article.
-
Malformation of Tear Ducts Underlies the Epiphora and Precocious Eyelid Opening in Prickle 1 Mutant Mice: Genetic Implications for Tear Duct Genesis.Invest Ophthalmol Vis Sci. 2020 Nov 2;61(13):6. doi: 10.1167/iovs.61.13.6. Invest Ophthalmol Vis Sci. 2020. PMID: 33141892 Free PMC article.
-
Vangl-dependent mesenchymal thinning shapes the distal lung during murine sacculation.Dev Cell. 2024 May 20;59(10):1302-1316.e5. doi: 10.1016/j.devcel.2024.03.010. Epub 2024 Apr 2. Dev Cell. 2024. PMID: 38569553 Free PMC article.
-
A role for Myo-II zipper and spaghetti squash in Gliotactin-dependent Drosophila melanogaster wing hair planar cell polarity.PLoS One. 2025 Jul 23;20(7):e0328970. doi: 10.1371/journal.pone.0328970. eCollection 2025. PLoS One. 2025. PMID: 40700419 Free PMC article.
References
-
- Kagan KO, Dufke A, Gembruch U. Renal cystic disease and associated ciliopathies. Curr Opin Obstet Gynecol 2017 - PubMed
-
- Cornec-Le Gall E, Audrezet MP, Le Meur Y, Chen JM, Ferec C. Genetics and pathogenesis of autosomal dominant polycystic kidney disease: 20 years on. Hum Mutat. 2014;35:1393–1406. - PubMed
-
- Yoder BK. Role of primary cilia in the pathogenesis of polycystic kidney disease. J Am Soc Nephrol. 2007;18:1381–1388. - PubMed
MeSH terms
Grants and funding
LinkOut - more resources
Full Text Sources
Other Literature Sources
