Review
. 2017 Sep 29:11:545.
doi: 10.3389/fnins.2017.00545. eCollection 2017.

Top-Down Control of Visual Attention by the Prefrontal Cortex. Functional Specialization and Long-Range Interactions

Affiliations
Review

Top-Down Control of Visual Attention by the Prefrontal Cortex. Functional Specialization and Long-Range Interactions

Sofia Paneri et al. Front Neurosci. .

Abstract

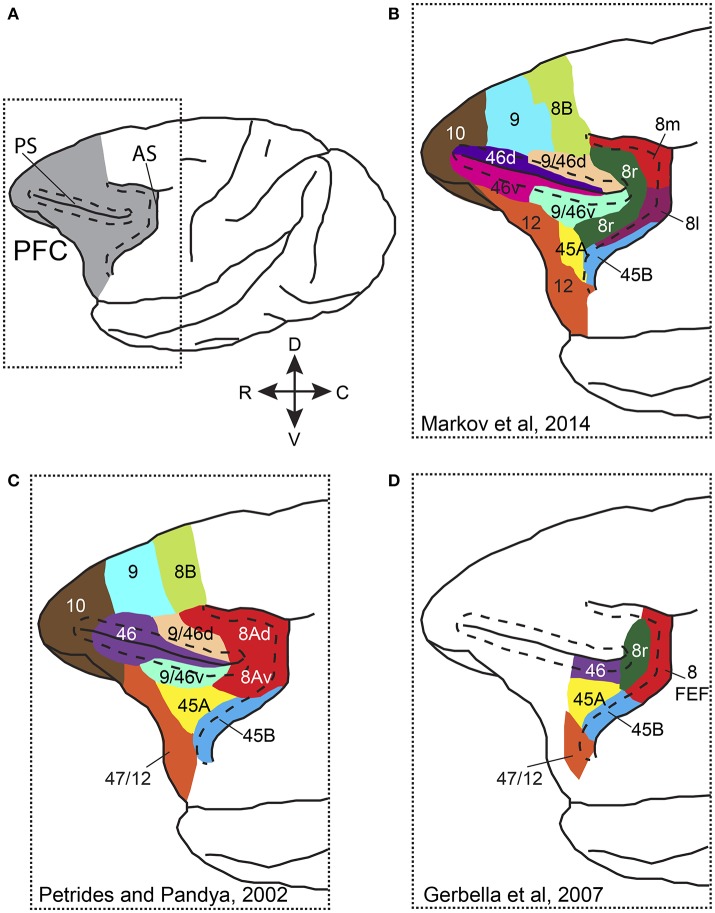
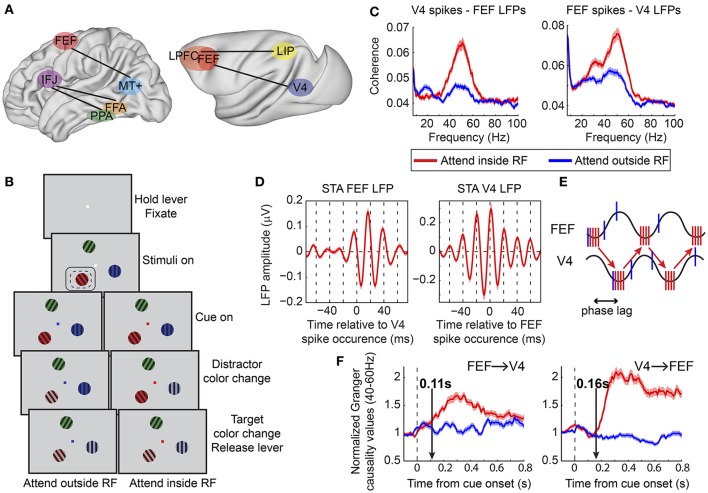
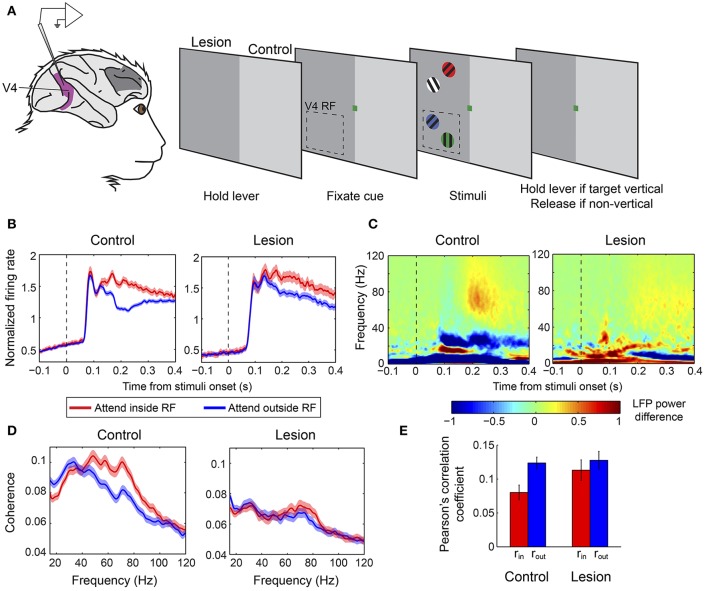
The ability to select information that is relevant to current behavioral goals is the hallmark of voluntary attention and an essential part of our cognition. Attention tasks are a prime example to study at the neuronal level, how task related information can be selectively processed in the brain while irrelevant information is filtered out. Whereas, numerous studies have focused on elucidating the mechanisms of visual attention at the single neuron and population level in the visual cortices, considerably less work has been devoted to deciphering the distinct contribution of higher-order brain areas, which are known to be critical for the employment of attention. Among these areas, the prefrontal cortex (PFC) has long been considered a source of top-down signals that bias selection in early visual areas in favor of the attended features. Here, we review recent experimental data that support the role of PFC in attention. We examine the existing evidence for functional specialization within PFC and we discuss how long-range interactions between PFC subregions and posterior visual areas may be implemented in the brain and contribute to the attentional modulation of different measures of neural activity in visual cortices.

Keywords: executive control; feature attention; long-range interactions; oscillatory synchrony; prefrontal cortex; review; spatial attention; visual cortex.


Figures

Figure 1
Figure 1
Parcellation and nomenclature of PFC areas in different anatomical studies. (A) Dorsolateral view of the macaque brain with PFC colored in gray. Dotted rectangle outlines the area that is shown in (B–D). Dashed line in front of AS follows the lip of the anterior bank of the sulcus, whereas dashed lines around PS outline the dorsal and ventral banks of the sulcus. (B) Parcellation of prefrontal areas according to Markov et al. (2014). (C) Parcellation of prefrontal areas according to Petrides and Pandya (2002). (D) Parcellation of prefrontal areas according to Gerbella et al. (2007). Note that for the different parcellation schemes, the PFC areas are drawn on the same cartoon brain and thus, areal borders and extent are approximate. AS, arcuate sulcus; PS, principal sulcus, C, caudal; R, rostral; D, dorsal; V, ventral.
Figure 2
Figure 2
Functional oscillatory coupling between prefrontal and posterior visual areas during attention. (A) Schematic of areas involved in long-range oscillatory interactions with attention in the human (left) and in the macaque (right) brain, as described in Buschman and Miller (2007), Siegel et al. (2008), Gregoriou et al. (2009b), and Baldauf and Desimone (2014). Brain surfaces were obtained from the Scalable Brain Atlas website (Bakker et al., 2015). The human brain template is taken from the Harvard-Oxford atlas (original data from Frazier et al., ; Desikan et al., ; Makris et al., ; Goldstein et al., 2007). The macaque brain corresponds to a macaque MRI registered to the F99 space of the Caret software package (Van Essen et al., 2001). (B) Behavioral task employed in Gregoriou et al. (2009b). Monkeys had to hold a lever to initiate the trial and were required to fixate a central spot. Subsequently, three sinusoidal drifting gratings of different color appeared on the screen. Monkeys had to maintain fixation of the central spot. The fixation spot was then replaced by a cue whose color indicated the target. The monkeys had to monitor the target covertly and respond by releasing the lever when the target changed color. Potential color changes of distractors had to be ignored. Dashed- and solid-line rectangles represent hypothetical RFs of V4 and FEF sites, respectively. (C) Spike-LFP coherence between V4 spikes and FEF LFPs (left) and between FEF spikes and V4 LFPs (right). Enhanced coherence was found in both cases in the gamma frequency range (40–60 Hz) when attention was directed to a stimulus inside the joint V4, FEF, RF (compare red to blue lines). A taper bandwidth of ±7 Hz was used to re-analyze the dataset used in Gregoriou et al. (2009b). (D) Spike triggered average (STA) of FEF (left) and V4 (right) LFPs filtered between 35 and 80 Hz. Zero on x-axis corresponds to the time a V4 (left) or FEF (right) spike occurred. Both plots show that spikes in one area tended to occur about half a gamma cycle (about 10 ms) earlier than the time of maximal excitability in the other area (trough in LFP gamma oscillation). (E) Schematic description of potential facilitatory effect of inter-areal delays in long-range neuronal communication. Sine waves represent excitability fluctuations in the two areas (gamma oscillations in the LFP). Red and blue vertical lines illustrate action potentials fired for attended (attend inside RF) and unattended (attend outside RF) stimuli, respectively. Spikes in one area that arrive at the phase of maximal excitability in the other area increase the probability of spike generation in the second area (red vertical lines at trough of sine waves). The phase lag between excitability fluctuations in the two areas facilitates this effect for attended stimuli that are associated with coherent spikes fired at the right phase. Less coherent spikes fired for unattended stimuli (blue vertical lines) are not as effective. (F) Average of normalized Granger causality values between 40–60 Hz across all V4-FEF LFP pairs. FEF to V4 directional influences are shown on the left graph and V4 to FEF on the right graph. Vertical arrows point to the latency of the attentional effect, which was earlier in the FEF to V4 direction (0.11 s compared to 0.16 s). (B,D,F) Modified from Gregoriou et al. (2009b), (E) modified from Gregoriou et al. (2009a).
Figure 3
Figure 3
Effect of PFC lesion on the attentional modulation of neural activity in V4. (A) Extracellular recordings were carried out in V4 (purple) in monkeys with a unilateral PFC lesion (dark gray patch on monkey brain). Monkeys were required to hold a lever to initiate the trial. Subsequently, a color cue would be presented, which indicated the color of the target stimulus. Four gratings of different colors appeared on the screen, two in the upper (outside the RF) and two in the lower (inside the RF) quadrant. The monkeys were asked to release the lever if the target was a vertical grating and keep holding it if it was non-vertical. Dashed-line rectangle represents a hypothetical V4 RF. When recordings were carried out in the control hemisphere stimuli were presented in the intact hemifield (right half of the screen, light gray), whereas during recording sessions from the lesion-affected hemisphere stimuli were presented in the opposite hemifield (left half of the screen, dark gray). (B) Population average V4 firing rates in the two attention conditions from the control (left graph) and lesion affected hemisphere (right graph). Responses are aligned on the presentation of stimuli. Red lines illustrate responses when the target was inside the V4 RF and blue lines correspond to responses when the target appeared outside the RF. Attention effects were significantly smaller in the absence of PFC. (C) Time-frequency plots of attentional effects on V4 LFP power (attend inside RF—attend outside RF) in the control (left) and lesion affected hemisphere (right). The attention-induced enhancement in gamma power (60–90 Hz) and reduction in beta power (15–30 Hz) were significantly smaller in the lesion-affected hemisphere. (D) Attentional effects on spike-LFP coherence within V4 in the control (left) and lesion-affected hemisphere (right). The enhancement in gamma coherence is significantly smaller in the lesion-affected hemisphere. (E) Average Pearson's correlation between spike counts of pairs of V4 neurons (noise correlation) in the control and lesion-affected hemisphere. Red bars correspond to average correlation values with attention inside the RF (rin), blue bars correspond to average correlation values with attention outside the RF (rout). Error bars indicate mean ± S.E.M. The reduction in noise correlation with spatial attention is significantly larger in the control hemisphere. All graphs (A–E) were modified from Gregoriou et al. (2014).

References

    1. Ardid S., Wang X. J., Gomez-Cabrero D., Compte A. (2010). Reconciling coherent oscillation with modulation of irregular spiking activity in selective attention: gamma-range synchronization between sensory and executive cortical areas. J. Neurosci. 30, 2856–2870. 10.1523/JNEUROSCI.4222-09.2010 - DOI - PMC - PubMed
    1. Armstrong K. M., Chang M. H., Moore T. (2009). Selection and maintenance of spatial information by frontal eye field neurons. J. Neurosci. 29, 15621–15629. 10.1523/JNEUROSCI.4465-09.2009 - DOI - PMC - PubMed
    1. Azouz R., Gray C. M. (2003). Adaptive coincidence detection and dynamic gain control in visual cortical neurons in vivo. Neuron 37, 513–523. 10.1016/S0896-6273(02)01186-8 - DOI - PubMed
    1. Bakker R., Tiesinga P., Kotter R. (2015). The scalable brain atlas: instant web-based access to public brain atlases and related content. Neuroinformatics 13, 353–366. 10.1007/s12021-014-9258-x - DOI - PMC - PubMed
    1. Baldauf D., Desimone R. (2014). Neural mechanisms of object-based attention. Science 344, 424–427. 10.1126/science.1247003 - DOI - PubMed

LinkOut - more resources