. 2017 Sep 20:8:1784.
doi: 10.3389/fmicb.2017.01784. eCollection 2017.

Analyzing the Complex Regulatory Landscape of Hfq - an Integrative, Multi-Omics Approach

Affiliations

Analyzing the Complex Regulatory Landscape of Hfq - an Integrative, Multi-Omics Approach

Lucia Grenga et al. Front Microbiol. .

Abstract

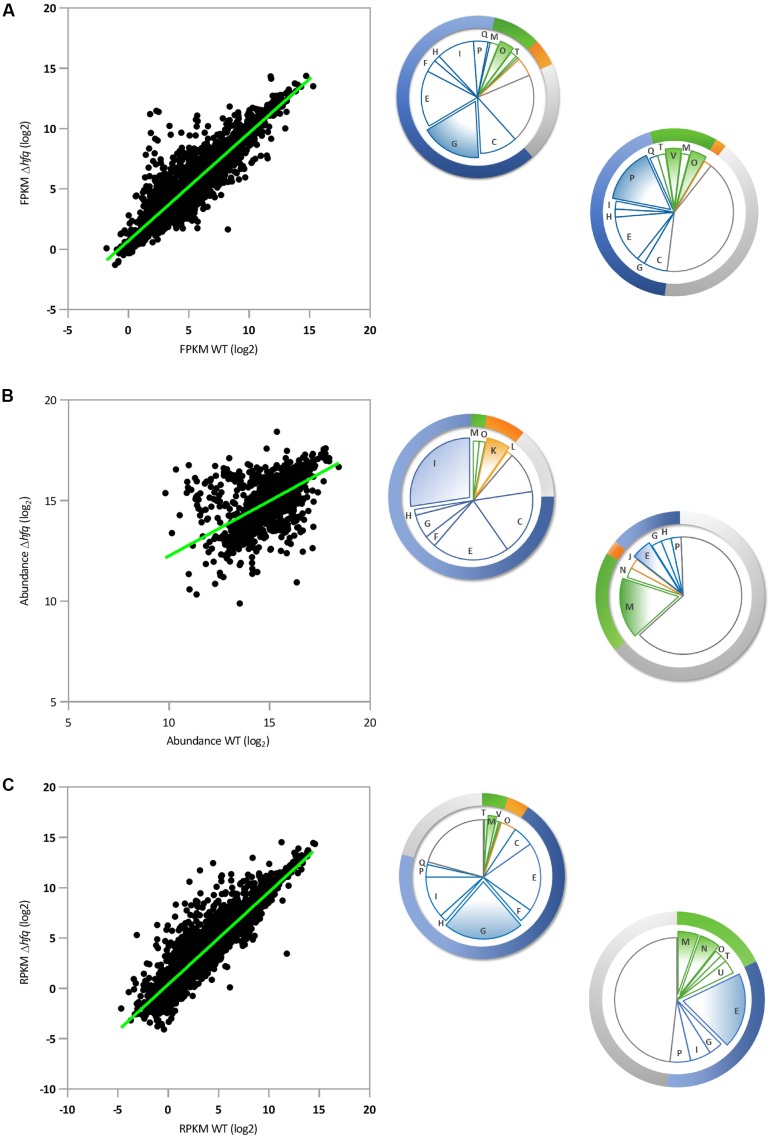
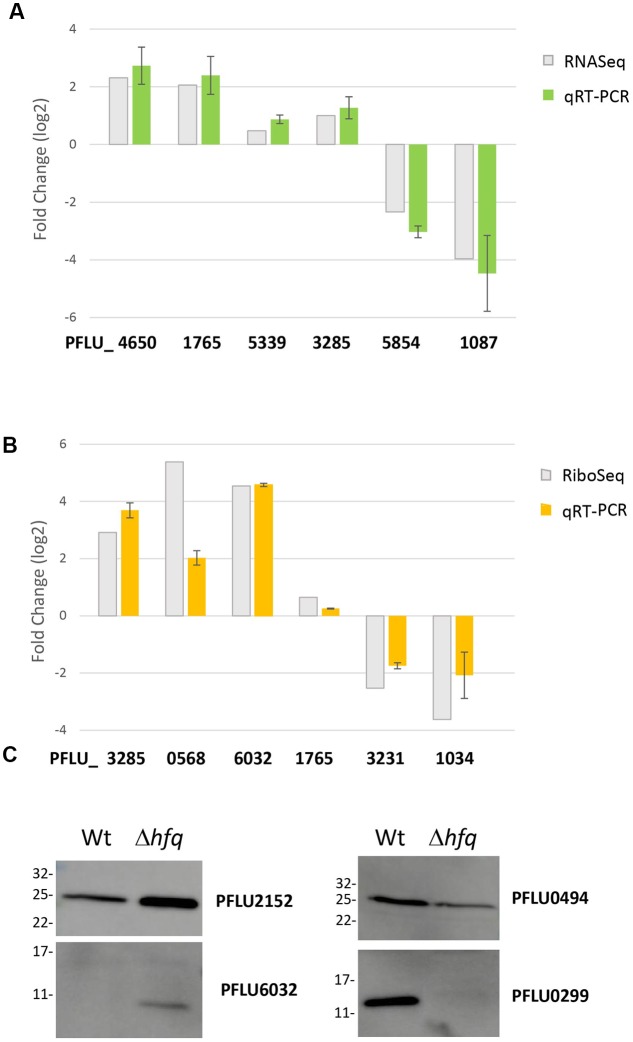
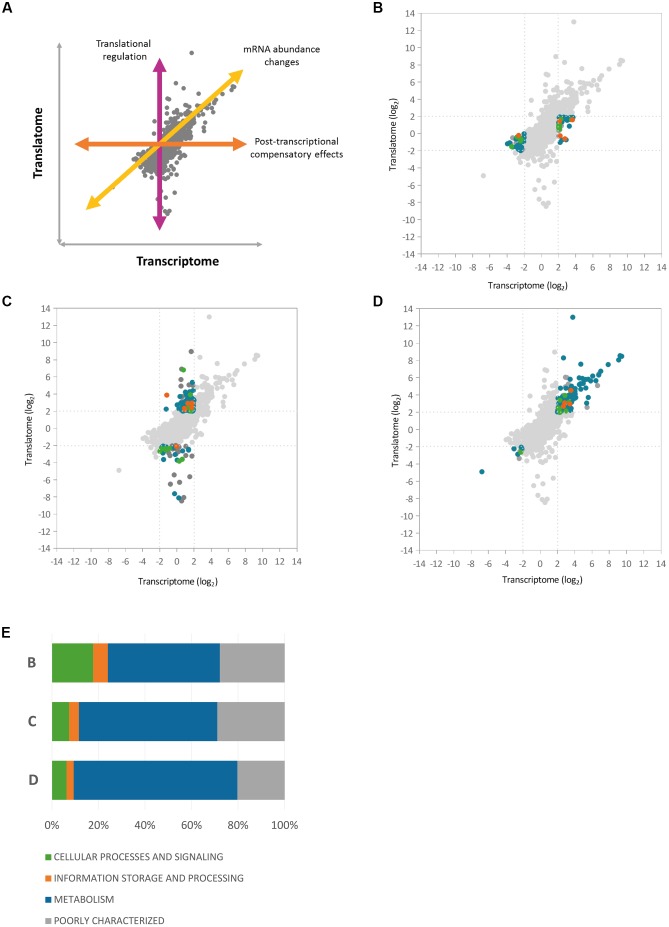
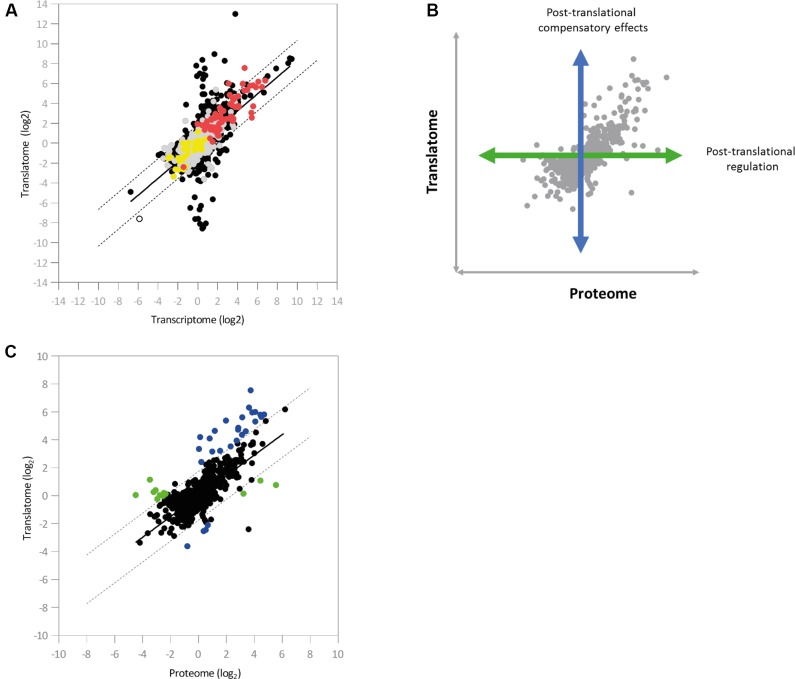
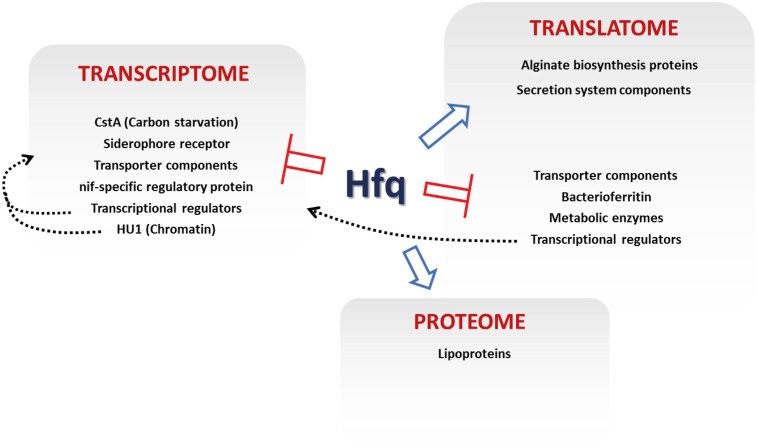
The ability of bacteria to respond to environmental change is based on the ability to coordinate, redirect and fine-tune their genetic repertoire as and when required. While we can learn a great deal from reductive analysis of individual pathways and global approaches to gene regulation, a deeper understanding of these complex signaling networks requires the simultaneous consideration of several regulatory layers at the genome scale. To highlight the power of this approach we analyzed the Hfq transcriptional/translational regulatory network in the model bacterium Pseudomonas fluorescens. We first used extensive 'omics' analyses to assess how hfq deletion affects mRNA abundance, mRNA translation and protein abundance. The subsequent, multi-level integration of these datasets allows us to highlight the discrete contributions by Hfq to gene regulation at different levels. The integrative approach to regulatory analysis we describe here has significant potential, for both dissecting individual signaling pathways and understanding the strategies bacteria use to cope with external challenges.

Keywords: Hfq; Pseudomonas; integrative approach; multi-omics analysis; ribosomal profiling.


Figures

FIGURE 1
FIGURE 1
Parallel global analyses of the P. fluorescens Δhfq mutant. (A) Transcriptomic analysis: Scatter-plot representing pairwise comparison of mean log2 FPKM expression values for P. fluorescens WT and Δhfq (n = 5910). (B) Proteomic analysis: Scatter-plot representing pairwise comparison of mean log2 protein abundance values for P. fluorescens WT and Δhfq (n = 2019). (C) Translatomic analysis: Scatter-plot representing pairwise comparison of mean log2 RPKM expression values for P. fluorescens WT and Δhfq (n = 5910). The pie chart sections indicate the proportion of significantly up- (top left) or down- (bottom right) regulated genes in the Δhfq background (according to the COG database) in each functional category. Categories are color-coded as follows: blue – metabolism, green – cellular processes and signaling, orange – information storage and processing, and gray – poorly characterized. The letters in each section of the chart refer to the respective COG functional categories. The most abundant categories are expanded from the chart in each case. A complete list of genes and information on their predicted functions are given in Supplementary Table S1.
FIGURE 2
FIGURE 2
Validation of candidate loci from the global analysis datasets. (A) Comparative mRNA abundance data for selected loci from the hfq transcriptome. (B) Comparative mRNA abundance data for selected loci from the hfq translatome. In each case, log2 fold-change values are plotted for the hfq mutant versus WT SBW25. qRT-PCR values are presented alongside the corresponding fold-change observed in (A) the RNA-Seq experiment and (B) the Ribo-Seq experiment. The experiments were repeated at least twice. Data represents mean ± SD. (C) Western blots of selected flag-tagged proteins whose abundance changes in the Hfq proteome. The experiments were repeated at least twice. The representative blots are presented.
FIGURE 3
FIGURE 3
Correlation between Hfq transcriptome and translatome. Scatter-plots representing the pairwise comparisons of log2 ratios between Hfq transcriptome and translatome, highlighting three different regulatory classes of Hfq targets. (A) Illustration of the different regulatory effects on gene expression (B) Scatter-plot highlighting loci that showed altered mRNA levels in the hfq mutant but no corresponding change in translation (C) Genes showing significant translational perturbation without a comparable shift in the transcriptome. (D) Genes affected at both transcript abundance and translational levels. (E) The graph shows the relative abundance of each COG functional category at each of the regulatory levels shown in (B–D).
FIGURE 4
FIGURE 4
Integration of the regulatory datasets. (A) Color-coded integration of proteomic data into the pairwise comparison between the Hfq transcriptome and translatome (n = 5910). Red and yellow dots indicate loci that show up- and down-regulated protein abundance, respectively, in the Δhfq mutant. Loci exhibiting no significant change in protein abundance are indicated in gray (Supplementary Table S4). (B) Illustration of the effects of post-translational control on protein abundance. (C) Scatter-plot showing the pairwise comparisons of log2 ratios between the Δhfq translatome and proteome (n = 1867). Post-translationally regulated loci are marked in green, while loci displaying compensatory post-translational effects are marked in blue (Supplementary Table S4). In both cases, dashed lines indicate two-fold ratios of differential expression from the regression line (in black).
FIGURE 5
FIGURE 5
Regulatory effects of Hfq in P. fluorescens. The key loci controlled by different levels of Hfq regulation are indicated. Blue arrows show positive Hfq control, red bars denote negative control. Dashed gray arrows show proposed indirect regulations by transcriptional regulation and chromatin remodeling.

References

    1. Arraiano C. M., Andrade J. M., Domingues S., Guinote I. B., Malecki M., Matos R. G., et al. (2010). The critical role of RNA processing and degradation in the control of gene expression. FEMS Microbiol. Rev. 34 883–923. 10.1111/j.1574-6976.2010.00242.x - DOI - PubMed
    1. Arraiano C. M., Maquat L. E. (2003). Post-transcriptional control of gene expression: effectors of mRNA decay. Mol. Microbiol. 49 267–276. 10.1046/j.1365-2958.2003.03545.x - DOI - PubMed
    1. Awadé A. C., Cleuziat P., Gonzalès T., Robert-Baudouy J. (1994). Pyrrolidone carboxyl peptidase (Pcp): an enzyme that removes pyroglutamic acid (pGlu) from pGlu-peptides and pGlu-proteins. Proteins 20 34–51. 10.1002/prot.340200106 - DOI - PubMed
    1. Becker A. H., Oh E., Becker A. H., Weissman J. S., Kramer G., Bukau B. (2013). Selective ribosome profiling as a tool for studying the interaction of chaperones and targeting factors with nascent polypeptide chains and ribosomes. Nat. Protoc. 8 2212–2239. 10.1038/nprot.2013.133 - DOI - PMC - PubMed
    1. Bilusic I., Popitsch N., Rescheneder P., Schroeder R., Lybecker M. (2014). Revisiting the coding potential of the E. coli genome through Hfq co-immunoprecipitation. RNA Biol. 11 641–654. 10.4161/rna.29299 - DOI - PMC - PubMed