. 2017 Sep 28:8:1214.
doi: 10.3389/fimmu.2017.01214. eCollection 2017.

Cannabinoid Receptor 1 Participates in Liver Inflammation by Promoting M1 Macrophage Polarization via RhoA/NF-κB p65 and ERK1/2 Pathways, Respectively, in Mouse Liver Fibrogenesis

Affiliations

Cannabinoid Receptor 1 Participates in Liver Inflammation by Promoting M1 Macrophage Polarization via RhoA/NF-κB p65 and ERK1/2 Pathways, Respectively, in Mouse Liver Fibrogenesis

Lei Tian et al. Front Immunol. .

Abstract

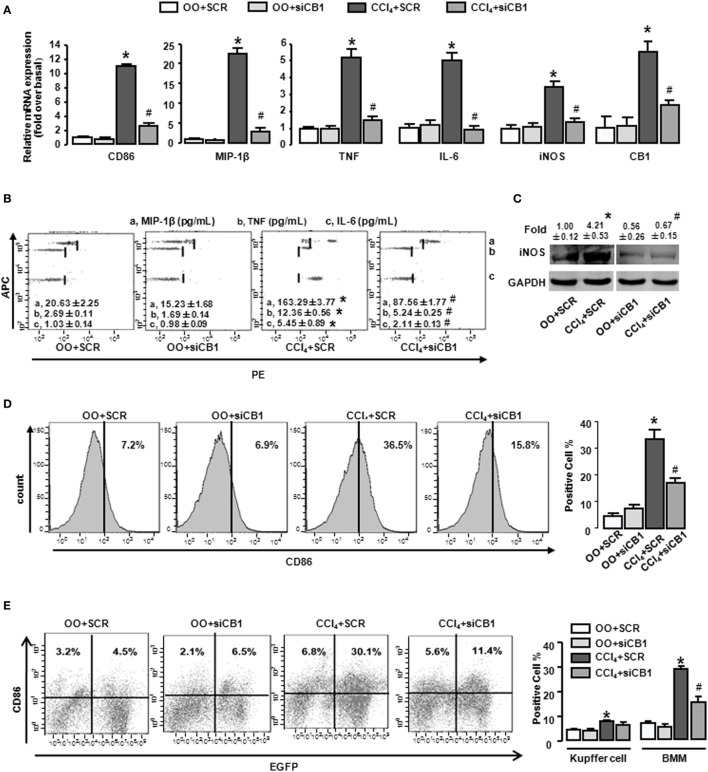
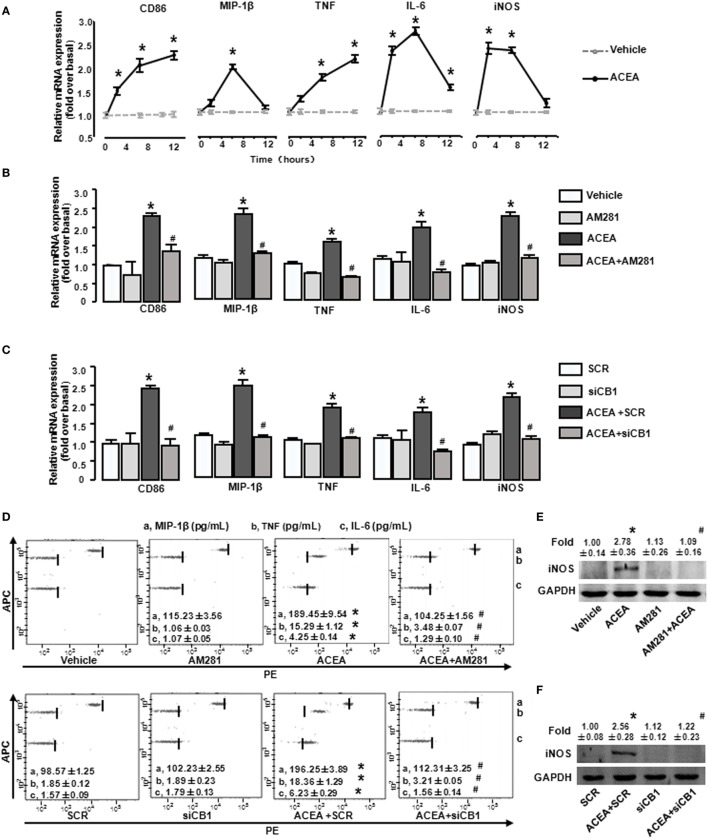
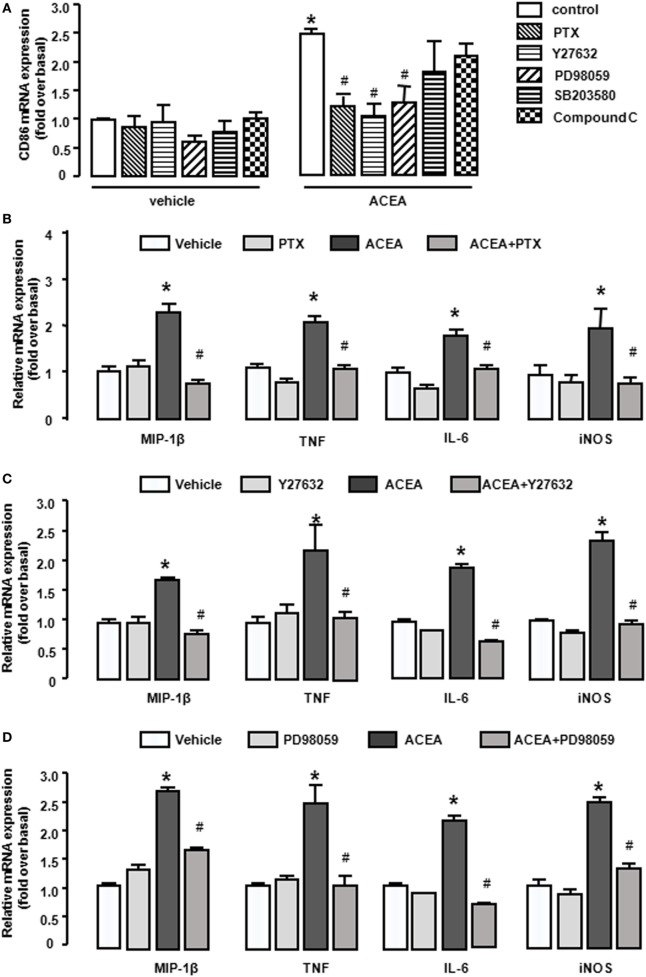
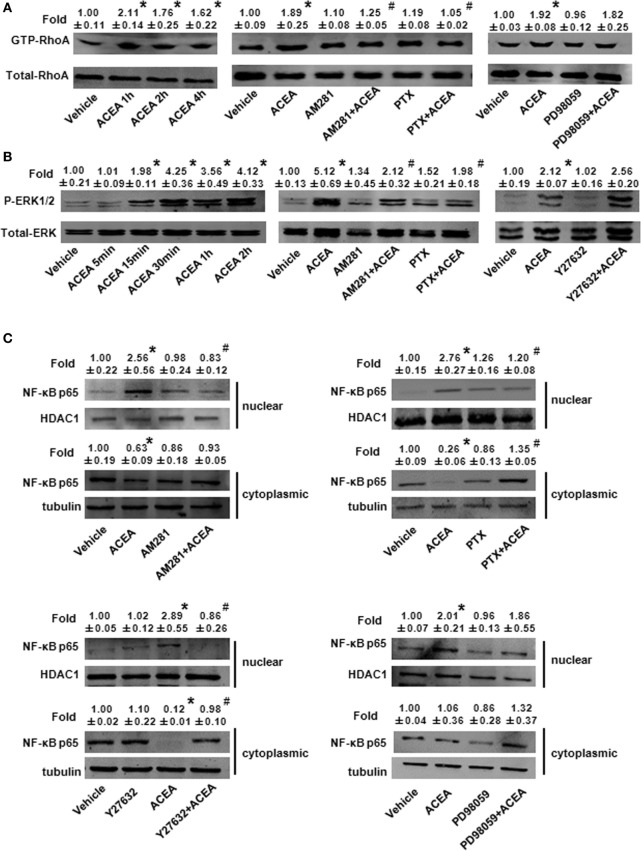
Macrophage M1/M2 polarization mediates tissue damage and inflammatory responses. Cannabinoid receptor (CB) 1 participated in liver fibrogenesis by affecting bone marrow (BM)-derived monocytes/macrophages (BMMs) activation. However, the knowledge of whether CB1 is involved in the polarization of BMMs remains limited. Here, we found M1 gene signatures (including CD86, MIP-1β, tumor necrosis factor, IL-6, and inducible nitric oxide synthase) and the amount of M1 macrophages (CD86+ cells, gated by F4/80) were significantly elevated in carbon tetrachloride (CCl4)-induced mouse injured livers, while that of M2 type macrophages had little change by RT-qPCR and fluorescence-activated cell sorting (FACS). Our preceding study confirmed CB1 was involved in CCl4-induced liver fibrogenesis. Our results noted CB1 expression showed positive correlation with CD86. Blockade of CB1 by its antagonist or siRNA in vivo downregulated the mRNA and protein levels of M1 markers using RT-qPCR, western blot, and Cytometric Bead Array (CBA) assays, and reduced the proportion of M1 macrophages. Moreover, chimera mouse models, which received BM transplants from EGFP-transgenic mice or clodronate liposome injection mouse models, in which Kupffer cells were depleted, were performed to clarify the role of CB1 on the polarization of Kupffer cells and BMMs. We found that CB1 was especially involved in BMM polarization toward M1 phenotype but have no effect on that of Kupffer cells. The reason might due to the lower CB1 expression in Kupffer cells than that of BMMs. In vitro, we discovered CB1 was involved in the polarization of BMMs toward M1. Furthermore, CB1-induced M1 polarization was apparently impaired by PTX [G(α)i/o protein inhibitor], Y27632 (ROCK inhibitor), and PD98059 [extracellular signal-regulated kinase (ERK) inhibitor], while SB203580 (p38 inhibitor) and compound C (AMPK inhibitor) had no such effect. ACEA (CB1 agonist) activated G(α)i/o coupled CB1, then enlarged GTP-bound Rho and phosphor-ERK1/2, independently. NF-κB p65 nuclear translocation is also a marker of M1 phenotype macrophages. We found that CB1 switched on NF-κB p65 nuclear translocation only depending on G(α)i/o/RhoA signaling pathway.

Conclusion: CB1 plays a crucial role in regulating M1 polarization of BMMs in liver injury, depending on two independent signaling pathways: G(α)i/o/RhoA/NF-κB p65 and G(α)i/o/ERK1/2 pathways.

Keywords: NF-κB p65; Rho-ROCK signal; cannabinoid receptor 1; macrophage polarization; siRNA in vivo.


Figures

Figure 1
Figure 1
M1 and M2 gene signatures in mouse livers showed changes during CCl4 administration. Expressions of M1 and M2 markers were determined by RT-qPCR and fluorescence-activated cell sorting (FACS). At different times after CCl4 administration, mRNA levels of M1 markers (CD86, MIP-1β, tumor necrosis factor, IL-6, and inducible nitric oxide synthase) (A) and M2 markers (Arg1, CD163, and CD206) (B) were measured. Primary liver macrophages (F4/80+) sorted from treated livers. Representative flow cytometric histograms of total M1-type macrophages (C). Quantification of FACS for cell proportion (D). *P < 0.05 compared with the group of olive oil administration on the same time (n = 6/group).
Figure 2
Figure 2
CB1 positively correlated with M1-type markers (CD86) and blockade of CB1 especially reduced the proportion of M1-type bone marrow-derived monocytes/macrophages (BMMs) in injured liver. The correlation between mRNA levels of CB1 and CD86 and arginase1 (A). M1 markers were measured by RT-qPCR, western blot, and CBA. After CCl4 administration for 4 weeks, the mRNA levels of M1 type markers were measured (B). Representative scatter plots of CBA are shown (C). Three bead populations represented MIP-1β, TNF, and IL-6 based on allophycocyanin fluorescence intensity from high to low. The number presented the concentration of these proteins. The expression of inducible nitric oxide synthase was measured by western blot (D). Among macrophages of mouse liver that were isolated, total M1-type macrophages (CD86+) (E), M1-type cell of BM origin (EGFP+CD86+) [(F) left] and M1 type of Kupffer cell (EGFPCD86+) [(F) left] were analyzed by fluorescence-activated cell sorting (FACS). Quantification of FACS for cell proportion [(E) right and (F) right]. *P < 0.05 compared with olive oil plus vehicle group, #P < 0.05 compared with CCl4 plus vehicle group (n = 6/group).
Figure 3
Figure 3
CB1-siRNA in vivo reduced the polarization of bone marrow-derived monocytes/macrophages (BMMs) toward M1 phenotype. Effectiveness of CB1-siRNA in vivo was measured by RT-qPCR (A). M1 markers were measured by RT-qPCR (A), western blot (C), and CBA (B). Among macrophages of mouse liver that were isolated, total M1-type macrophages (D), M1 type of BM origin [(E) left], and M1 type of Kupffer cell [(E) left] were analyzed by fluorescence-activated cell sorting (FACS). Quantification of FACS for cell proportion [(D) right and (E) right]. *P < 0.05 compared with olive oil plus vehicle group, #P < 0.05 compared with CCl4 plus vehicle group (n = 6/group).
Figure 4
Figure 4
Blockade of CB1 reduced the polarization of bone marrow-derived monocytes/macrophages (BMMs) toward M1 phenotype but had no effect on that of Kupffer cells in vivo. The clodronate liposome injection was performed to delete Kupffer cell. Elimination efficiency was measured by immunofluorescence and RT-qPCR. Representative liver images were showed by confocal microscopy to track macrophages (F4/80+, red) (A). DAPI was used to visualize nuclei (blue). Scale bars, 25 µm. The mRNA level of F4/80 was measured (B). M1 markers were determined by RT-qPCR (C). *P < 0.05 compared with the group of olive oil administration on the same time (n = 6/group).
Figure 5
Figure 5
Blockade of CB1 especially reduced bone marrow-derived monocyte/macrophage (BMM) polarization toward M1 phenotype and have no effect on that of Kupffer cells in vivo. The clodronate liposome injection was performed to delete Kupffer cell. Among macrophages of mouse liver that were isolated, total M1-type macrophages (A) were analyzed by fluorescence-activated cell sorting (FACS). M1 markers were measured by western blot (C) and CBA (B). CB1 expression on Kupffer cells and BMMs were detected by FACS (D). *P < 0.05 compared with olive oil plus vehicle group, #P < 0.05 compared with CCl4 plus vehicle group (n = 6/group).
Figure 6
Figure 6
Activation of CB1 promotes M1 marker expressions in bone marrow-derived monocytes/macrophages (BMMs). BMMs were exposed to ACEA for different times. The mRNA levels of M1 markers were measured (A). BMMs pretreated with 10 µmol/L AM281 or CB1 RNA interference was exposed to ACEA for 5 h. M1 markers were measured by RT-qPCR (B,C), western blot (E,F), and CBA (D). *P < 0.05 compared with control, #P < 0.05 compared with the same treated group without inhibitors (n = 4).
Figure 7
Figure 7
CB1 activation promoted bone marrow-derived monocyte/macrophage (BMM) polarization toward M1 through G(α)i/o, RhoA, and ERK1/2. BMMs were pre-treated with pertussis toxin (20 ng/mL), Y27632 (10 µmol/L), SB203580 (10 µmol/L), PD98059 (10 µmol/L), compound C (10 µmol/L) for 1 h, and followed by 1 µmol/L ACEA treatment for another 6 h. CD86 mRNA expression (A) and M1 other gene signatures (B–D) were evaluated by RT-qPCR. *P < 0.05 compared with control, #P < 0.05 compared with the same treated group without inhibitors (n = 4).
Figure 8
Figure 8
G(α)i/o, RhoA, and ERK1/2 inhibitors impaired CB1-mediated bone marrow-derived monocyte/macrophage (BMM) polarization toward M1. The protein expression levels of M1 markers were measured by CBA (A–C) and western blot (D). *P < 0.05 compared with control, #P < 0.05 compared with the same treated group without inhibitors (n = 4).
Figure 9
Figure 9
ACEA activated G(α)i/o-coupled CB1 and then enlarged GTP-bound Rho and extracellular signal-regulated kinase (ERK) signal, finally promoting bone marrow-derived monocyte/macrophage (BMM) polarization toward M1. In vitro total and active Rho proteins (A), total ERK1/2 and phosphor-ERK1/2 (B) expression and NF-kB p65 nuclear translocation (C) was measured by western blot. *P < 0.05 compared with control, #P < 0.05 compared with the same treated group without inhibitors (n = 5).
Figure 10
Figure 10
NF-κB activation was involved in M1 polarization mediated by CB1. NF-kB p65 (A) and ERK1/2 (C) nuclear translocation were evaluated by immunofluorescence. DAPI was used to visualize nuclei (blue). Scale bars, 25 µm. The mean optical density was measured by high content analysis (B,D). *P < 0.05 compared with control, #P < 0.05 compared with the same treated group without inhibitors (n = 4). Scheme of CB1 promoting bone marrow-derived monocyte/macrophage (BMM) polarization toward M1 phenotype (E).

References

    1. Tacke F, Zimmermann HW. Macrophage heterogeneity in liver injury and fibrosis. J Hepatol (2014) 60:1090–6. 10.1016/j.jhep.2013.12.025 - DOI - PubMed
    1. Sica A, Invernizzi P, Mantovani A. Macrophage plasticity and polarization in liver homeostasis and pathology. Hepatology (2014) 59:2034–42. 10.1002/hep.26754 - DOI - PubMed
    1. Sica A, Mantovani A. Macrophage plasticity and polarization: in vivo veritas. J Clin Invest (2012) 122:787–95. 10.1172/JCI59643 - DOI - PMC - PubMed
    1. Biswas SK, Chittezhath M, Shalova IN, Lim JY. Macrophage polarization and plasticity in health and disease. Immunol Res (2012) 53:11–24. 10.1007/s12026-012-8291-9 - DOI - PubMed
    1. Jourdan T, Godlewski G, Cinar R, Bertola A, Szanda G, Liu J, et al. Activation of the Nlrp3 inflammasome in infiltrating macrophages by endocannabinoids mediates beta cell loss in type 2 diabetes. Nat Med (2013) 19:1132–40. 10.1038/nm.3265 - DOI - PMC - PubMed

LinkOut - more resources