. 2017 Sep 29:8:1701.
doi: 10.3389/fpls.2017.01701. eCollection 2017.

Spermine Regulates Pollen Tube Growth by Modulating Ca2+-Dependent Actin Organization and Cell Wall Structure

Affiliations

Spermine Regulates Pollen Tube Growth by Modulating Ca2+-Dependent Actin Organization and Cell Wall Structure

Iris Aloisi et al. Front Plant Sci. .

Abstract

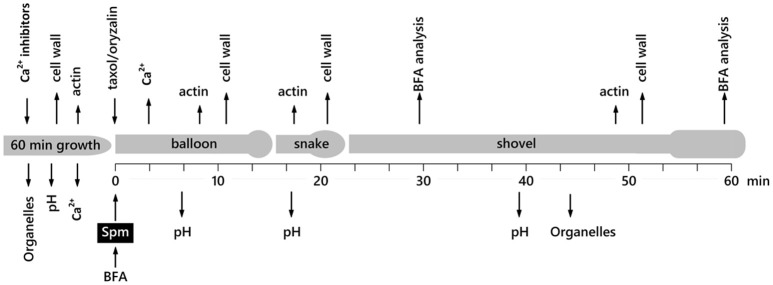
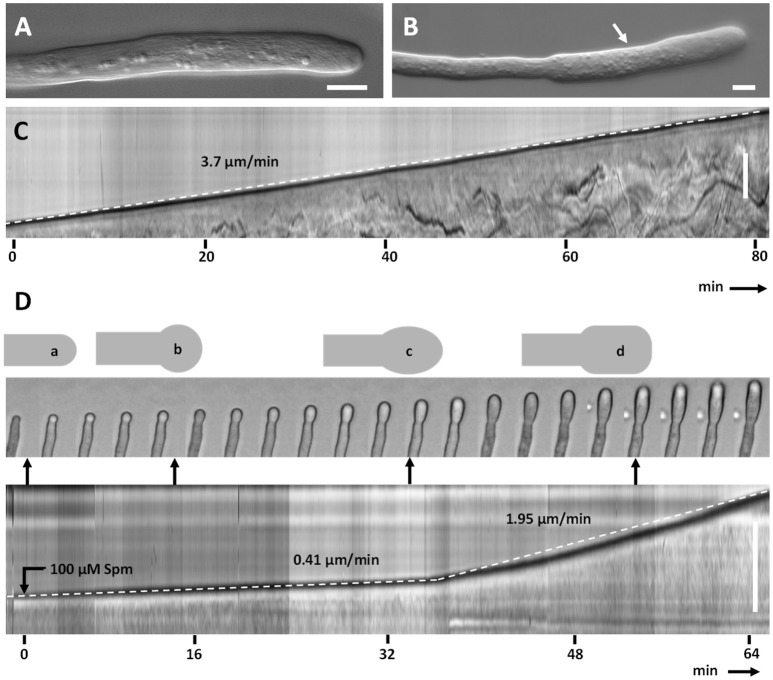
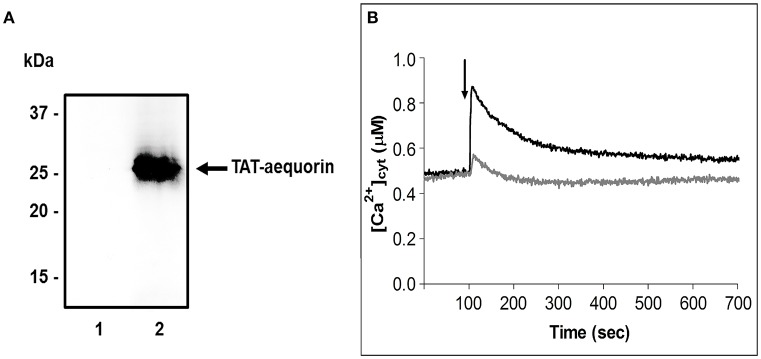
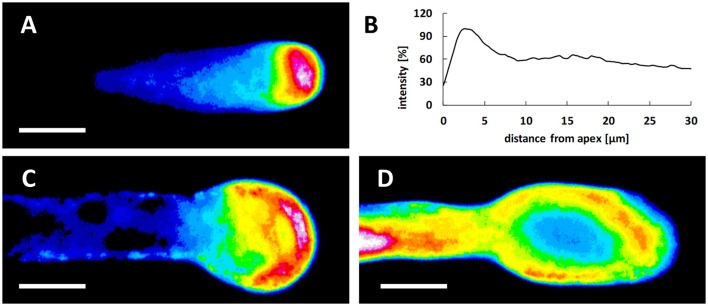
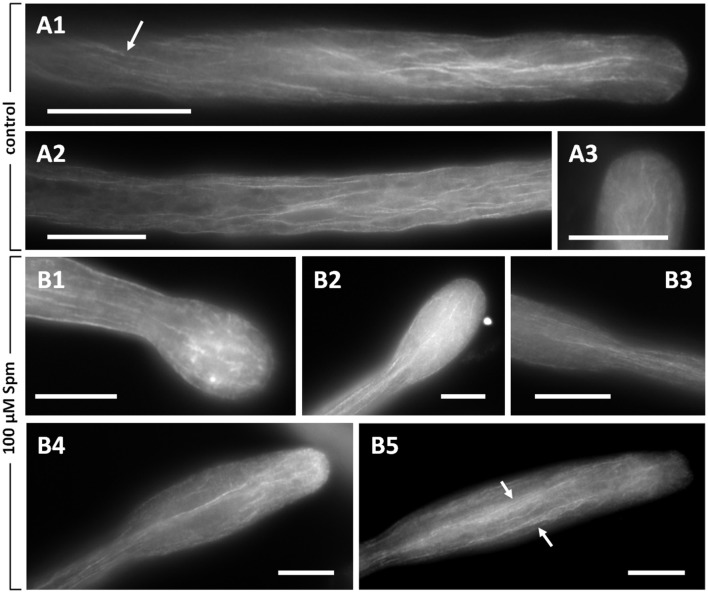
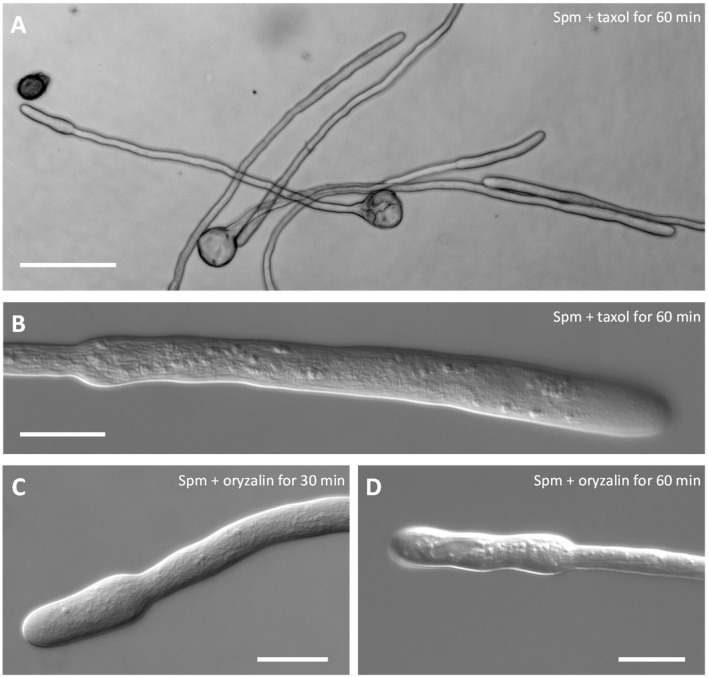
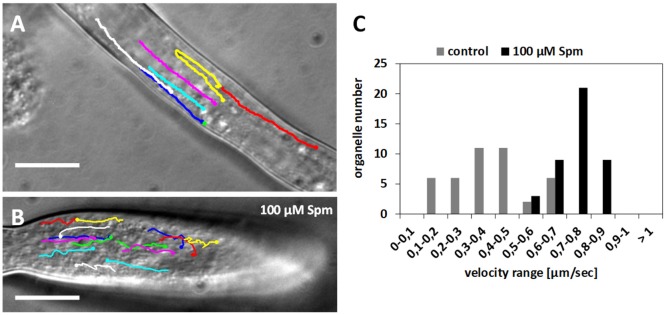
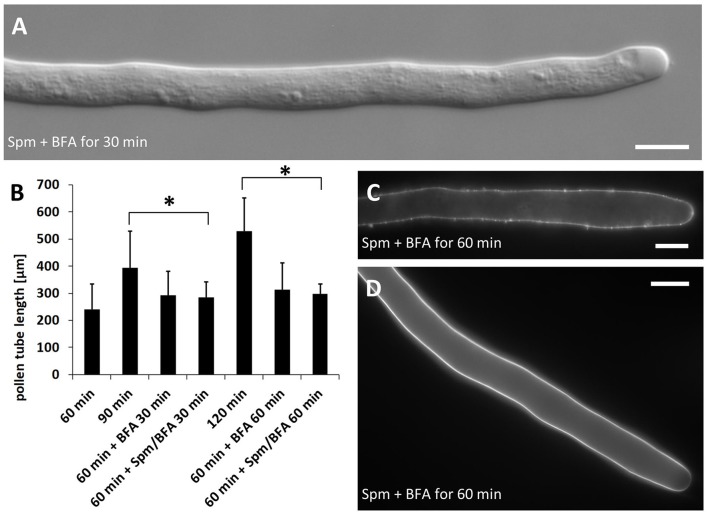
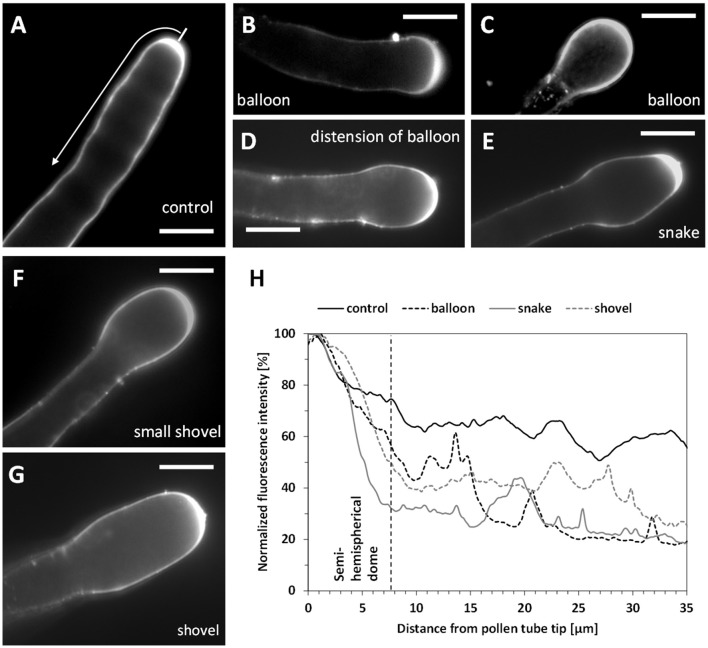
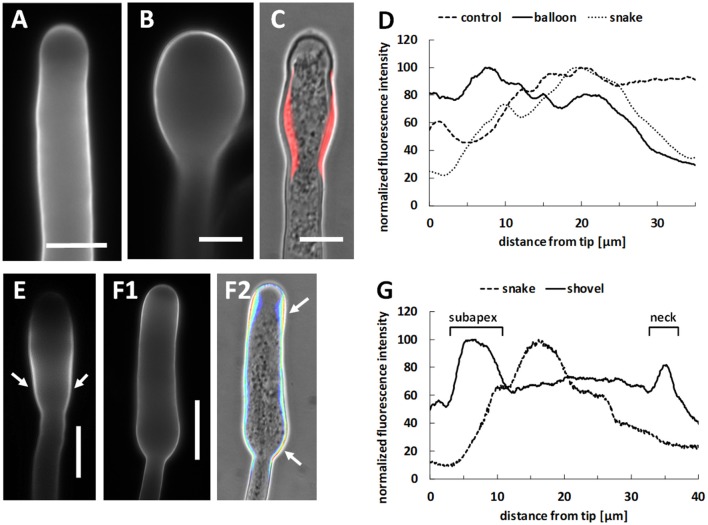
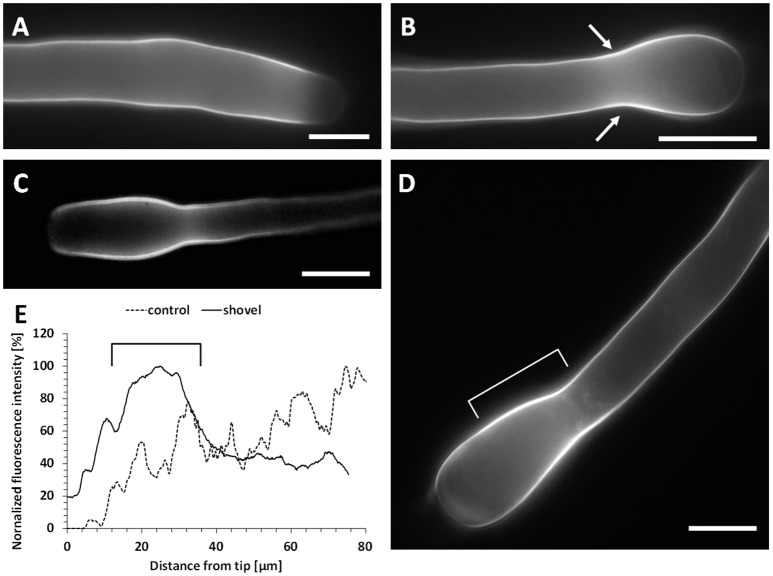
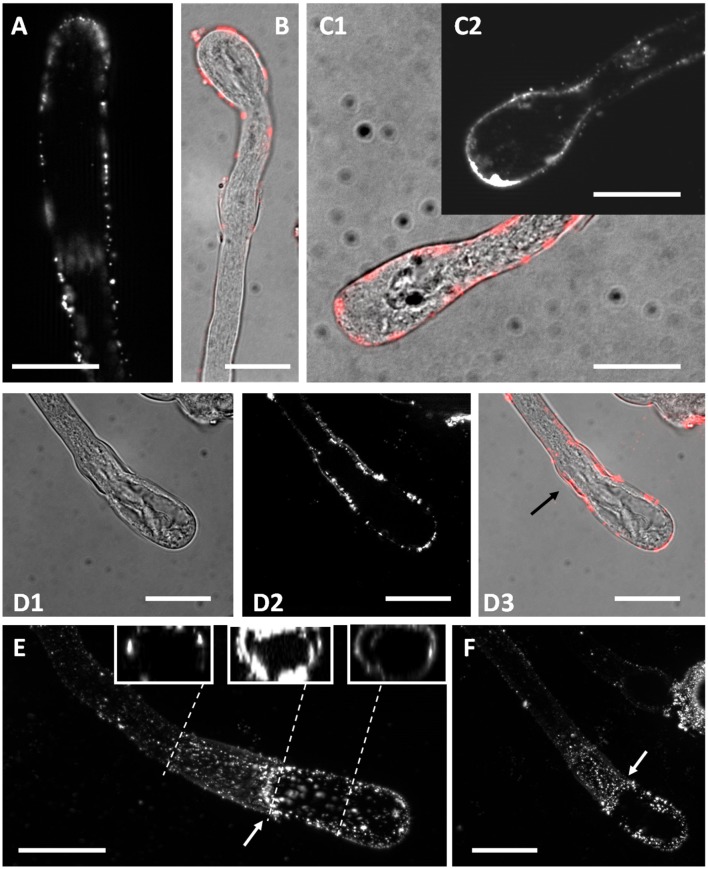
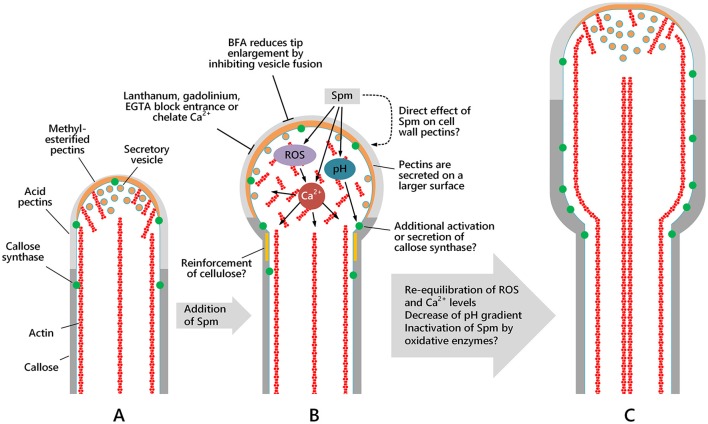
Proper growth of the pollen tube depends on an elaborate mechanism that integrates several molecular and cytological sub-processes and ensures a cell shape adapted to the transport of gametes. This growth mechanism is controlled by several molecules among which cytoplasmic and apoplastic polyamines. Spermine (Spm) has been correlated with various physiological processes in pollen, including structuring of the cell wall and modulation of protein (mainly cytoskeletal) assembly. In this work, the effects of Spm on the growth of pear pollen tubes were analyzed. When exogenous Spm (100 μM) was supplied to germinating pollen, it temporarily blocked tube growth, followed by the induction of apical swelling. This reshaping of the pollen tube was maintained also after growth recovery, leading to a 30-40% increase of tube diameter. Apical swelling was also accompanied by a transient increase in cytosolic calcium concentration and alteration of pH values, which were the likely cause for major reorganization of actin filaments and cytoplasmic organelle movement. Morphological alterations of the apical and subapical region also involved changes in the deposition of pectin, cellulose, and callose in the cell wall. Thus, results point to the involvement of Spm in cell wall construction as well as cytoskeleton organization during pear pollen tube growth.

Keywords: actin dynamics; callose; cell wall; cellulose; cytosolic calcium; pectins; pollen; spermine.


Figures

Figure 1
Figure 1
Time scale of the various morphological stages of pear pollen tubes after treatment with Spm and of the main analyses performed.
Figure 2
Figure 2
Kymograph analysis of pear pollen tubes after Spm treatment. (A) DIC view of a control pollen tube. (B) A typical enlarged pollen tube after Spm treatment. Bars: 20 μm. (C) Control pollen tube analyzed by kymograph. The dotted line indicates the linearity of growth. The X-axis is the time in minutes, while the Y-axis is the distance covered by the tube tip (scale bar for Y-axis is 100 μm). (D) (top part) Video frames showing the effects induced by Spm on a pollen tube. Cartoons indicate the main morphological stages that characterize pollen tubes after Spm treatment; (a) no Spm; (b) balloon shape; (c) snake shape; (d) shovel shape (bottom part). Kymograph analysis of a Spm-treated pollen tube. Spm was added at time zero. Scale bar for Y-axis is 500 μm. Small black arrows connecting the kymograph with video frames indicate approximately the time characterized by the four pollen tube shapes. Data are representative of six independent experiments.
Figure 3
Figure 3
Spm affects cytosolic Ca2+ concentration in germinating pear pollen. (A) Immunoblot analysis assessing the delivery of TAT-fused aequorin into germinating pollen. Samples were incubated in the absence (1) or presence (2) of TAT-aequorin (30 μM) for 10 min. Total protein extracts (30 μg) were separated by 12.5% SDS-PAGE, transferred onto PVDF and incubated with an anti-polyHis antibody. (B) Monitoring of cytosolic Ca2+ dynamics in germinating pollen by using TAT-aequorin. Cytosolic free Ca2+ concentration ([Ca2+]cyt) was measured after 10 min incubation of germinating pollen with TAT-aequorin and subsequent challenge (arrow, 100 s) with either the germination medium (gray trace) or 100 μM Spm (black trace). Ca2+ traces are representative of three independent experiments that gave very similar results.
Figure 4
Figure 4
Treatment with Spm dramatically modifies the pH gradient at the pear pollen tube apex. (A) In controls, pollen tubes have a tip-oriented pH gradient with an acidic region located at the tube apex. The pH acid region disappears shortly after 5–10 μm from the apex and only a weak background signal can be observed. (B) The data is confirmed by the relative measurement of the fluorescence intensity that is representative of three independent experiments. (C) At the balloon stage of Spm-treated pollen tubes, the pH gradient changes and the highest H+ concentration is redistributed throughout the surface of the swelling apex. (D) At the shovel stage, H+ concentration is approximately homogeneous throughout the new enlarged pollen tube. No H+ accumulation was observed at the apex of the new pollen tube. Bar = 10 μm.
Figure 5
Figure 5
Distribution of actin filaments in pear pollen tubes. (A1,A2) Control pollen tubes. The arrow indicates a longitudinal helicoidally-arranged actin filament. (A3) Detail of a control pollen tube apex. (B1–B5) Pollen tubes treated with Spm. (B1) A balloon-shaped pollen tube showing completely disorganized actin filaments in the apex. (B2) Reorganization of actin filaments at the snake-shaped stage. (B3) When the pollen tube re-starts to grow, actin filaments run along the cortical region and open like a fan at the neck level. (B4,B5) Actin filaments can be observed as the new shovel-shaped pollen tube resumes growth. Arrows indicate some actin bundles that run longitudinally along the middle and the cortex of pollen tubes. Bars = 10 μm. Data are representative of three independent experiments.
Figure 6
Figure 6
Co-treatment of pear pollen tubes with Spm and microtubule inhibitors. (A) DIC view of pollen tubes after co-treatment with Spm and taxol. (B) Detail of a single pollen tube after Spm+taxol treatment (DIC view). (C,D) DIC views of pollen tubes after co-treatment with Spm and oryzalin. Neither inhibitor affected the formation of the shovel shape. Images were captured after the incubation time indicated in each picture. Both analyses were performed at least until 1 h after supplementation of Spm and drugs. Bar in (A) 100 μm; bars in (B–D) 20 μm.
Figure 7
Figure 7
Velocity distribution of organelles in control and Spm-treated pear pollen tubes. (A) Control pollen tube with lines indicating the pathway of some monitored organelles. (B) Pathway of some organelles in a Spm-treated pollen tube. Bars: 10 μm. (C) Velocity distribution of representative organelles in control and Spm-treated pollen tubes. The Y-axis indicates the number of organelles while the X-axis indicates the velocity (in μm sec−1).
Figure 8
Figure 8
Effects of treatment with Brefeldin A (BFA) and Spm on pear pollen tube length and cell wall components. (A) A DIC view of 30 min-treated pollen tubes showing no defects in tube morphology. (B) Growth rates of control pollen tubes and of either BFA- or Spm+BFA-treated pollen tubes. The 60-min stage (first bar on the left) represents pollen tube growth before addition of chemicals. Pollen tubes were supplemented with BFA or Spm+BFA for an extra 30–60 min or they were grown under control conditions. The asterisk indicates that the measurements within square brackets are significantly different; in particular, data of treated pollen tubes are always significantly different compared to controls immediately to the left. Statistical analysis was performed using one-way ANOVA. (C) Labeling of pectins by PI. Pectins appear uniformly distributed. (D) Staining of callose by aniline blue. Callose is distributed as in controls and is absent in the very tip region. Bars: 10 μm.
Figure 9
Figure 9
Pectin distribution in control and Spm-treated pear pollen tubes. (A) Distribution of PI-stained cell wall polysaccharides in control pollen tubes. Arrow indicates the surface analyzed for PI fluorescence intensity. (B,C) Balloon stage. (D) A pollen tube resuming growth and switching from the balloon to the snake stage. (E) A typical example of a snake-shaped pollen tube. (F–G) Initial stage of shovel formation and a mature shovel-shaped pollen tube, in which PI-labeled pectins accumulate again in the tip. Bars for all pictures: 10 μm. (H) Relative quantitation of PI fluorescence intensity in pollen tubes treated with Spm. The intensity profile is reported as relative fluorescence intensity starting from the tip. The analyzed half curvature of the pollen tube apex is called a “semi-hemispherical dome.” Graphs are calculated for the main steps of Spm treatment as indicated by the graph legend. Data are representative of three independent experiments.
Figure 10
Figure 10
Distribution of cellulose in Spm-treated pollen tubes. (A) Pattern of cellulose in control pollen tubes. (B) Cellulose distribution at the onset of Spm treatment (balloon stage). (C) Distribution of cellulose at the snake stage; in this case, fluorescence of cellulose was thresholded to evince the sites of major accumulation and superimposed to the DIC view of the same pollen tube in order to emphasize the sites of cellulose accumulation. (D) Graph of relative fluorescence intensity at the balloon/snake transition (compared to control) starting from the tip. Data are representative of three independent experiments (E) Image of a pollen tube at the snake stage showing accumulation of cellulose in the neck and in enlarged regions (arrows). (E,F1,F2) Representative image of a pollen tube at the shovel stage. Cellulose accumulates all along the pollen tube but more prominently in the subapex and in the neck regions (arrows) as shown by pseudocolored fluorescence signal merged with the DIC view. Bars in (A–C) 10 μm. Bar in (E,F1,F2) 20 μm. (G) Graph reporting the relative fluorescence intensity in pollen tubes at the shovel stage starting from the tip. The so-called “enlargement zone” represents the point where the diameter of that specific pollen tube increases. Data are representative of three independent experiments
Figure 11
Figure 11
Distribution of callose in Spm-treated pear pollen tubes. (A) A control pollen tube showing absence of callose in the tip. (B) In balloon-shaped pollen tubes, callose accumulates in the neck region (arrows). (C) In snake-shaped pollen tubes, callose still accumulates in the neck region and it is still absent from the tip. (D) In shovel-shaped pollen tubes, callose showed a consistent accumulation around 20–30 μm, as also shown by the relative fluorescence intensity (E). The square bracket in (D) corresponds to the region indicated by the square bracket in the graph of (E). Bars: 10 μm. Data are representative of three independent experiments.
Figure 12
Figure 12
Distribution of callose synthase in control and Spm-treated pear pollen tubes. (A) Callose synthase is present as dots or patches along the entire border of control pollen tubes. (B) At the balloon-like step, callose synthase accumulates in the spherical domain. This image is a merge of phase contrast and immunofluorescence (red) pictures of the same pollen tube. (C1,C2) Accumulation of callose synthase in the apical domain is more evident at the transition between the balloon-like and the shovel-like step. The image in (C1) is a merge of immunolocalized callose synthase (red) with phase contrast view of the same pollen tube. The image in (C2) is an immunofluorescence view of another pollen tube. (D1–D3) Accumulation of callose synthase in the neck (arrow) becomes evident when pollen tubes develop into the snake shape and start assuming the shovel shape. (E–F) Two additional views of Spm-treated pollen tubes showing a consistent accumulation of callose synthase in the neck region (arrows), with an annulus-like configuration. Bars = 10 μm. The insets in Figure 11E show three reconstructions from a Z-series stack demonstrating that the annulus does not have uniform fluorescence intensity. Data are representative of three independent experiments.
Figure 13
Figure 13
Schematic drawing showing the morphology of the apical region and the spatial distribution of actin filaments, secretory vesicles and cell wall components in pollen tubes and how Spm perturbs either their distribution or the morphology of the apical region. The pollen tube sub-apex is characterized by the actin fringe while in the shank region actin filaments form regular and longitudinal cables, which are essential for organelle and vesicle movement. Spm profoundly alters Ca2+, H+, and ROS concentrations and distribution, thereby affecting not only microfilament organization but also vesicle delivery. As a final result, assembly of the cell wall and shaping of the growing pollen tube tip is altered. (A) Pollen tube after 1 h of germination; (B) pollen tube after 1 h of germination in standard medium, then supplied with Spm for one additional hour; (C) pollen tube grown for 1 h in standard medium and then supplemented with Spm for two additional hours. As yet unknown mechanisms re-equilibrate ion distribution and concentration and allow the pollen tube to resume growth even though tube diameter remains larger and growth rate slower. Inactivation of Spm by oxidative enzymes cannot be excluded.

References

    1. Abercrombie J. M., O'meara B. C., Moffatt A. R., Williams J. H. (2011). Developmental evolution of flowering plant pollen tube cell walls: callose synthase (CalS) gene expression patterns. Evodevo 2:14. 10.1186/2041-9139-2-14 - DOI - PMC - PubMed
    1. Alburquerque N., Burgos L., Sedgley M., Egea J. (2004). Contributing to the knowledge of the fertilization process in four apricot cultivars. Sci. Hortic. 102, 387–396. 10.1016/j.scienta.2004.02.003 - DOI
    1. Alburquerque N., Egea J., Burgos L., Martínez-Romero D., Valero D., Serrano M. (2006). The influence of polyamines on apricot ovary development and fruit set. Ann. Appl. Biol. 149, 27–33. 10.1111/j.1744-7348.2006.00067.x - DOI
    1. Ali O., Traas J. (2016). Force-driven polymerization and turgor-induced wall expansion. Trends Plant Sci. 21, 398–409. 10.1016/j.tplants.2016.01.019 - DOI - PubMed
    1. Aloisi I., Cai G., Serafini-Fracassini D., Del Duca S. (2016). Polyamines in pollen: from microsporogenesis to fertilization. Front. Plant Sci. 7:155. 10.3389/fpls.2016.00155 - DOI - PMC - PubMed

LinkOut - more resources