

EEG source connectivity to localize the seizure onset zone in patients with drug resistant epilepsy
- PMID: 29034162
- PMCID: PMC5633847
- DOI: 10.1016/j.nicl.2017.09.011
EEG source connectivity to localize the seizure onset zone in patients with drug resistant epilepsy
Abstract
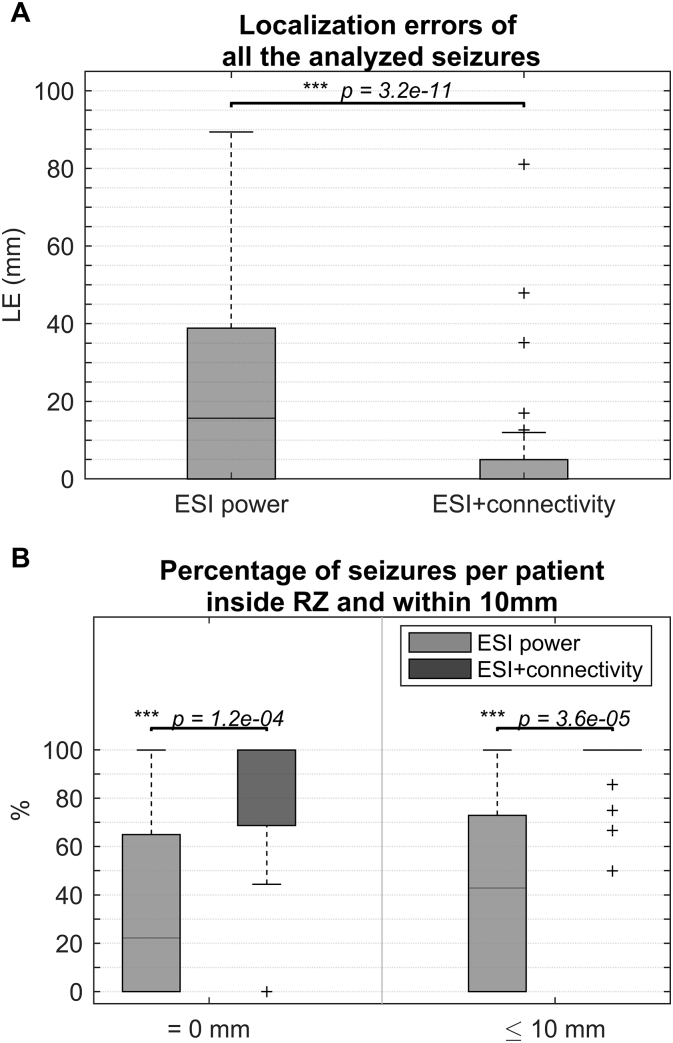
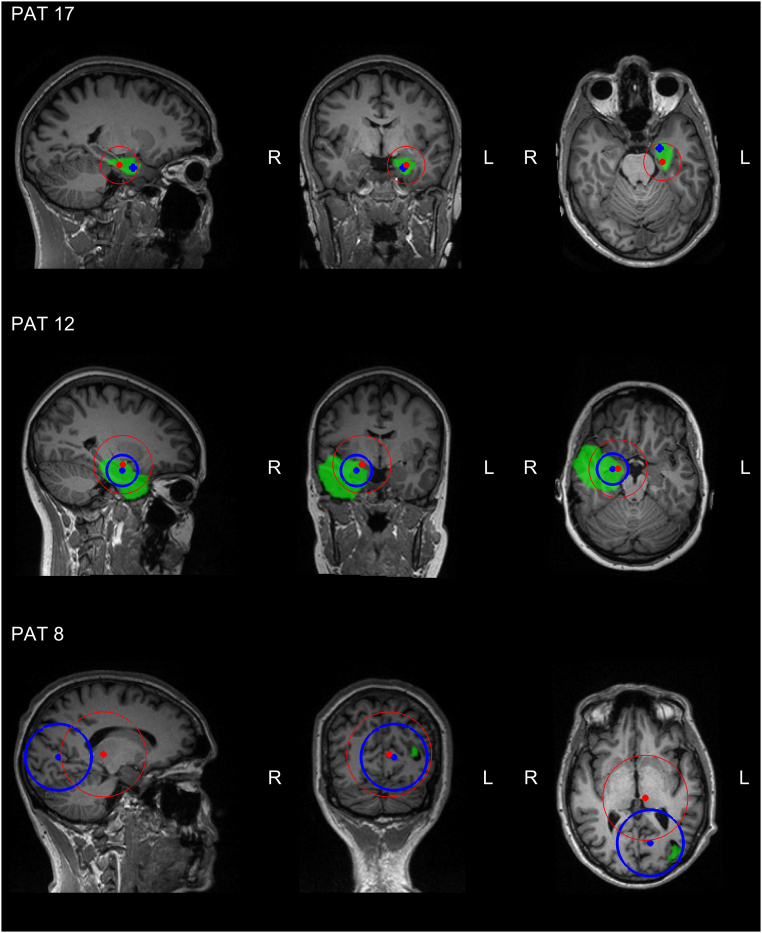
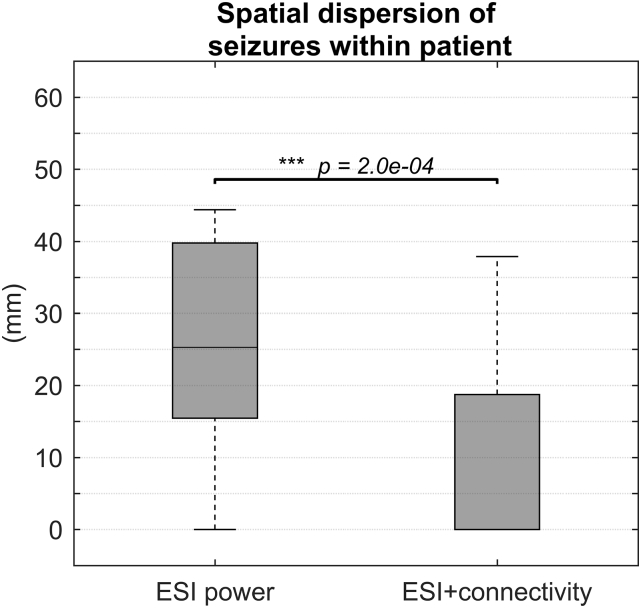
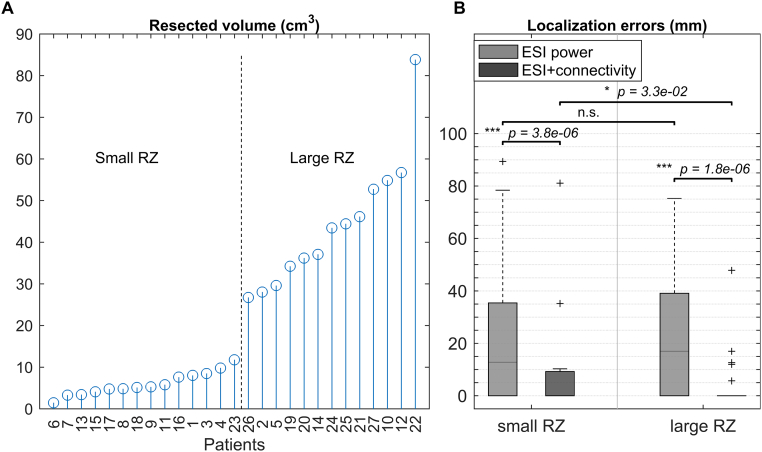
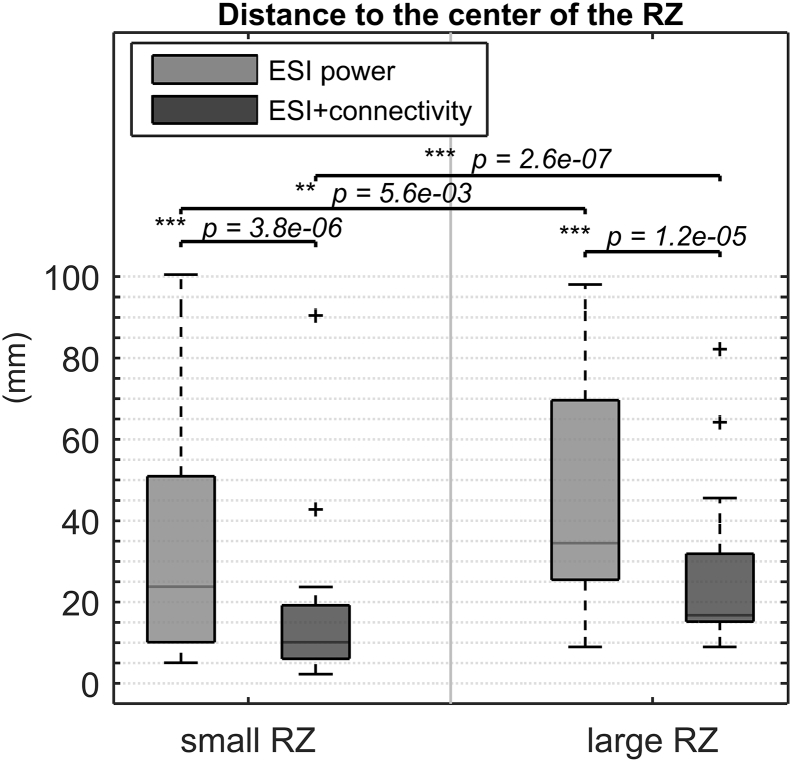
Electrical source imaging (ESI) from interictal scalp EEG is increasingly validated and used as a valuable tool in the presurgical evaluation of epilepsy as a reflection of the irritative zone. ESI of ictal scalp EEG to localize the seizure onset zone (SOZ) remains challenging. We investigated the value of an approach for ictal imaging using ESI and functional connectivity analysis (FC). Ictal scalp EEG from 111 seizures in 27 patients who had Engel class I outcome at least 1 year following resective surgery was analyzed. For every seizure, an artifact-free epoch close to the seizure onset was selected and ESI using LORETA was applied. In addition, the reconstructed sources underwent FC using the spectrum-weighted Adaptive Directed Transfer Function. This resulted in the estimation of the SOZ in two ways: (i) the source with maximal power after ESI, (ii) the source with the strongest outgoing connections after combined ESI and FC. Next, we calculated the distance between the estimated SOZ and the border of the resected zone (RZ) for both approaches and called this the localization error ((i) LEpow and (ii) LEconn respectively). By comparing LEpow and LEconn, we assessed the added value of FC. The source with maximal power after ESI was inside the RZ (LEpow = 0 mm) in 31% of the seizures and estimated within 10 mm from the border of the RZ (LEpow ≤ 10 mm) in 42%. Using ESI and FC, these numbers increased to 72% for LEconn = 0 mm and 94% for LEconn ≤ 10 mm. FC provided a significant added value to ESI alone (p < 0.001). ESI combined with subsequent FC is able to localize the SOZ in a non-invasive way with high accuracy. Therefore it could be a valuable tool in the presurgical evaluation of epilepsy.
Keywords: Clinical EEG; EEG source imaging; Functional connectivity; Granger causality; Ictal imaging.
Figures
Similar articles
-
Ictal EEG source imaging and connectivity to localize the seizure onset zone in extratemporal lobe epilepsy.Seizure. 2020 May;78:18-30. doi: 10.1016/j.seizure.2020.03.001. Epub 2020 Mar 4. Seizure. 2020. PMID: 32151969
-
Seizure Onset Zone Localization from Ictal High-Density EEG in Refractory Focal Epilepsy.Brain Topogr. 2017 Mar;30(2):257-271. doi: 10.1007/s10548-016-0537-8. Epub 2016 Nov 16. Brain Topogr. 2017. PMID: 27853892
-
Source localization of the seizure onset zone from ictal EEG/MEG data.Hum Brain Mapp. 2016 Jul;37(7):2528-46. doi: 10.1002/hbm.23191. Epub 2016 Apr 5. Hum Brain Mapp. 2016. PMID: 27059157 Free PMC article.
-
From theory to practical fundamentals of electroencephalographic source imaging in localizing the epileptogenic zone.Epilepsia. 2022 Oct;63(10):2476-2490. doi: 10.1111/epi.17361. Epub 2022 Jul 27. Epilepsia. 2022. PMID: 35811476 Free PMC article. Review.
-
Ictal EEG source localization in focal epilepsy: Review and future perspectives.Clin Neurophysiol. 2020 Nov;131(11):2600-2616. doi: 10.1016/j.clinph.2020.08.001. Epub 2020 Aug 15. Clin Neurophysiol. 2020. PMID: 32927216 Review.
Cited by
-
Dynamical Network Models From EEG and MEG for Epilepsy Surgery-A Quantitative Approach.Front Neurol. 2022 Mar 29;13:837893. doi: 10.3389/fneur.2022.837893. eCollection 2022. Front Neurol. 2022. PMID: 35422755 Free PMC article. Review.
-
Electroencephalography derived connectivity informing epilepsy surgical planning: Towards clinical applications and future perspectives.Neuroimage Clin. 2024;44:103703. doi: 10.1016/j.nicl.2024.103703. Epub 2024 Nov 10. Neuroimage Clin. 2024. PMID: 39546895 Free PMC article. Review.
-
Low-density scalp electrical source imaging of the ictal onset zone network using source coherence maps.Front Neurol. 2024 Dec 19;15:1483977. doi: 10.3389/fneur.2024.1483977. eCollection 2024. Front Neurol. 2024. PMID: 39748857 Free PMC article.
-
Quantitative EEG signatures in patients with and without epilepsy development after a first seizure.Epilepsia Open. 2025 Apr;10(2):427-440. doi: 10.1002/epi4.13128. Epub 2025 Mar 4. Epilepsia Open. 2025. PMID: 40040314 Free PMC article.
-
Quantitative electroencephalogram analysis of frontal cortex functional changes in patients with migraine.Kaohsiung J Med Sci. 2020 Jul;36(7):543-551. doi: 10.1002/kjm2.12213. Epub 2020 Apr 7. Kaohsiung J Med Sci. 2020. PMID: 32259398 Free PMC article.
References
-
- Arnold M., Milner X.H.R., Witte H., Bauer R., Braun C. Adaptive AR modeling of nonstationary time series by means of Kalman filtering. IEEE Trans. Biomed. Eng. 1998;45:553–562. - PubMed
-
- Assaf B.A., Ebersole J.S. Continuous source imaging of scalp ictal rhythms in temporal lobe epilepsy. Epilepsia. 1997;38:1114–1123. - PubMed
-
- Astolfi L., Cincotti F., Mattia D., de Vico Fallani F., Tocci A., Colosimo A., Salinari S., Marciani M.G., Hesse W., Witte H. Tracking the time-varying cortical connectivity patterns by adaptive multivariate estimators. IEEE Trans. Biomed. Eng. 2008;55:902–913. - PubMed
-
- Boon P., D'Havé M., Adam C., Vonck K., Baulac M., Vandekerckhove T., De Reuck J. Dipole modeling in epilepsy surgery candidates. Epilepsia. 1997;38:208–218. - PubMed
-
- Boon P., D'Havé M., Vanrumste B., Van Hoey G., Vonck K., Van Walleghem P., Caemaert J., Achten E., De Reuck J. Ictal source localization in presurgical patients with refractory epilepsy. J. Clin. Neurophysiol. 2002;19:461–468. - PubMed
MeSH terms
LinkOut - more resources
Full Text Sources
Other Literature Sources
Medical
Molecular Biology Databases
