. 2017 Sep 22:8:48-58.
doi: 10.1016/j.pacs.2017.09.001. eCollection 2017 Dec.

Quantitative comparison of PZT and CMUT probes for photoacoustic imaging: Experimental validation

Affiliations

Quantitative comparison of PZT and CMUT probes for photoacoustic imaging: Experimental validation

Maëva Vallet et al. Photoacoustics. .

Abstract

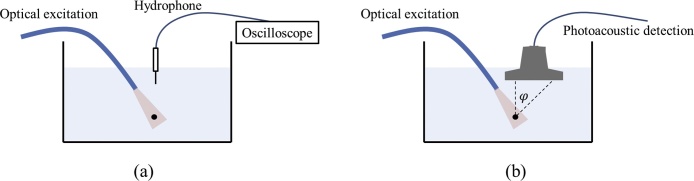
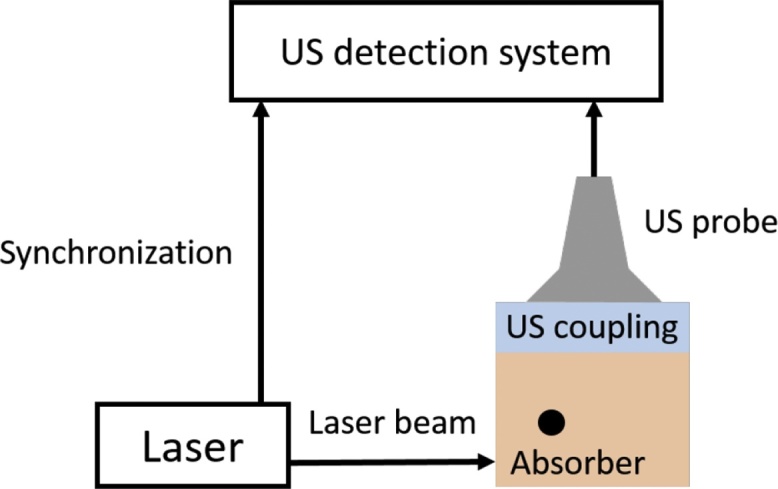
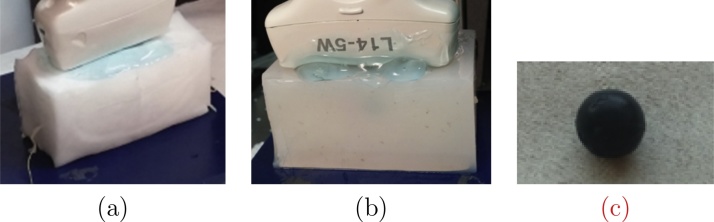
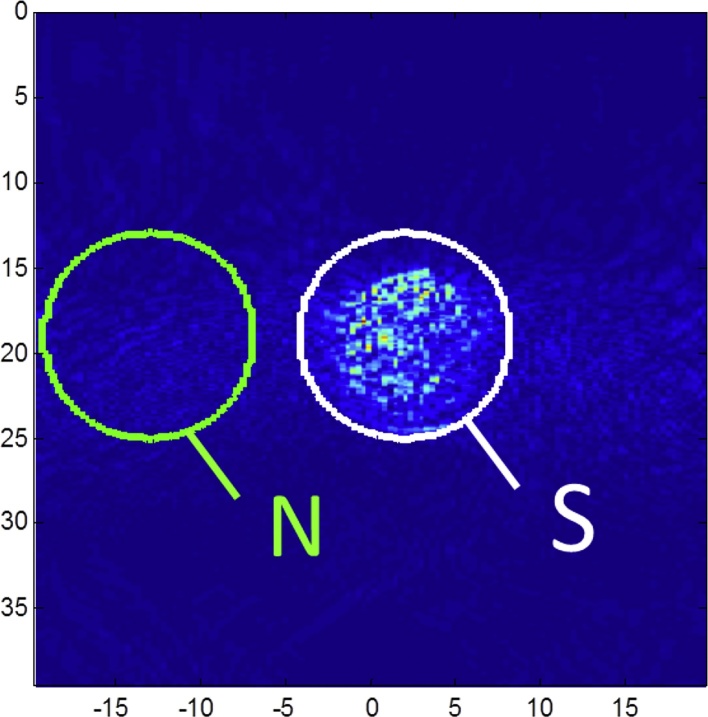
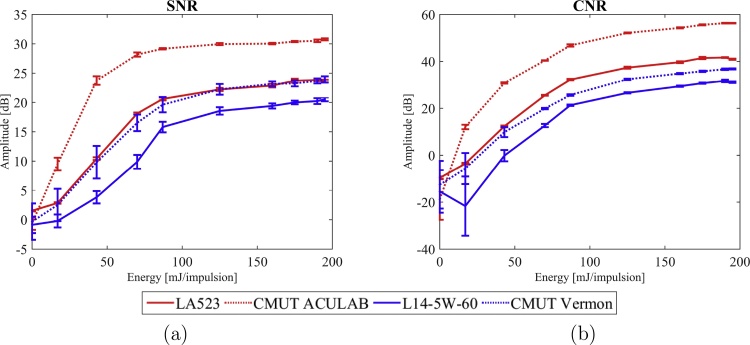
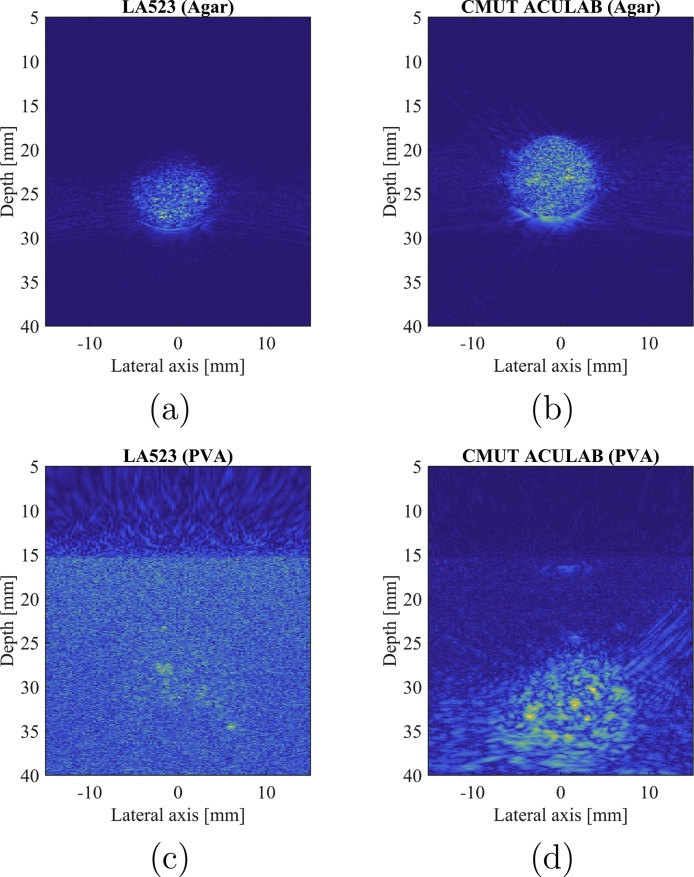
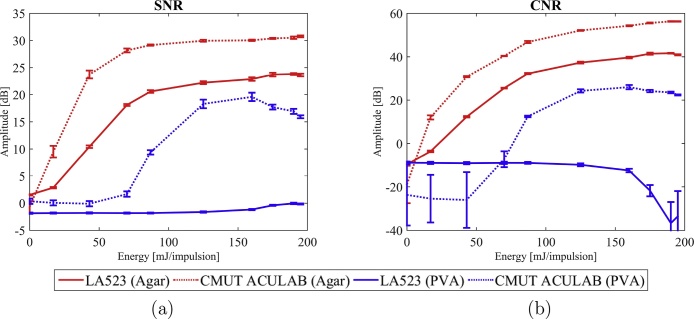
Photoacoustic (PA) signals are short ultrasound (US) pulses typically characterized by a single-cycle shape, often referred to as N-shape. The spectral content of such wideband signals ranges from a few hundred kilohertz to several tens of megahertz. Typical reception frequency responses of classical piezoelectric US imaging transducers, based on PZT technology, are not sufficiently broadband to fully preserve the entire information contained in PA signals, which are then filtered, thus limiting PA imaging performance. Capacitive micromachined ultrasonic transducers (CMUT) are rapidly emerging as a valid alternative to conventional PZT transducers in several medical ultrasound imaging applications. As compared to PZT transducers, CMUTs exhibit both higher sensitivity and significantly broader frequency response in reception, making their use attractive in PA imaging applications. This paper explores the advantages of the CMUT larger bandwidth in PA imaging by carrying out an experimental comparative study using various CMUT and PZT probes from different research laboratories and manufacturers. PA acquisitions are performed on a suture wire and on several home-made bimodal phantoms with both PZT and CMUT probes. Three criteria, based on the evaluation of pure receive impulse response, signal-to-noise ratio (SNR) and contrast-to-noise ratio (CNR) respectively, have been used for a quantitative comparison of imaging results. The measured fractional bandwidths of the CMUT arrays are larger compared to PZT probes. Moreover, both SNR and CNR are enhanced by at least 6 dB with CMUT technology. This work highlights the potential of CMUT technology for PA imaging through qualitative and quantitative parameters.

Keywords: CMUT; PZT; Photoacoustic; Ultrasound imaging.


Figures

Fig. 1
Fig. 1
Experimental set-up for the pure receive impulse response of the US probes of the study. The computation is made in two steps: (a) receiving the signal on the hydrophone, (b) receiving the same signal on the US probes. The φ angle allows evaluating the acceptance angle of the various probes.
Fig. 2
Fig. 2
Experimental photoacoustic set-up. An optical pulse illuminates the medium and the absorbers. A photoacoustic signal is generated and received by the US probe and post-processed by the scanner.
Fig. 3
Fig. 3
Pictures of the bimodal phantoms used for this study (a) PVA blocks (10% – 5 cycles) and (b) agar. Each one contains an inclusion of the same material (c) coloured with India ink (concentration of 0.03%).
Fig. 4
Fig. 4
Example of noise (N) and signal (S) ROI.
Fig. 5
Fig. 5
Calibration curve of the SonixMDP and ULA-OP system using the same probes.
Fig. 6
Fig. 6
Pure reception frequency response of the four probes. For each probe, the −6 dB central frequency and bandwidth are reported.
Fig. 7
Fig. 7
Spectral sensitivity of the four probes measured as a function of the incident angle.
Fig. 8
Fig. 8
PA images of the spherical inclusion made of coloured agar obtained with both probes of the two following pairs at 195 mJ/pulse: (a) L14-5W/60 (PZT) and (b) CMUT Vermon, and (c) LA523E (PZT) and (d) CMUT ACULAB.
Fig. 9
Fig. 9
Evolutions of the SNR and CNR as a function of the excitation energy for both probes types of each pair in the agar phantom (study 1 and 2, Table 2).
Fig. 10
Fig. 10
PA images of the spherical inclusion made of coloured (a, b) Agar and (c, d) PVA obtained with both probes of the same pair at 195 mJ/pulse: (a, c) LA523E (PZT) and (b, d) CMUT ACULAB.
Fig. 11
Fig. 11
Evolutions of the SNR and CNR as a function of the excitation energy for the PZT and CMUT probes of the same pair on both the agar and the PVA phantoms (study 2 and 3, Table 2).

References

    1. Su J.L., Wang B., Wilson K.E., Bayer C.L., Chen Y.-S., Kim S., Homan K.A., Emelianov S.Y. Advances in clinical and biomedical applications of photoacoustic imaging. Expert Opin. Med. Diagn. 2010;4(6):497–510. - PMC - PubMed
    1. Bauer D.R., Olafsson R., Montilla L.G., Witte R.S. 3-d photoacoustic and pulse echo imaging of prostate tumor progression in the mouse window chamber. J. Biomed. Opt. 2011;16(2):026012. - PMC - PubMed
    1. Bell A.G. Upon the production and reproduction of sound by light. J. Soci. Telegr. Eng. 1880;9(34):404–426.
    1. Li C., Wang L. Photoacoustic tomography and sensing in biomedicine. Phys. Med. Biol. 2009;54(19):59–97. - PMC - PubMed
    1. Deán-Ben X.L., Razansky D. Functional optoacoustic human angiography with handheld video rate three dimensional scanner. Photoacoustics. 2013;1(3–4):68–73. - PMC - PubMed