. 2017 Sep 29:7:231.
doi: 10.3389/fonc.2017.00231. eCollection 2017.

Bridge-Induced Translocation between NUP145 and TOP2 Yeast Genes Models the Genetic Fusion between the Human Orthologs Associated With Acute Myeloid Leukemia

Affiliations

Bridge-Induced Translocation between NUP145 and TOP2 Yeast Genes Models the Genetic Fusion between the Human Orthologs Associated With Acute Myeloid Leukemia

Valentina Tosato et al. Front Oncol. .

Abstract

In mammalian organisms liquid tumors such as acute myeloid leukemia (AML) are related to spontaneous chromosomal translocations ensuing in gene fusions. We previously developed a system named bridge-induced translocation (BIT) that allows linking together two different chromosomes exploiting the strong endogenous homologous recombination system of the yeast Saccharomyces cerevisiae. The BIT system generates a heterogeneous population of cells with different aneuploidies and severe aberrant phenotypes reminiscent of a cancerogenic transformation. In this work, thanks to a complex pop-out methodology of the marker used for the selection of translocants, we succeeded by BIT technology to precisely reproduce in yeast the peculiar chromosome translocation that has been associated with AML, characterized by the fusion between the human genes NUP98 and TOP2B. To shed light on the origin of the DNA fragility within NUP98, an extensive analysis of the curvature, bending, thermostability, and B-Z transition aptitude of the breakpoint region of NUP98 and of its yeast ortholog NUP145 has been performed. On this basis, a DNA cassette carrying homologous tails to the two genes was amplified by PCR and allowed the targeted fusion between NUP145 and TOP2, leading to reproduce the chimeric transcript in a diploid strain of S. cerevisiae. The resulting translocated yeast obtained through BIT appears characterized by abnormal spherical bodies of nearly 500 nm of diameter, absence of external membrane and defined cytoplasmic localization. Since Nup98 is a well-known regulator of the post-transcriptional modification of P53 target genes, and P53 mutations are occasionally reported in AML, this translocant yeast strain can be used as a model to test the constitutive expression of human P53. Although the abnormal phenotype of the translocant yeast was never rescued by its expression, an exogenous P53 was recognized to confer increased vitality to the translocants, in spite of its usual and well-documented toxicity to wild-type yeast strains. These results obtained in yeast could provide new grounds for the interpretation of past observations made in leukemic patients indicating a possible involvement of P53 in cell transformation toward AML.

Keywords: P53; acute myeloid leukemia; bridge-induced translocation; gene fusion; nucleoporin; yeast.


Figures

Figure 1
Figure 1
Identification of the virtual breakpoints within the yeast proteins Nup145 and Top2 through an alignment with the human orthologs. (A) Breakpoints within the yeast proteins and their homology in percentages with the human orthologs (line below each protein) are shown. In the windows, a partial sequence alignment between yeast (S.c.) and human (H.s.) proteins and the relative consensus are presented. The parts of the proteins that are going to be fused together resulting in chimeras are outlined in yellow. aa, amino acids. (B) The fusion points in yeast (top panel) and in human (bottom panel) are represented by the Seq2Logo server. Large symbols represent frequently observed amino acids, big stack represents conserved positions and small stack represents variable positions. The Y-axis describes the amount of information in bits. The X-axis shows the position in the alignment.
Figure 2
Figure 2
Scheme of the procedure to obtain a perfect fusion between NUP145 and TOP2. The first step is represented by the bridge-induced translocation between NUP145 (Chromosome VII, shown in red) and TOP2 (Chromosome XIV, shown in blue) triggered by a BIT cassette. The URA3 gene from Kluyveromyces lactis (KlURA) was used as selection marker between the two homologous ends. Its POP-OUT, indicated by sequential arrows, was verified by selection on 5-FOA plates. The original chromatogram of one clone showing the perfect fusion between the two genes and the relative amplified chimeric transcript from one translocant (T) are also reported. Since the primers used in the RTPCR (sequence in Table S1 in Supplementary Material) are 418 and 241 bp far from the junction point, respectively, the size of the amplicon shown here is exactly 659 bp (lane 2 of the gel); lane 1:1 kb Plus ladder (Invitrogen).
Figure 3
Figure 3
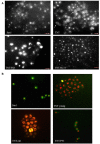
Fluorescent microscopy of aged (3 weeks old) NUP-TOP translocants. The spherical bodies, whose number increased with aging, can be visualized also without fluorescence using different focus lengths (the first two pictures of each panel), but they become more evident after staining with DAPI (A) and Pyronin Y (B). After 4 weeks, all the cells of all the TNTs translocant strains contain a variable number of SBs. Cell aging is testified by the numerous scars on the cell wall that are visible after calcofluor treatment (C).
Figure 4
Figure 4
Trasmission electron microscopy (TEM) of aged (4 weeks old) translocants compared to the wild type (WT) strain: (A) WT San1, (B) TNT10, (C) TNT 10/P53, and (D) TNT 10/H273. N, nucleus; SB, spherical body; CW, cell wall; CM, cell membrane; M, mitochondria; ER, endoplasmic reticulum.
Figure 5
Figure 5
Bend.it analysis. The upper panel refers to the analysis of the genomic DNA around the breakpoint (in the figure at 1,982 bp) within NUP98. The panel in the middle refers to the analysis of the breakpoint (in the figure at 982 bp) within NUP145. (A–C) (NUP98) and (D–F) (NUP145) show the bendability, the GC content and the complexity of the genomic region against the curvature, respectively. The bottom panel refers to the comparison between the cDNA complexity of the junctions NUP145-TOP2 (G) and NUP98-TOP2B (H). The breakpoints in the graphics are at 883 bp (G) and 1,666 bp (H). In all the panels, the Y-axis is reported as degrees/10.5 bp helical turn. Dashed lines indicate the breakpoints while the peculiar regions discussed in the text are outlined in yellow.
Figure 6
Figure 6
Bioinformatic analysis of the physicochemical and conformational properties of the sequences around the breakpoints of NUP98 (red color) and NUP145 loci (blue color). The three green lines in each graphic correspond to an average, maximum and minimum value of five control sequences (see Materials and Methods for details). (A) B to A transition, (B) B to Z transition, (C) Helical repeats, (D) Persistence length, (E) Thermodynamic stability, (F) thermally induced duplex destabilization (TIDD). The X-axis is labeled with numbers representing the nucleotide sequence; the Y-axis is labeled, in the different panels, with kiloJoule per mole (kJ/mol), nanometers (nm), kilocalories per mole (kcal/mol), base pairs per helical turn (bp/turn).
Figure 7
Figure 7
Fluorescent microscopy of (A) endocytosis (B) and cell viability. In (A), lucifer yellow (LY) was used to test endocytosis in the wild type (WT) San1, in TNT cells, in TNTs transformed with P53 (TNT/P53) and with P53 mutated in H273 (TNT/H273). LY gives a high background staining of the cell wall of the translocants with a defective accumulation of the fluorescent molecule in the vacuole. The white arrows indicate cells with almost complete loss of endocytosis (roughly 10% of the cells). P53 restores a good level of endocytosis in the translocants. In (B), the FUN-1 staining reveals comparable viability of both San1 and the TNT cells transformed with P53. The TNT cells without P53 appeared already suffering when young cultures (2 days old) and very sick when old cultures (3 weeks old). The dead cells are stained in yellow. After 4 weeks, 5% of the cells appeared dead (yellow) and all them appeared as very sick (orange color).
Figure 8
Figure 8
(A) Growth curves of translocants number 6 (TNT6) and 10 (TNT10) and of the wild type (WT) San1. The curves without P53 (blue), with P53 (red), and with the P53 mutant H273 (green) are shown for San1 (left), TNT6 (center), and TNT 10 (right panel). On the X-axis, the growth time (in hours), and on the Y-axis the cell number (107/ml) are reported. Each aliquot was retrieved every 2 h and cell density determined by counting each aliquot three times on a Neubauer Improved Cell counting chamber. Error bars are reported accordingly. (B) Relative gene expression (RGE) of six genes (ATG17, RTF1, BOI1, SIR2, PRK1, CDC28) measured in TNT6 with P53. As reference, TNT6 transformed with an empty PJL49 plasmid was used (see Materials and Methods for details on the comparative method). CDC28 increases 1.79-folds. (C) RGE of CDC28 in San1 transformed with P53. The increase of CDC28 is 1.8-folds respect to San1 transformed with an empty plasmid. The bars represent the average of three independent readings (bar errors are reported and calculated as standard error). (D) The expression of the mutant P53/H273 was normalized respect to the WT form of P53 taken as 1 in the WT strain San1 and in two different translocants (TNT6 and TNT10). RGE was calculated using ACT1 as reference gene and following the procedure described in Section “Materials and Methods.” Error bars are reported accordingly.

Similar articles

Cited by

References

    1. Kabachinski G, Schwartz TU. The nuclear pore complex-structure and function at a glance. J Cell Sci (2015) 128:423–9.10.1242/jcs.083246 - DOI - PMC - PubMed
    1. Mossaid I, Fahrenkrog B. Complex commingling: nucleoporins and the spindle assembly checkpoint. Cells (2015) 4:706–25.10.3390/cells4040706 - DOI - PMC - PubMed
    1. Ptak C, Wozniak RW. Nucleoporins and chromatin metabolism. Curr Opin Cell Biol (2016) 40:153–60.10.1016/j.ceb.2016.03.024 - DOI - PubMed
    1. Takeda A, Yaseen NR. Nucleoporins and nucleocytoplasmic transport in hematologic malignancies. Semin Cancer Biol (2014) 27:3–10.10.1016/j.semcancer.2014.02.009 - DOI - PubMed
    1. Gough SM, Slape CI, Aplan PD. NUP98 gene fusions and hematopoietic malignancies: common themes and new biologic insights. Blood (2011) 118:6247–57.10.1182/blood-2011-07-328880 - DOI - PMC - PubMed