. 2017 Oct 6;4(5):ENEURO.0245-17.2017.
doi: 10.1523/ENEURO.0245-17.2017. eCollection 2017 Sep-Oct.

Emergence of β-Band Oscillations in the Aged Rat Amygdala during Discrimination Learning and Decision Making Tasks

Affiliations

Emergence of β-Band Oscillations in the Aged Rat Amygdala during Discrimination Learning and Decision Making Tasks

Rachel D Samson et al. eNeuro. .

Abstract

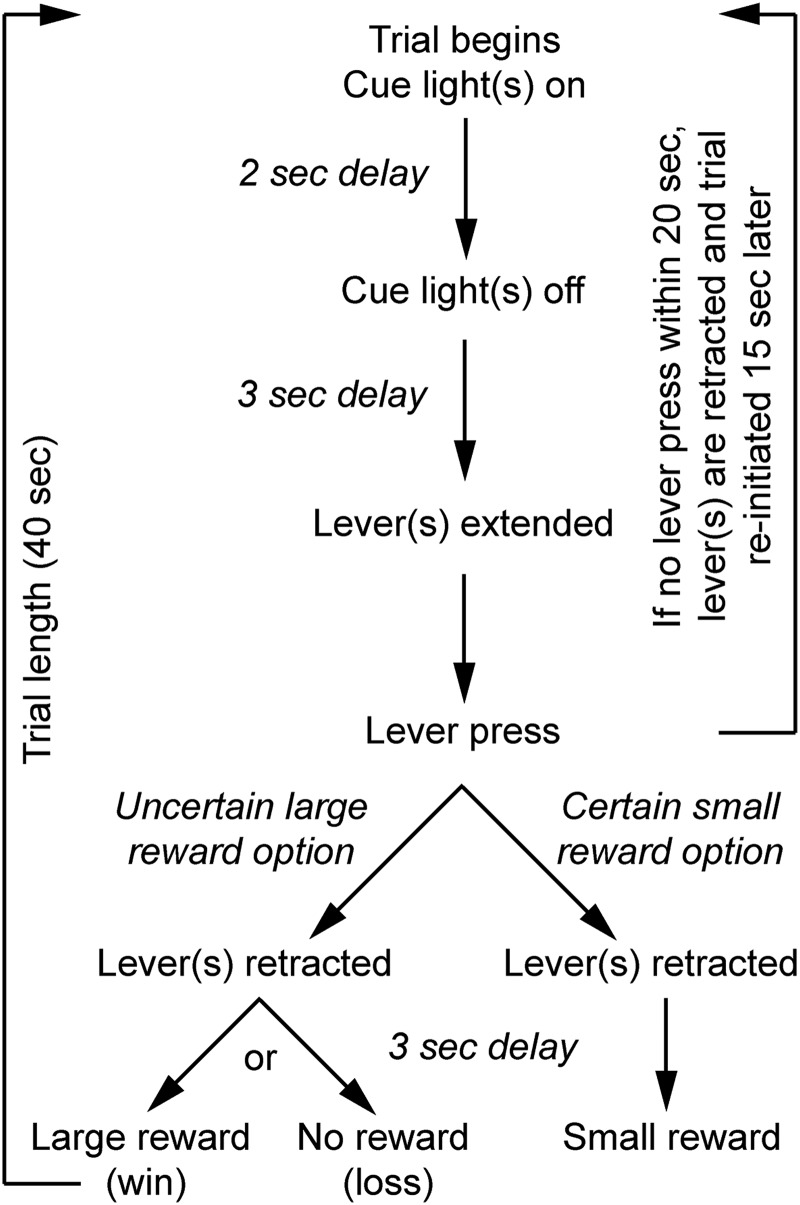
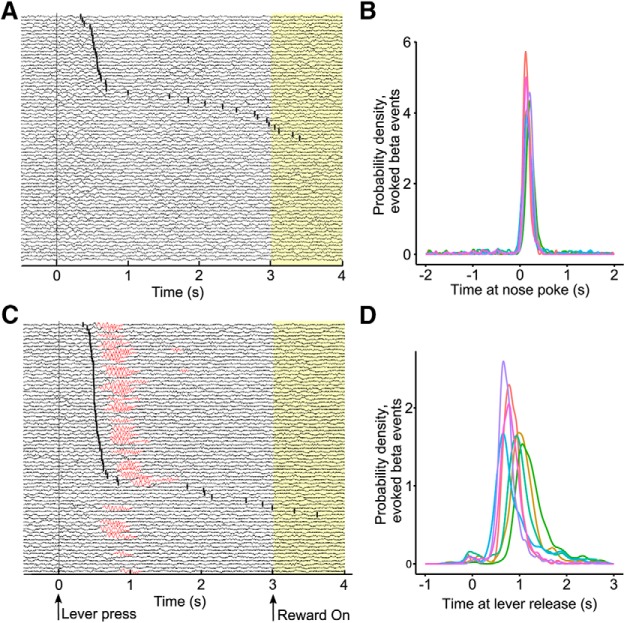
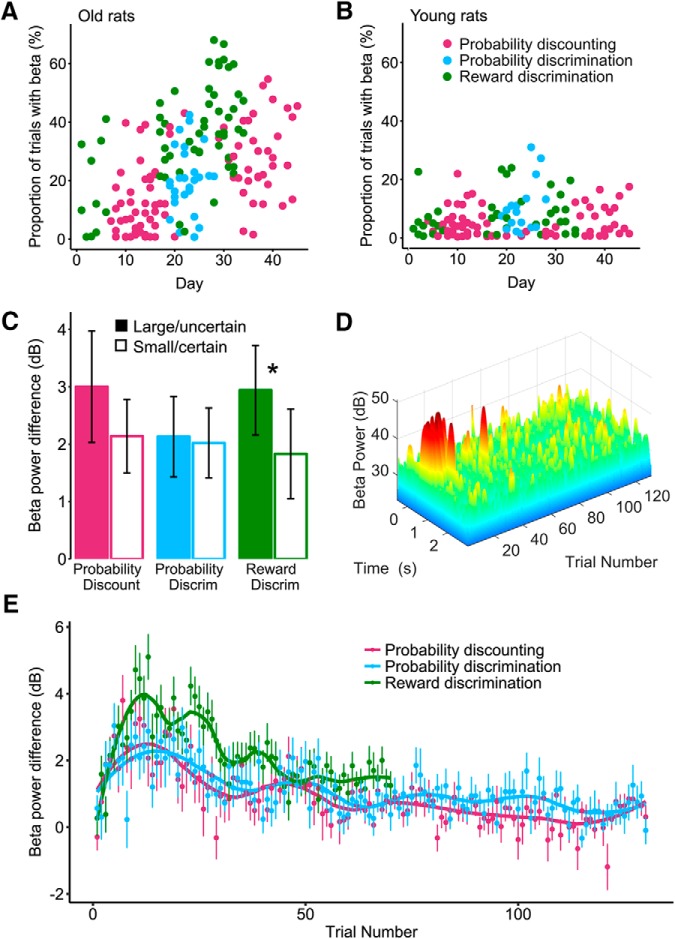
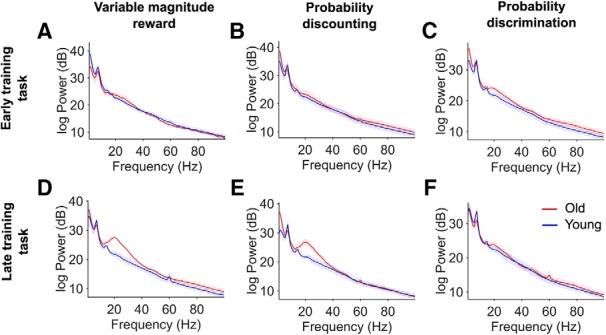
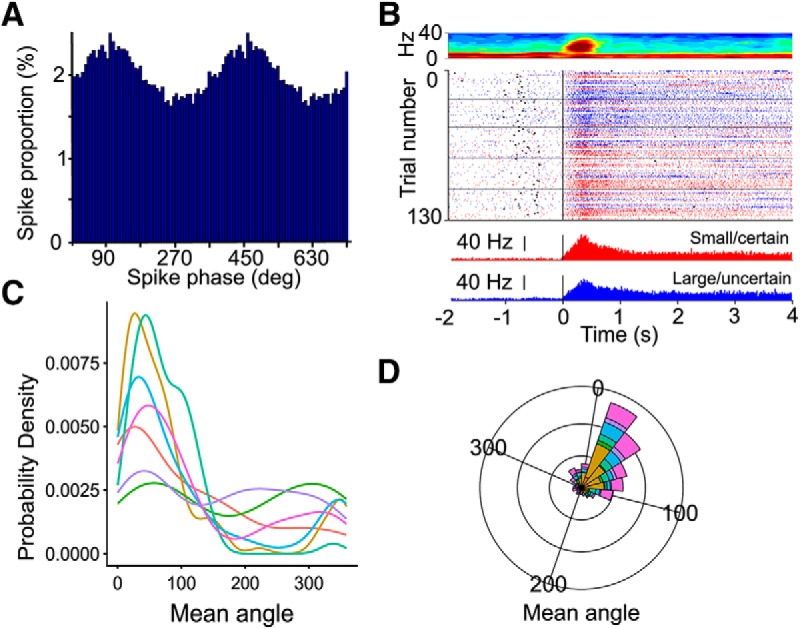
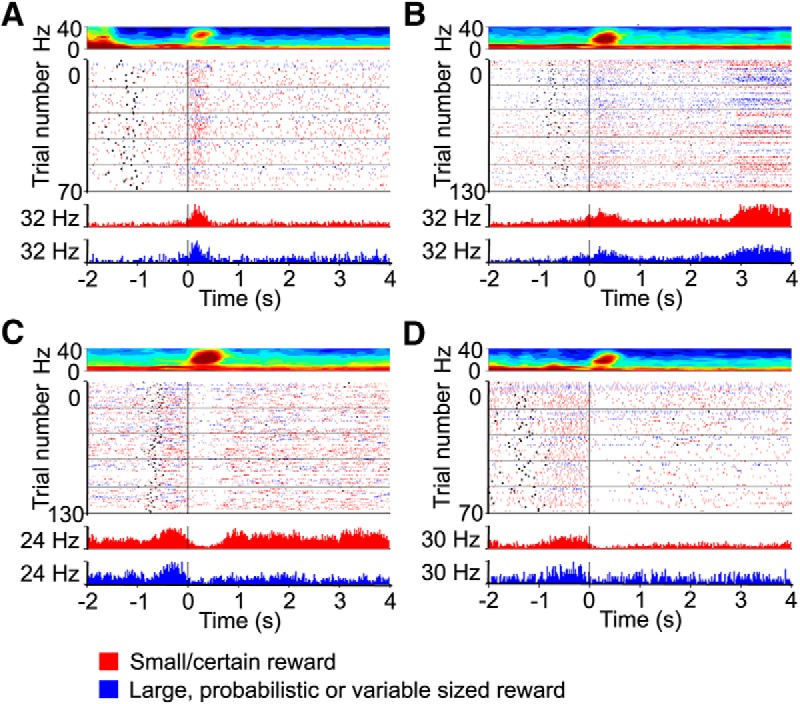
Older adults tend to use strategies that differ from those used by young adults to solve decision-making tasks. MRI experiments suggest that altered strategy use during aging can be accompanied by a change in extent of activation of a given brain region, inter-hemispheric bilateralization or added brain structures. It has been suggested that these changes reflect compensation for less effective networks to enable optimal performance. One way that communication can be influenced within and between brain networks is through oscillatory events that help structure and synchronize incoming and outgoing information. It is unknown how aging impacts local oscillatory activity within the basolateral complex of the amygdala (BLA). The present study recorded local field potentials (LFPs) and single units in old and young rats during the performance of tasks that involve discrimination learning and probabilistic decision making. We found task- and age-specific increases in power selectively within the β range (15-30 Hz). The increased β power occurred after lever presses, as old animals reached the goal location. Periods of high-power β developed over training days in the aged rats, and was greatest in early trials of a session. β Power was also greater after pressing for the large reward option. These data suggest that aging of BLA networks results in strengthened synchrony of β oscillations when older animals are learning or deciding between rewards of different size. Whether this increased synchrony reflects the neural basis of a compensatory strategy change of old animals in reward-based decision-making tasks, remains to be verified.

Keywords: basolateral complex of the amygdala; probability discounting; probability discrimination; reward expectation; reward magnitude discrimination.


Figures

Figure 1.
Figure 1.
Trial design. Timeline of trials on the probabilistic discounting task. A trial began with a 2-s cue-light on, above the respective lever. Two seconds after cue light was turned off, one or two levers were extended for the rat to press. Failure to press within 20 s resulted in lever retraction and the trial was reinitiated 15 s later. Pressing the lever for either large/uncertain or small/certain rewards led to lever retractions and reward delivery 3 s after lever press (loss trials resulted in an absence of reward delivery). For the reward magnitude discrimination task, the choices were small and variable sized rewards. For the probability discrimination task, the choices were certain and uncertain rewards (as depicted in Fig. 2). The next trial was initiated 40 s after the past cue-light-on event.
Figure 2.
Figure 2.
Behavioral performance of young and aged rats during discrimination learning and decision-making tasks. A, Schematic illustrating the pattern of alternation between the three decision-making tasks. For analysis purposes, the training periods are separated into early and late periods. Cartoon representing each task: the reward discrimination task (green) involved choosing between a small and a variable sized larger reward, the probability discounting task (magenta) involved choosing between a small/certain reward and a large/uncertain reward and the probability discrimination task (blue) involved choosing between medium/certain reward and a medium/uncertain reward. B, Schematic of coronal sections based on Paxinos and Watson (2014), showing the marker lesion sites at the endpoints of the tetrode recording probes on the last day of the experiment, for each rat. Tetrodes were lowered at the end of each recording day for the young (black filled circles) and old (red filled circles) groups. Analyses only include days in which tetrodes were located within the BLA. C, Percentage choice of the variable sized rewards and uncertain rewards across days of training in old rats. Scatterplots of the behavioral performance of each rat across days of training (x-axis), in the three tasks (as described in A). Performance values are jittered vertically to prevent overlap. D, Same as C, in young rats. E, Percentage choice of the variable sized reward over blocks of trials (x-axis), during the early (solid line) and late (dashed) training phases, for the reward magnitude discriminations task. Symbols represent mean ± 95% CI. There is a significant effect of age in the late training phase (p < 0.05). F, Percentage choice of the large/uncertain reward over blocks of trials (x-axis), during the early (solid line) and late (dashed) training phases, for the probability discounting task. Symbols represent mean ± 95% CI. There is a nonsignificant trend for an age difference (p = 0.08). G, Percentage choice of the uncertain reward over blocks of trials (x-axis), during the early (solid line) and late (dashed) training phases, for the probability discrimination task. Symbols represent mean ± 95% CI. There is no significant age difference (p > 0.05).
Figure 3.
Figure 3.
Significant β-band oscillation (15–30 Hz) power increase in old rats after lever presses. A, Normalized spectrogram of an example recording session from a young rat, with 0 being aligned to light cue onset. For this example, the recording electrode was located in BLA and the signal was rereferenced to a cerebellar screw in the skull. The light cue was 2 s in duration (indicated by the arrows below D). B, Normalized spectrogram of the same rat and recording session as in A, with 0 being aligned to the lever press and the signal rereferenced to a cerebellar screw. Reward delivery occurred 3 s after lever press (indicated by the arrows below E). C, Same spectrogram time point as for B. Signal is taken from the cerebellar LFP recording screw which reflects the signal between it and the reference tetrode located in a quiet area in the fiber bundle dorsal to posterior striatum. D, Same as A, for an old rat. E, Same as B, for an old rat, taken from the same rat and session as in D. Note the elevated power in the β range, around 15–30 Hz. F, Same spectrogram time point as E. Signal is taken from the cerebellar LFP recording screw which reflects the signal between it and the reference tetrode located in a quiet area in the fiber bundle dorsal to posterior striatum. Note the attenuated signal in the β-range frequencies (15–30 Hz) near posterior striatum as compared to that of the BLA LFP signal in D. G, Power spectra from all young rats during the first session of the late training phase of the reward discrimination task. Average session spectra taken during the period after a lever press (0.3–2.0 s post-lever press), showing an elevated theta peak, but not β in the young rats (each color represents the power spectra of a different rat). This is with the exception of one young rat showing elevated power around 15 Hz. H, Same as in E, for all aged rats. Figure shows elevated power in the theta and β ranges in all aged rats.
Figure 4.
Figure 4.
β Epochs occur primarily when old rats arrive at the reward zone. A, Example of a single trial spectrogram after a lever press. The vertical red line at 0 indicates lever press. Hot colors indicate elevated power. Vertical red lines denote the lever press (AC). B, LFP trace corresponding to the spectrogram in A, showing a burst of β activity. C, y-position of the rat at the time of the LFP recordings in A, B. The blue line represents the position along the y-axis, as the rat goes toward the feeder (see y-axis depiction in E). The arrow at 0 s indicates lever press, and the one at 3 s indicates reward onset. D, Example of a session from an old rat. Shown is the average normalized heat map of β power weighted by the percentage time spent in that location. The color bar represents the gradient change in normalized power, warmer colors indicate the location with highest β power, and a lack of color indicates positions that were not covered by the rat during the session. The heat map in this panel is oriented similarly to the operant chamber illustration in G. E, Spatial location of β events of all aged rats (all sessions). The location was determined based on the position of the rat’s head at the start of each β oscillation, as shown in F. Red circles indicate β oscillations occurring between lever press and reward time points, whereas blue circles indicate all other β oscillations that occurred during the experimental tasks. F, LFP traces showing representative example bursts of β activity in young and old rats. The red markers indicate the start and end time points of each β burst. These time points were used to identify trials containing task-evoked β oscillations. Note that when present, β oscillations in young rats were of lower amplitude than those from the aged rats. G, Schematic drawing of the operant chamber used for the discrimination learning and decision-making task. The chamber is of trapezoid shape with small walls on the side of the chamber to minimize potential collisions between the brain implant and the chamber walls.
Figure 5.
Figure 5.
β Oscillations do not correlate with reaction times, but with nose pokes in the food area. A, Young rat example of LFP traces recorded over the 70 session trials, from a reward magnitude discrimination task, sorted by reaction time (nose poke at the reward zone, black tick mark). Yellow background indicates reward delivery at 3-s post-lever release (delivery duration: 0.5 s for small, 0.5–2 s for the variable magnitude reward). B, Probability density function of the timing of β epochs aligned at 0 at the nose poke in the food area, for each aged rat (denoted by the different colors). C, Same as A, in an old rat. Red portion of traces indicate β-band oscillation occurrence. D, Same as in B, with the data aligned at 0 at the lever press.
Figure 6.
Figure 6.
Incidence of high-power β epochs increases with training days but decreases within session trials. A, The proportion of trials with task-evoked β oscillations increases across daily sessions in old rats. Colors represent the task performed: magenta, probability discounting; green, reward discrimination; blue, probability discrimination. B, Same scatterplot as in A, showing that β power did not increase over days in the young rats, and was, overall, lower than for the older animals. C, β power is greater following presses for the large reward in the reward magnitude discrimination task in aged rats (data taken from block 1 in the late training period, where β is highest). Star denotes significance (p < 0.05). D, Example distribution of β power over trials in a daily session of a probability discounting task illustrating the greater amount of β power events early in the task, in an old rat. The time axis is aligned at 0 for the lever press. Warmer colors correspond to higher β power. E, β power as a function of trial, separated by task type (data taken from the late training period, where β is highest). Overall, β power was higher in the reward magnitude discrimination task (green). Within a session, β power is highest around trial 10 and then gradually decreases thereafter.
Figure 7.
Figure 7.
Task average power spectra in all young and aged rats, separated by training period. Each task is separated into a column, with the reward magnitude task (left), the probability discounting task (center), and the probability discrimination task (right). A–C, Spectrogram of the average LFP power during task (0.1–3.0 s after lever press), for the early training period. DF, Same as A–C, for the late training period. The blue line corresponds to the power spectra in young rats and the red line corresponds to aged rats. Shading corresponds to SEM. Note the increased power in the β-band range in aged rats, for the late training period of reward magnitude and probability discounting tasks.
Figure 8.
Figure 8.
The firing of some BLA cells is phase-locked with β. A, Example firing activity of a BLA neuron phase-locked to β. y-axis represents the percentage of spikes at each phase, with the histogram bins for 1 cycle (0–360°) adding to 100%. B, Example session spectrogram in an old rat (top) with raster plot of the firing of an example neuron across trials (center) and corresponding peri-event time histogram of the average spike counts (bottom). The three plots are aligned such that 0 represents the nosepoke (black line). The black ticks in the center raster plot, and to the left of the black nose poke line, represent the lever press timestamps. C, Probability density function of the preferred firing phase on the β cycle, in each aged rat (colors corresponds to each rat in D). D, Polar plot showing the phase relationship between phase-locked BLA neurons and β, in each aged rat (denoted by the different colors).
Figure 9.
Figure 9.
Example firing activity of neurons during task sessions that contained periods of high β power. Four example BLA neurons from aged rats (A–D) show the heterogeneity in response pattern, from short bursts of activity, to long sustained activations, as well as drops in firing. The top part of each panel shows the average session spectrogram, the middle portion of each panel shows raster plots of the firing activity during each trial and the bottom portion shows the peri-event time histograms of the average firing activity, averaged by lever choice (red for lever small/certain reward and blue for the variable sized or probabilistic rewards). The three panels are 0 aligned to the first nose poke after lever press. The center raster plot trials are colored as in the bottom panel. The black ticks in the middle raster plot, and to the left of the black nose poke line, represent the lever press timestamps.

Similar articles

Cited by

References

    1. Ardid S, Vinck M, Kaping D, Marquez S, Everling S, Womelsdorf T (2015) Mapping of functionally characterized cell classes onto canonical circuit operations in primate prefrontal cortex. J Neurosci 35:2975–2991. 10.1523/JNEUROSCI.2700-14.2015 - DOI - PMC - PubMed
    1. Bäckman L, Lindenberger U, Li S-C, Nyberg L (2010) Linking cognitive aging to alterations in dopamine neurotransmitter functioning: recent data and future avenues. Neurosci Biobehav Rev 34:670–677. 10.1016/j.neubiorev.2009.12.008 - DOI - PubMed
    1. Barnes CA, Rao G, McNaughton BL (1996) Functional integrity of NMDA-dependent LTP induction mechanisms across the lifespan of F-344 rats. Learn Mem 3:124–137. 10.1101/lm.3.2-3.124 - DOI - PubMed
    1. Bates D, Maechler M, Bolker B, Walker S (2015) Fitting Linear Mixed-Effects Models Using lme4. Journal of Statistical Software, 67:1–48. 10.18637/jss.v067.i01 - DOI
    1. Bauer EP, Paz R, Paré D (2007) Gamma oscillations coordinate amygdalo-rhinal interactions during learning. J Neurosci 27:9369–9379. 10.1523/JNEUROSCI.2153-07.2007 - DOI - PMC - PubMed

Publication types

LinkOut - more resources