. 2017 Sep-Oct;1(5):435-447.
doi: 10.1016/j.oret.2017.01.019. Epub 2017 Apr 5.

The Definition, Rationale, and Effects of Thresholding in OCT Angiography

Affiliations

The Definition, Rationale, and Effects of Thresholding in OCT Angiography

Emily D Cole et al. Ophthalmol Retina. 2017 Sep-Oct.

Abstract

Purpose: To examine the definition, rationale, and effects of thresholding in OCT angiography (OCTA).

Design: A theoretical description of OCTA thresholding in combination with qualitative and quantitative analysis of the effects of OCTA thresholding in eyes from a retrospective case series.

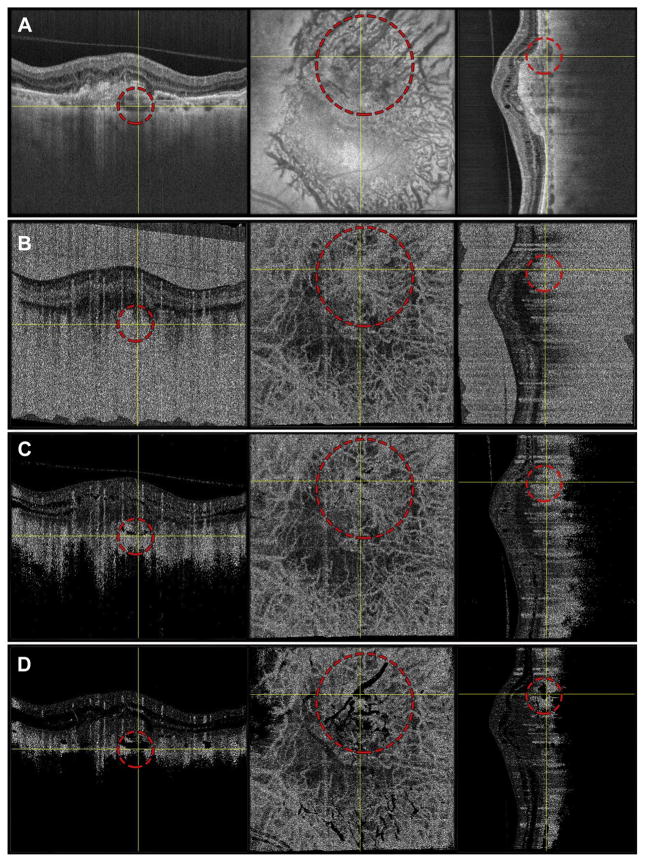
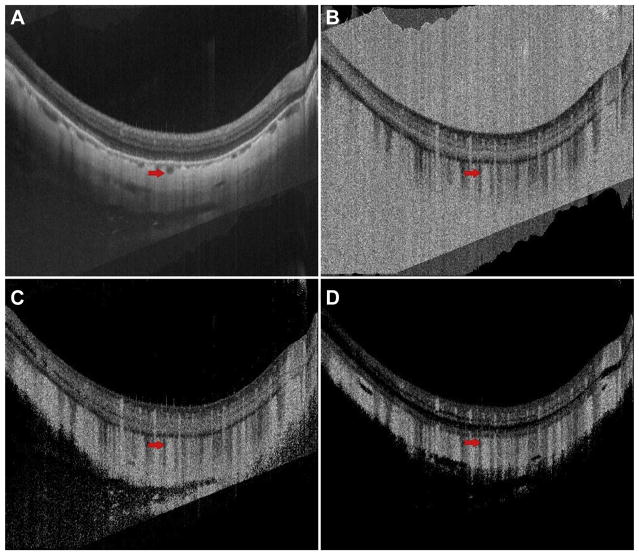
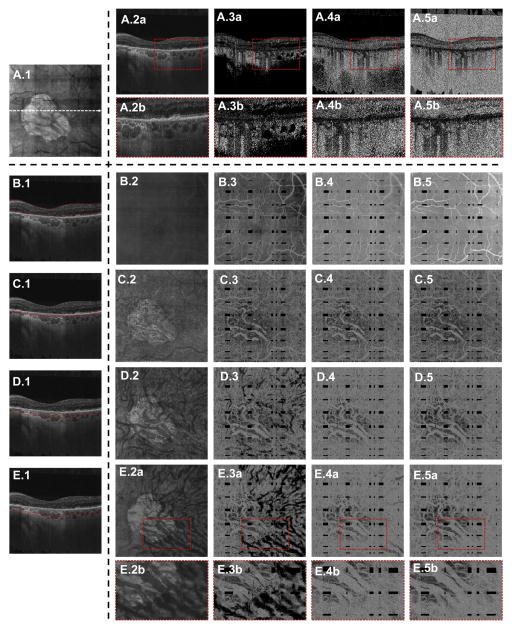
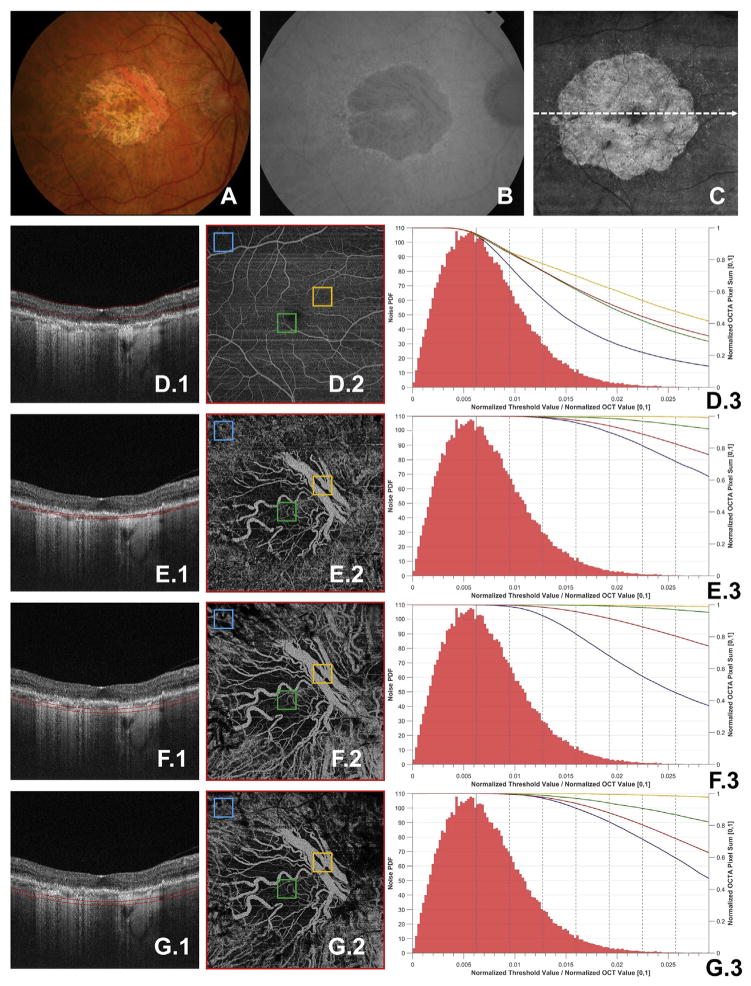
Participants: Four eyes were qualitatively examined: 1 from a 27-year-old control, 1 from a 78-year-old exudative age-related macular degeneration (AMD) patient, 1 from a 58-year-old myopic patient, and 1 from a 77-year-old nonexudative AMD patient with geographic atrophy (GA). One eye from a 75-year-old nonexudative AMD patient with GA was quantitatively analyzed.

Main outcome measures: A theoretical thresholding model and a qualitative and quantitative description of the dependency of OCTA on thresholding level.

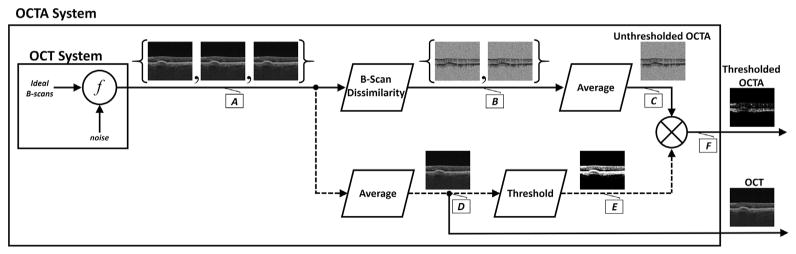
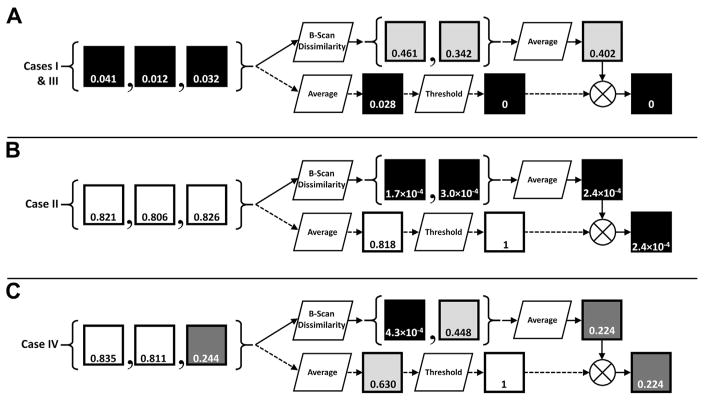
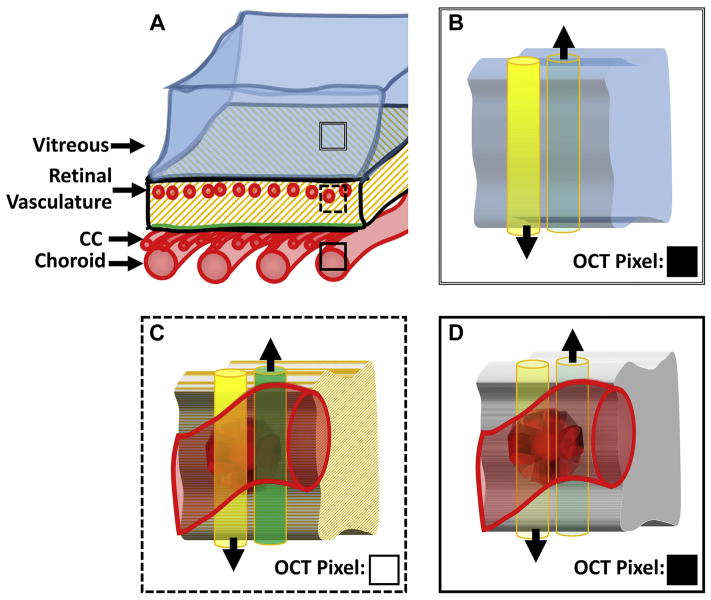
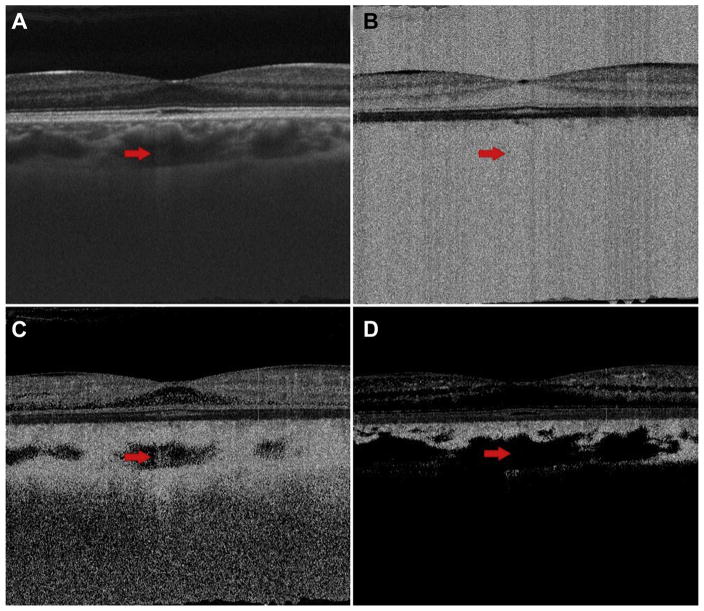
Results: Due to the presence of system noise, OCTA thresholding is a necessary step in forming OCTA images; however, thresholding can complicate the relationship between blood flow and OCTA signal.

Conclusions: Thresholding in OCTA can cause significant artifacts, which should be considered when interpreting and quantifying OCTA images.


Conflict of interest statement

Conflicts of Interest: J.S.D.: Consultant and research support — Carl Zeiss Meditec, OptoVue, and Topcon Medical Systems Inc; stock — Hemera Biosciences Inc, EyeNetra, and Ophthotech Corp. N.K.W.: Consultant — Iconic Therapeutics; speaker’s bureau —ThromboGenics; research support — Carl Zeiss Meditec, Inc. J.G.F.: Royalties — intellectual property owned by the Massachusetts Institute of Technology and licensed to Carl Zeiss Meditec Inc, Optovue Inc; stock options — Optovue Inc. There are no conflicting relationships for any other author.

Figures

Figure 1
Figure 1
Signal flow diagram of OCT angiography (OCTA) processing steps. Lettered callouts A through F denote the value of the signal at different points in the processing workflow. The repeated OCT B-scans, A, are taken in rapid succession from the same tissue location. Here we are assuming that a 3 repeated B-scan protocol is used. Each of these B-scans is modeled as resulting from the mixing of an “ideal,” noise-free OCT B-scan, combined with a noise signal, where f is the (unspecified) mixing function. The repeated OCT B-scans are then input into the B-Scan Dissimilarity block, generating a set of unthresholded, unaveraged OCTA B-scans, B. Note that if only a single interscan time is used then a set of 3 repeated B-scans generates a set of 2 unaveraged, unthresholded OCTA B-scans. The B-scans at B are then averaged to increase the signal-to-noise ratio, forming C, which is referred to as the unthresholded OCTA B-scan. Separately, shown with dashed lines, the thresholding masks are computed by averaging the repeated OCT B-scans and then comparing, on a pixel-by-pixel basis, this average, D, to a predefined threshold to form the thresholding mask, E. Specifically, a pixel in the threshold mask, E, takes a value of 1 when its corresponding pixel in D is greater than the threshold, and 0 when its corresponding pixel in D is less than the threshold. Finally, the threshold mask, E, is multiplied, on a pixel-by-pixel basis, with the unthresholded OCTA B-scan to form F, which we refer to as the thresholded OCTA B-scan. Typically, the 2 outputs exiting the outer box (the thresholded OCTA B-scan and the OCT B-scan) are the only data that are accessible in commercial systems.
Figure 2
Figure 2
Pixel-wise OCT angiography processing steps of Figure 1. Each row, AC, corresponds to a different hypothetical pixel location taken from the B-scans in Figure 1, with the squares representing single pixels. Black pixels correspond to low signals, white pixels correspond to high signals, and the number within each square indicates that pixel’s value (in the normalized range of [0,1]). Cases I–IV, as described in Table 2, are noted. The scenario illustrated in A corresponds to a region of low OCT signal. Note that this scenario may correspond to a region of low/no flow (e.g., vitreous humor), or high flow (e.g., choroid). The scenario illustrated in B corresponds to a region of high, constant OCT signal, typical of highly scattering, avascular layers, such as the retinal pigment epithelium. The scenario illustrated in C corresponds to a region of high, time-varying OCT signal, typical of the retinal vascular layers.
Figure 3
Figure 3
Illustration of the different causes of low OCT signal. A, Sketch of the posterior eye, from the vitreous to the choroid. The 3 different boxes— double-lined, dashed, and solid—correspond to panels B, C, and D, respectively. For each of B, C, and D, the yellow (left) cylinder corresponds to the incident OCT beam and the green (right) cylinder corresponds to the backscattered light. These cylinders are shown side-by-side for visual clarity; however, in reality they are superimposed. The black arrows point in the direction of energy (photon) propagation. More opaque yellow coloring (B and C) corresponds to a stronger (i.e., less attenuated) incident OCT beam; more transparent yellow coloring (D) corresponds to a weaker (i.e., more attenuated) incident beam. Similarly, more opaque green coloring, C, corresponds to stronger backscattered light (i.e., more backscattered photons); more transparent green coloring, B and D, corresponds to weaker backscattered light (i.e., less backscattered photons). The squares in the bottom right corner of BD, labeled “OCT Pixel,” indicate the hypothetical value of the OCT pixel corresponding to that tissue location, with black being low and white being high. CC = choriocapillaris. B, Tissue cube from the vitreous humor. The incident beam is strong, having been minimally attenuated. However, because the vitreous humor does not contain backscatterers, the backscattered light is small. Thus, the corresponding OCT pixel is black. C, Tissue cube from a layer intersecting the retinal vasculature. The incident beam is still strong, and due to the presence of backscattering tissue (in this case an erythrocyte), there is significant backscattered light. Thus, the corresponding OCT pixel is white. D, Tissue cube from the choroid/choriocapillaris. The incident beam is strongly attenuated, having passed through the retinal pigment epithelium and potentially some choroidal vasculature. Thus, even though the tissue at this location contains back-scatterers, the backscattered light is minimal. Thus the corresponding OCT pixel is black.
Figure 4
Figure 4
Case 1: A 27-year-old normal patient. A, OCT B-scan; B, unthresholded OCT angiography (OCTA) B-scan; C, choroidal thresholded OCTA image; and D, retinal thresholded OCTA image. The arrow points to an area of relatively increased OCT signal level on the OCT B-scan.
Figure 5
Figure 5
Case 2: A 78-year-old patient with exudative age-related macular degeneration. To co-locate the same features on both en face and cross-sectional slices, data were viewed in an orthoplane manner; for each row in this figure, the left panel corresponds to a B-scan along the fast scan direction, the middle panel corresponds to an en face plane, and the right panel corresponds to a B-scan along the slow scan direction. For each panel, the yellow crosshairs indicate the locations of the views in the other 2 panels in that row. The red dashed circle demarcates a choroidal vessel. Row A shows the OCT images; row B, the unthresholded OCT angiography (OCTA) images; row C, the choroidal thresholded OCTA data; and row D, the retinal thresholded OCTA data.
Figure 6
Figure 6
Case 3: A 58-year-old myopic patient. A, OCT B-scan; B, unthresholded OCT angiography (OCTA) B-scan; C, choroidal thresholded OCTA B-scan corresponding; and D, retinal thresholded OCTA B-scan. The arrow indicates a choroidal vessel.
Figure 7
Figure 7
Case 4: A 77-year-old patient with nonexudative age-related macular degeneration with geographic atrophy (GA). A.1, En face mean projection through the entire OCT volume. The cross-sectional OCT/OCT angiography (OCTA) B-scans in A.2, A.3, A.4, and A.5, as well as in B.1, C.1, D.1, and E.1, are extracted from the dashed white arrow in A.1. A.2a, Extracted OCT B-scan. A.3a, Extracted choroidal thresholded OCTA B-scan. A.4a, Extracted retinal thresholded OCTA B-scan. A.5a, Extracted unthresholded OCTA B-scan. The enlargements A.2b, A.3b, A.4b, and A.5b correspond to the dashed red boxes in A.2a, A.3a, A.4a, and A.5a, respectively. The enlargement A.3b shows circular areas of low OCTA signal corresponding to the choroidal vasculatures; these features are not present in A.4b and A.5b. BE, En face illustration of thresholding. The red lines in B.1, C.1, D.1, and E.1 correspond to the contours between which the OCT(A) signal was projected to form the en face images in B.2B.5, C.2C.5, D.2D.5, and E.2E.5, respectively. The en face projections B.2, C.2, D.2, and E.2 are projections of the OCT volume; the en face projections B.3, C.3, D.3, and E.3 are projections of the choroidal thresholded OCTA volume; the en face projections B.4, C.4, D.4, and E.4 are projections of the retinal thresholded OCTA volume; and the en face projections B.5, C.5, D.5, and E.5 are projections of the unthresholded OCTA volume. The enlargements E.2b, E.3b, E.4b, and E.5b are taken from the dashed red boxes in E.2a, E.3a, E.4a, and E.5a, respectively. The enlargement E.3b shows how the larger choroidal vasculature has high OCTA signal within the margin of GA, but has low OCTA signal outside of the GA margin; this is because in the region of the GA the retinal pigment epithelium is absent, allowing more light to be incident on the choroid.
Figure 8
Figure 8
Case 5: A 75-year-old nonexudative age-related macular degeneration with geographic atrophy (GA). A, Fundus photograph, B, fundus auto-fluorescence, and C, en face projection of the entire OCT volume. D.1, E.1, F.1, G.1, OCT B-scans taken from the dashed white arrow in C; the red contours in these B-scans correspond to the depths through which the corresponding OCT angiography (OCTA) volumes were mean projected to form D.2, E.2, F.2, and G.2. Each of D.2, E.2, F.2, and G.2 were thresholded using the retinal threshold. The 4 squares—blue, green, orange, and red, the last of which encompasses the entire field of view—correspond to the similarly colored curves in plots D.3, E.3, F.3, and G.3. For each of these regions of the interest, the threshold was varied from 0 (i.e., unthresholded) to 7 standard deviations above the estimated mean of the noise. For each analyzed threshold value, the sum of the OCTA signal over the boxes shown in D.2, E.2, F.2, and G.2 was taken. This sum was then normalized by the sum of the unthresholded OCTA signal, summed over the region of interest. The results are plotted in D.3, E.3, F.3, and G.3, where the x-axis corresponds to the threshold value, which has been normalized to the maximum OCT B-scan value, averaged over all B-scans in the volume; the right y-axis corresponds to the normalized OCTA sum. Also plotted in D.3, E.3, F.3, and G.3 is the histogram of the measured noise, normalized to have unity area, so that it corresponds to a valid probability density function. Note that the noise is measured once per OCT acquisition, so the same noise histogram appears in D.3, E.3, F.3, and G.3. When reading the histogram, the x-axis corresponds to the pixel value of the noise, and the left y-axis corresponds to the value of the histogram at that pixel value. Bin sizes for the histogram were calculated using Freedman-Diaconis rule. For reference, the mean of the value of the noise distribution is shown as the solid vertical gray line, with each of the dotted gray lines to the right of the mean corresponding to an additional standard deviation above the mean. The field of view for all OCT(A) images is 6 mm × 6 mm.

References

    1. Makita S, Hong Y, Yamanari M, et al. Optical coherence angiography. Opt Express. 2006;14(17):7821–7840. - PubMed
    1. Mahmud MS, Cadotte DW, Vuong B, et al. Review of speckle and phase variance optical coherence tomography to visualize microvascular networks. J Biomed Opt. 2013;18(5):50901. - PubMed
    1. Mariampillai A, Standish BA, Moriyama EH, et al. Speckle variance detection of microvasculature using swept-source optical coherence tomography. Opt Lett. 2008;33(13):1530–1532. - PubMed
    1. An L, Wang RK. In vivo volumetric imaging of vascular perfusion within human retina and choroids with optical micro-angiography. Opt Express. 2008;16(15):11438–11452. - PubMed
    1. Makita S, Jaillon F, Yamanari M, et al. Comprehensive in vivo micro-vascular imaging of the human eye by dual-beam-scan Doppler optical coherence angiography. Opt Express. 2011;19(2):1271–1283. - PubMed

LinkOut - more resources