. 2017 Oct 16:6:e29198.
doi: 10.7554/eLife.29198.

Quantifying the contribution of Plasmodium falciparum malaria to febrile illness amongst African children

Affiliations

Quantifying the contribution of Plasmodium falciparum malaria to febrile illness amongst African children

Ursula Dalrymple et al. Elife. .

Erratum in

Abstract

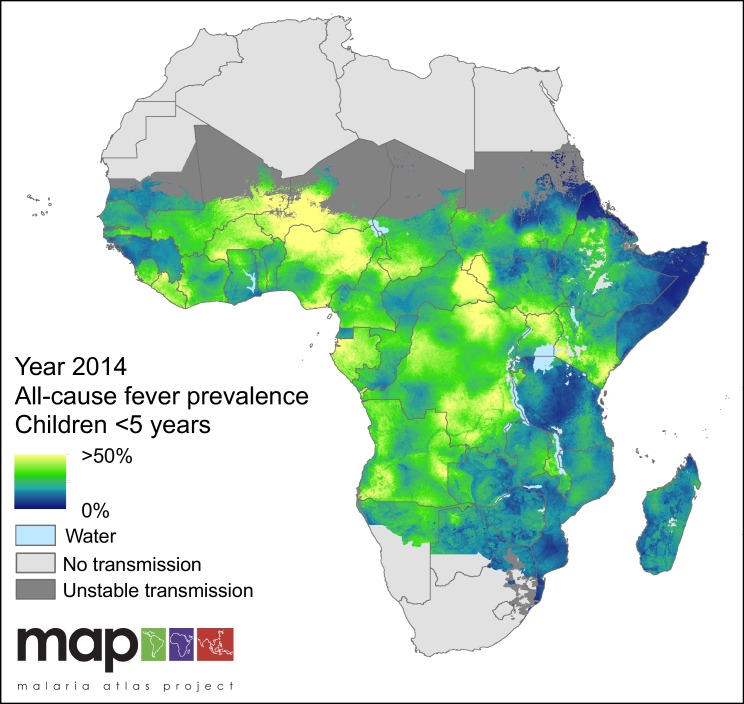
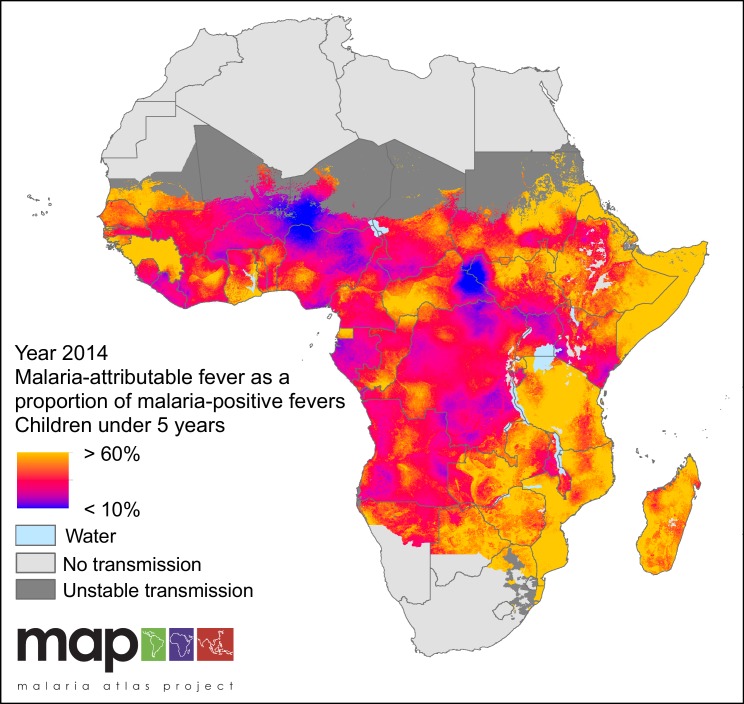
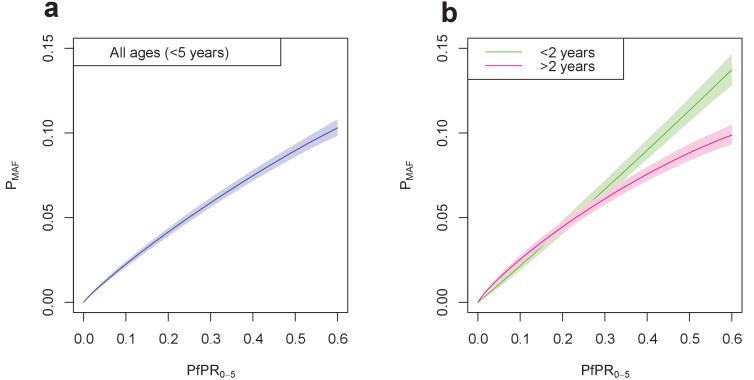
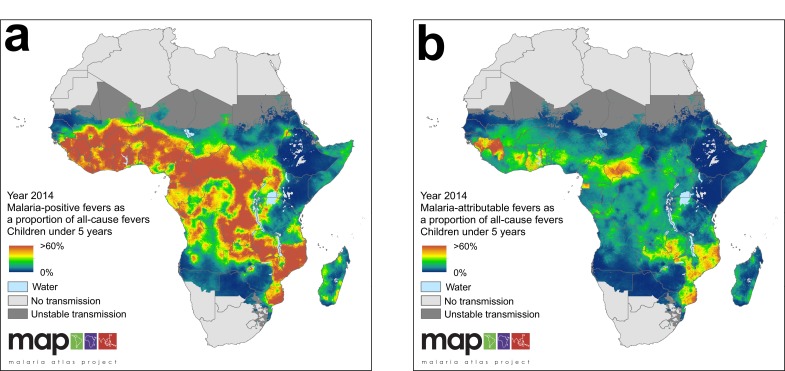
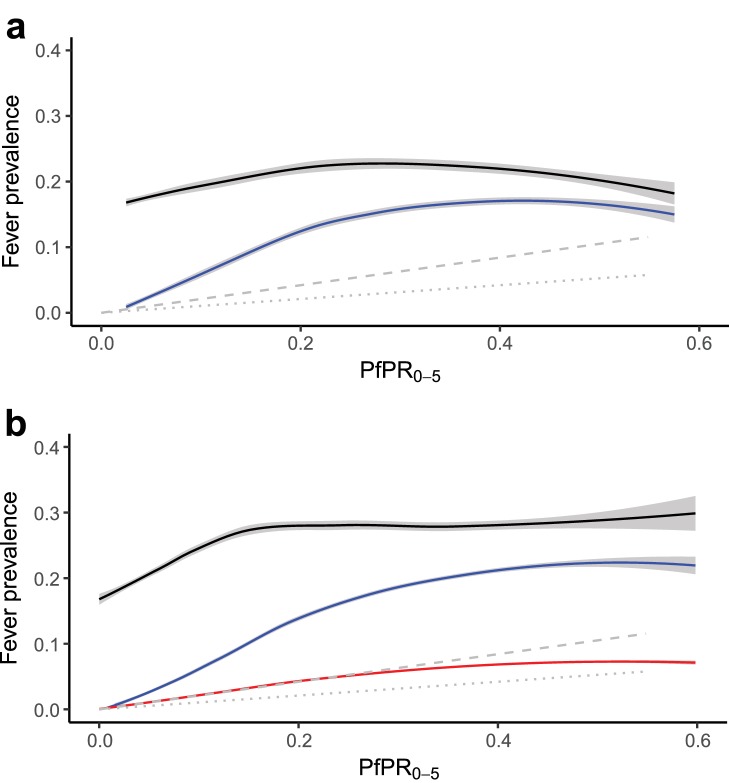
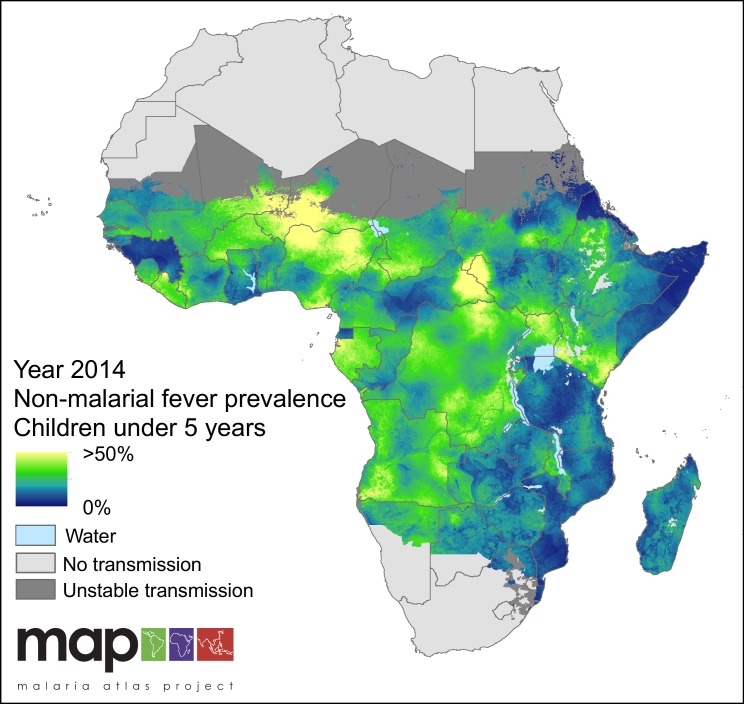
Suspected malaria cases in Africa increasingly receive a rapid diagnostic test (RDT) before antimalarials are prescribed. While this ensures efficient use of resources to clear parasites, the underlying cause of the individual's fever remains unknown due to potential coinfection with a non-malarial febrile illness. Widespread use of RDTs does not necessarily prevent over-estimation of clinical malaria cases or sub-optimal case management of febrile patients. We present a new approach that allows inference of the spatiotemporal prevalence of both Plasmodium falciparum malaria-attributable and non-malarial fever in sub-Saharan African children from 2006 to 2014. We estimate that 35.7% of all self-reported fevers were accompanied by a malaria infection in 2014, but that only 28.0% of those (10.0% of all fevers) were causally attributable to malaria. Most fevers among malaria-positive children are therefore caused by non-malaria illnesses. This refined understanding can help improve interpretation of the burden of febrile illness and shape policy on fever case management.

Keywords: P. falciparum; epidemiology; fever; global health; non-malarial febrile illness; none.


Conflict of interest statement

No competing interests declared.

Figures

Figure 1.
Figure 1.. Predicted all-cause fever prevalence within limits of stable P. falciparum transmission in children under 5 years of age in 2014.
Figure 1—figure supplement 1.
Figure 1—figure supplement 1.. The histogram of the probability integral transform diagnostic.
The uniform shape of the histogram shows that predictions at sites held out from the initial model drawn from the predicted posterior distribution for the prevalence of febrile illness matched well.
Figure 2.
Figure 2.. Predicted malaria-attributable fevers as a proportion of malaria-positive fevers (children under 5 years of age, 2014).
Predictions are shown within the limits of stable P. falciparum transmission.
Figure 3.
Figure 3.. Malaria-attributable fevers as a proportion of malaria-positive fevers (children < 5 years of age, 2014).
Plotted values are the population-weighted mean for 43 sub-Saharan African countries over the study period, 2006–2014. Countries have been grouped by region to improve clarity.
Figure 4.
Figure 4.. Final fitted relationship between PfPR0-5 and probability of a malaria-attributable fever (MAF) in the past two weeks.
(a) shows this relationship in children under five years of age, and (b) disaggregated into children under 2 years of age, and children aged 2–4 years. The probability of MAF in the past two weeks is greater for children under 2 years of age than for children above 2 years of age in areas with a PfPR0-5 higher than approximately 0.3. Median values of the posterior distribution are shown, with shaded 95% credible intervals.
Figure 5.
Figure 5.. (a) Predicted malaria-positive fevers as a proportion of all fevers; (b) predicted malaria attributable fevers (MAF) as a proportion of all fevers. Both maps are shown for the year 2014, for children under 5 years of age and bounded by the limits of stable P. falciparum transmission.
Figure 5—figure supplement 1.
(a) Response data relationship between all-cause fever (black line) and malaria-positive fevers (blue line), and predicted incidence (symptomatic illness) for the duration of the past two to four weeks (grey dashed line) and past zero to two weeks (grey dotted line)* with PfPR0-5 from household survey datasets; and (b) the modelled relationship between all-cause fever (black line), malaria-positive fevers (blue line), and malaria attributable fevers (red line), and predicted incidence in the past two to four weeks (grey dashed line) and past zero to two weeks (grey dotted line)* with PfPR0-5 sampled from 10,000 pixels in predicted raster layers. Mean lines were fitted using locally-weighted regression, and shaded with 95% confidence intervals. *In both plots, the predicted incidence lines are generated from an ensemble of transmission models estimating the relationship between P. falciparum prevalence and incidence, standardised to ages 0 to 4 years old (Cameron et al., 2015). The grey dashed line depicts the estimated proportion of children in the past two to four weeks who had a clinical episode of malaria, and the grey dotted line depicts the estimated proportion of children in the past zero to two weeks who had a clinical episode of malaria, each with increasing P. falciparum malaria prevalence. A good fit between predicted MAF and transmission model estimations of clinical incidence indicates our model has strong predictive performance.
Figure 6.
Figure 6.. Predicted non-malarial febrile illness (NMFI) prevalence in children under 5 years of age.
NMFI prevalence is defined as the sum of the prevalence of febrile illness without a P. falciparum malaria infection and the prevalence of febrile illness coincident with, but not caused by, a P. falciparum malaria infection (MCF), for children under 5 years of age and bounded within the spatial limits of stable P. falciparum transmission in 2014.

References

    1. Acestor N, Cooksey R, Newton PN, Ménard D, Guerin PJ, Nakagawa J, Christophel E, González IJ, Bell D. Mapping the aetiology of non-malarial febrile illness in Southeast Asia through a systematic review--terra incognita impairing treatment policies. PLoS ONE. 2012;7:e44269. doi: 10.1371/journal.pone.0044269. - DOI - PMC - PubMed
    1. Afrane YA, Zhou G, Githeko AK, Yan G. Clinical malaria case definition and malaria attributable fraction in the highlands of western Kenya. Malaria Journal. 2014;13:405. doi: 10.1186/1475-2875-13-405. - DOI - PMC - PubMed
    1. Angus JE. The probability integral transform and related results. SIAM Review. 1994;36:652–654. doi: 10.1137/1036146. - DOI
    1. Bhatt S, Gething PW, Brady OJ, Messina JP, Farlow AW, Moyes CL, Drake JM, Brownstein JS, Hoen AG, Sankoh O, Myers MF, George DB, Jaenisch T, Wint GR, Simmons CP, Scott TW, Farrar JJ, Hay SI. The global distribution and burden of dengue. Nature. 2013;496:504–507. doi: 10.1038/nature12060. - DOI - PMC - PubMed
    1. Bhatt S, Weiss DJ, Cameron E, Bisanzio D, Mappin B, Dalrymple U, Battle K, Moyes CL, Henry A, Eckhoff PA, Wenger EA, Briët O, Penny MA, Smith TA, Bennett A, Yukich J, Eisele TP, Griffin JT, Fergus CA, Lynch M, Lindgren F, Cohen JM, Murray CLJ, Smith DL, Hay SI, Cibulskis RE, Gething PW. The effect of malaria control on Plasmodium falciparum in Africa between 2000 and 2015. Nature. 2015;526:207–211. doi: 10.1038/nature15535. - DOI - PMC - PubMed

Publication types