Randomized Controlled Trial
. 2018 Feb;26(2):307-323.
doi: 10.1109/TNSRE.2017.2763458. Epub 2017 Oct 16.

Robot Training With Vector Fields Based on Stroke Survivors' Individual Movement Statistics

Randomized Controlled Trial

Robot Training With Vector Fields Based on Stroke Survivors' Individual Movement Statistics

Zachary A Wright et al. IEEE Trans Neural Syst Rehabil Eng. 2018 Feb.

Abstract

The wide variation in upper extremity motor impairments among stroke survivors necessitates more intelligent methods of customized therapy. However, current strategies for characterizing individual motor impairments are limited by the use of traditional clinical assessments (e.g., Fugl-Meyer) and simple engineering metrics (e.g., goal-directed performance). Our overall approach is to statistically identify the range of volitional movement capabilities, and then apply a robot-applied force vector field intervention that encourages under-expressed movements. We investigated whether explorative training with such customized force fields would improve stroke survivors' (n = 11) movement patterns in comparison to a control group that trained without forces (n = 11). Force and control groups increased Fugl-Meyer UE scores (average of 1.0 and 1.1, respectively), which is not considered clinically meaningful. Interestingly, participants from both groups demonstrated dramatic increases in their range of velocity during exploration following only six days of training (average increase of 166.4% and 153.7% for the Force and Control group, respectively). While both groups showed evidence of improvement, we also found evidence that customized forces affected learning in a systematic way. When customized forces were active, we observed broader distributions of velocity that were not present in the controls. Second, we found that these changes led to specific changes in unassisted motion. In addition, while the shape of movement distributions changed significantly for both groups, detailed analysis of the velocity distributions revealed that customized forces promoted a greater proportion of favorable changes. Taken together, these results provide encouraging evidence that patient-specific force fields based on individuals' movement statistics can be used to create new movement patterns and shape them in a customized manner. To the best of our knowledge, this paper is the first to directly link engineering assessments of stroke survivors' exploration movement behaviors to the design of customized robot therapy.


Figures
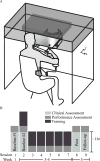
Fig. 1
Fig. 1
(A) Participants performed a motor exploration task by controlling the arm of a planar robotic device. (B) Participants completed two weeks of motor exploration training in the presence of a customized force field.
Fig. 2
Fig. 2
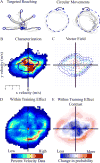
(A) Participants completed a goal-directed reaching task and a circular movement task at the beginning of each session. Typical participant’s baseline movement trajectories are shown. (B) A typical Force participant’s two dimensional probability distribution of velocity data tabulated across six trials of motor exploration during characterization, corresponding to 12 minutes of data. The black outline represents the 50th percentile contour of velocity data. The area of the contour corresponds to velocity coverage. (C) Customized force field designed by fitting a 2-D Gaussian model (colored contours) to the velocity data in (A) then calculating the gradient. The resulting vector field (blue arrows) represents the direction and relative magnitude of force applied during motor exploration training. (D) Training within a customized vector field pushed participants’ movement patterns in (A) from high probability areas to low probability areas. (E) Contrast plot shows the relative change in probability between within training effect and characterization distributions.
Fig. 3
Fig. 3
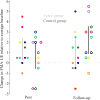
Both training groups improved clinical FMA-UE scores following two weeks of training. Each color represents a stroke participant (●, Force; ○, Control) corresponding to participants’ designated color in Table I; data points are staggered horizontally to avoid overlap. Vertical bars represent the mean and 95% confidence interval (gray, Force; black, Control).
Fig. 4
Fig. 4
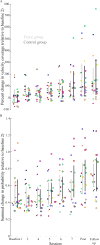
(A) Both training groups improved exploratory movement behaviors in terms of velocity coverage. (B) Movement behaviors deviated from Baseline 2 characterization across sessions. Each data point (●, Force;○, Control) represents a stroke participants’ cumulative transfer effect contrast score across each session. Each stroke participant is represented by a color according to Table I; data points are staggered horizontally to avoid overlap. Vertical bars represent group (gray, Forc; black, Control) mean and 95% confidence interval within each session.
Fig. 5
Fig. 5
Velocity distributions were significantly altered during vector field training. (A) Representative contrast plots showing the change between characterization and training velocity distributions within each training session (top row, Force; bottom row, Control). Red and blue shading indicates the relative amount of increase and decrease in velocity data within each bin, respectively. (B) The Force group demonstrated significantly greater within training effect contrast scores compared to the Control group. Each data point (●, Force; ○, Control) represents a stroke participant. Each stroke participant is represented by a color according to Table I; data points are staggered horizontally to avoid overlap. Vertical bars represent group (gray, Force; black, Control) mean and 95% confidence interval. The asterisk represents significance between training groups (α < 0.05).
Fig. 6
Fig. 6
(A) A typical baseline velocity distribution for one participant before training (Day 2, blue), and the corresponding probabilities after training (Day 3+, green and red), are shown here each with bins sorted according to the baseline magnitudes (day-2). After training, a new distribution reveals velocities that have exacerbated (“unfavorable changes”, red dots) the original trends of under-expressed or over-expressed probabilities (defined operationally as the values separated by the midpoint of 0.5 peak probability). In other cases, the new distribution indicates velocities in which the original trends were reversed (“favorable changes”, green dots). (B) We computed a metric as the sum of all favorable changes at each velocity bin as a proportion of all changes. Our results showed that the Force group exhibited significantly higher favorability scores compared to the Control Group (average of sessions 3–8, Δ = 0.085, CI: −0.16, 0.0072, p = 0.034).
Fig. 7
Fig. 7
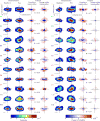
Individual participants’ (left, Force; right, Control) velocity distributions of motor exploration characterization prior to (Baseline 2) and following training (Post). Changes in movement behaviors across training (cumulative transfer effect) were correlated with changes during training (average within training effect contrast).

References

    1. Fugl-Meyer AR, Jääskö L, Leyman I, Olsson S, Steglind S. The post-stroke hemiplegic patient. 1. a method for evaluation of physical performance. Scand. J. Rehabil. Med. 1975 Jan;7(1):13–31. - PubMed
    1. Wolf SL, Catlin PA, Ellis M, Archer AL, Morgan B, Piacentino A. Assessing Wolf Motor Function Test as Outcome Measure for Research in Patients After Stroke. Stroke. 2001 Jul;32(7):1635–1639. - PubMed
    1. Lyle RC. A performance test for assessment of upper limb function in physical rehabilitation treatment and research. Int. J. Rehabil. Res. Int. Zeitschrift fu’r Rehabil. Rev. Int. Rech. reìadaptation. 1981 Jan;4(4):483–92. - PubMed
    1. Dewald JP, Pope PS, Given JD, Buchanan TS, Rymer WZ. Abnormal muscle coactivation patterns during isometric torque generation at the elbow and shoulder in hemiparetic subjects. Brain. 1995 Apr;118(Pt 2):495–510. - PubMed
    1. Dewald JP, Beer RF. Abnormal joint torque patterns in the paretic upper limb of subjects with hemiparesis. Muscle Nerve. 2001 Feb;24(2):273–83. - PubMed

Publication types