. 2017 Nov;23(11):1309-1318.
doi: 10.1038/nm.4422. Epub 2017 Oct 9.

Sympathetic neuron-associated macrophages contribute to obesity by importing and metabolizing norepinephrine

Affiliations

Sympathetic neuron-associated macrophages contribute to obesity by importing and metabolizing norepinephrine

Roksana M Pirzgalska et al. Nat Med. 2017 Nov.

Abstract

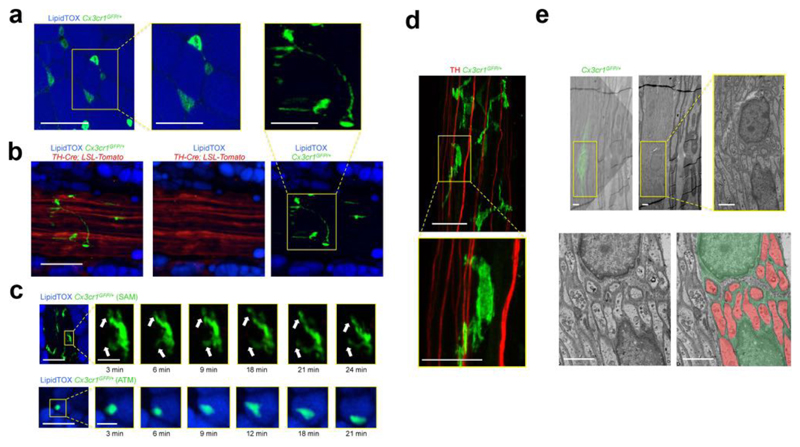
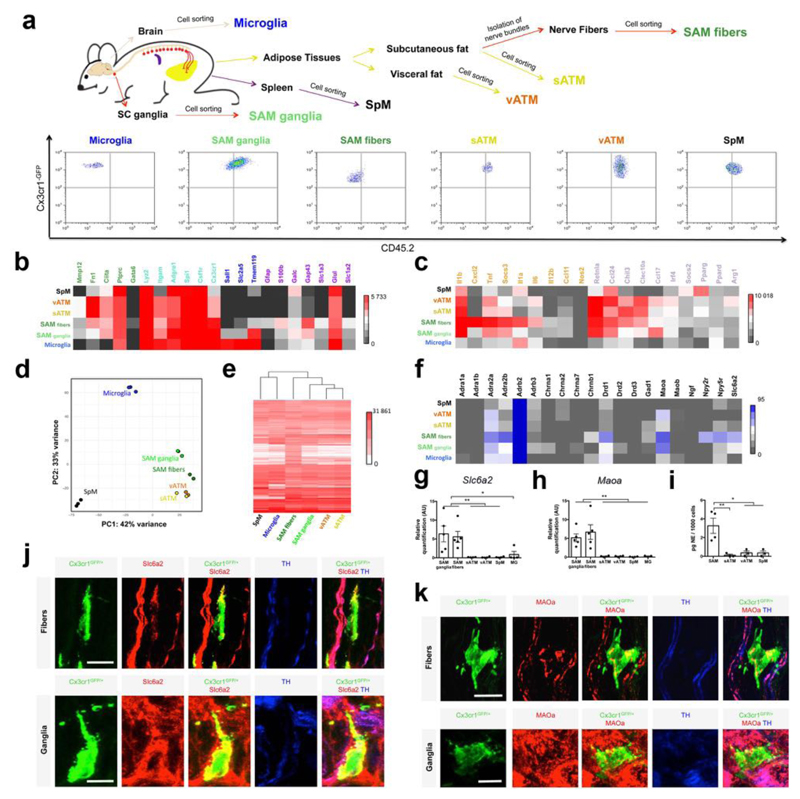
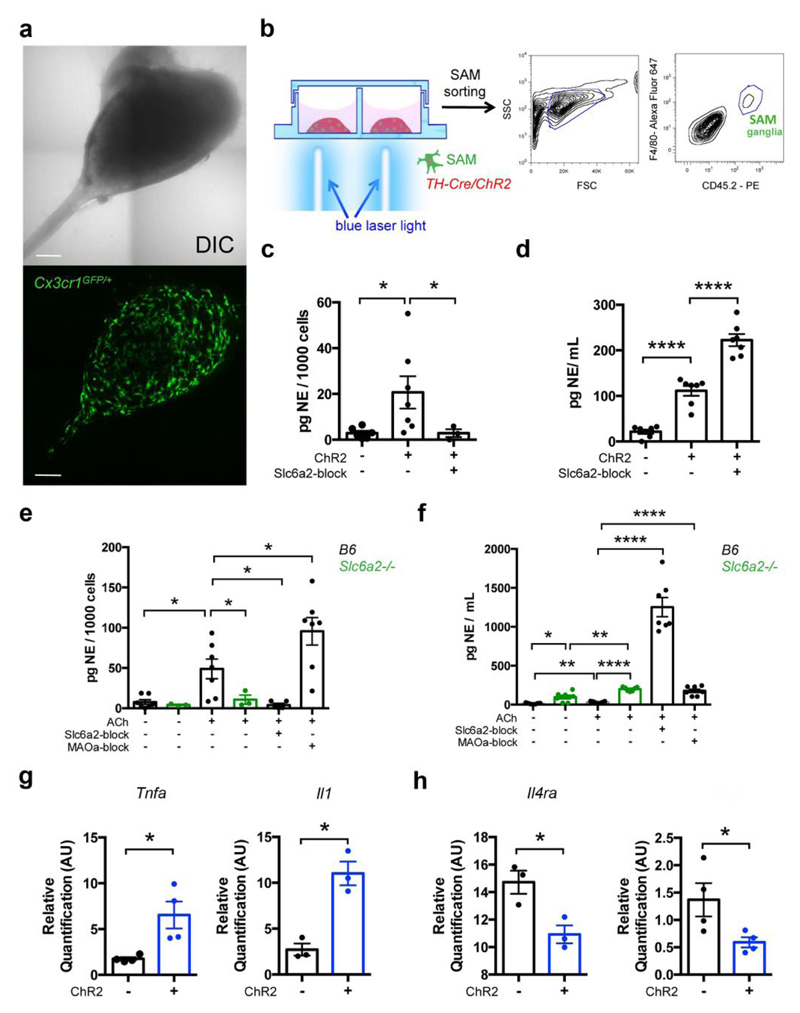
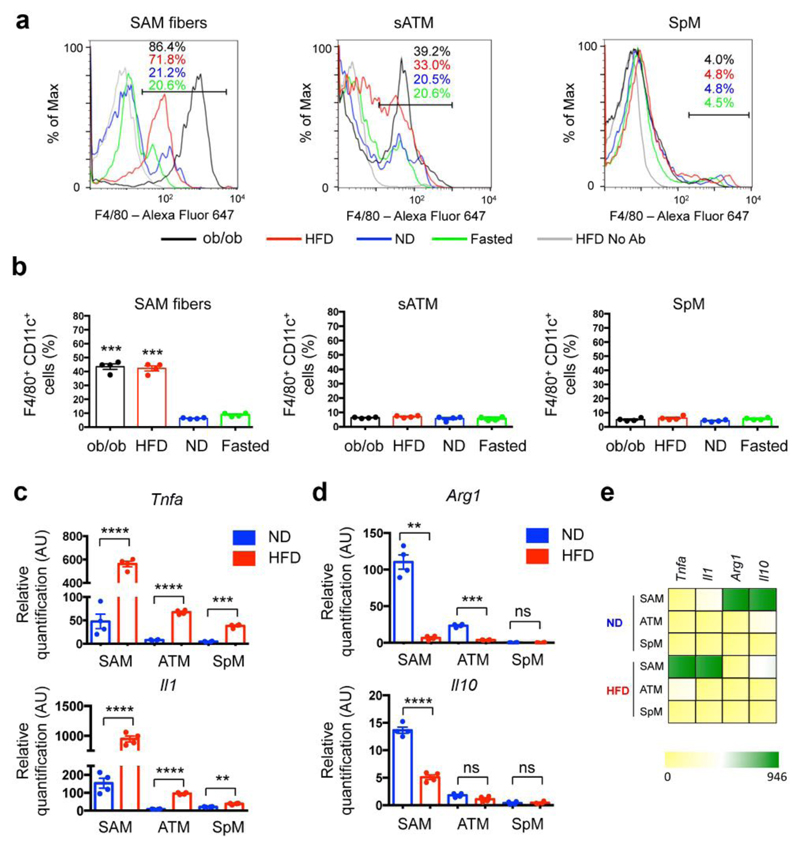
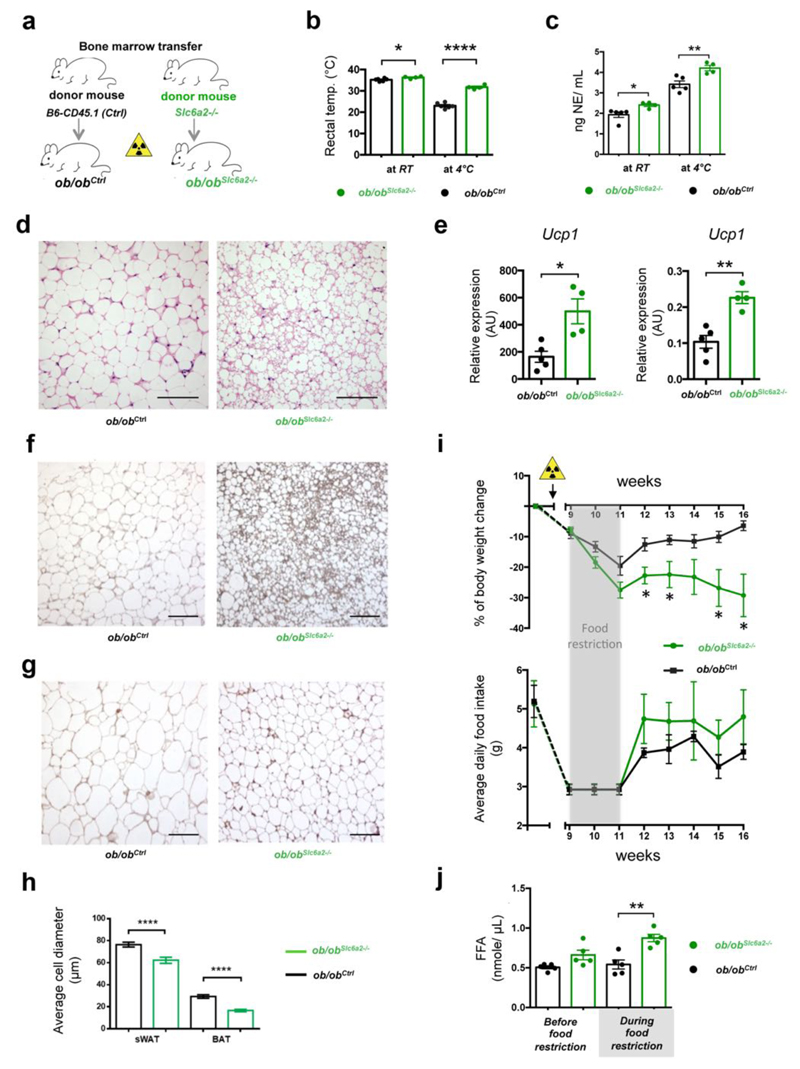
The cellular mechanism(s) linking macrophages to norepinephrine (NE)-mediated regulation of thermogenesis have been a topic of debate. Here we identify sympathetic neuron-associated macrophages (SAMs) as a population of cells that mediate clearance of NE via expression of solute carrier family 6 member 2 (SLC6A2), an NE transporter, and monoamine oxidase A (MAOA), a degradation enzyme. Optogenetic activation of the sympathetic nervous system (SNS) upregulates NE uptake by SAMs and shifts the SAM profile to a more proinflammatory state. NE uptake by SAMs is prevented by genetic deletion of Slc6a2 or inhibition of the encoded transporter. We also observed an increased proportion of SAMs in the SNS of two mouse models of obesity. Genetic ablation of Slc6a2 in SAMs increases brown adipose tissue (BAT) content, causes browning of white fat, increases thermogenesis, and leads to substantial and sustained weight loss in obese mice. We further show that this pathway is conserved, as human sympathetic ganglia also contain SAMs expressing the analogous molecular machinery for NE clearance, which thus constitutes a potential target for obesity treatment.


Conflict of interest statement

Competing Financial Intrests

The authors declare no competing financial interests.

Figures

Figure 1
Figure 1. Sympathetic neuron-associated Cx3cr1GFP/+ cells exhibit differentiated morphology for specific association with SNS neurons.
(a) Confocal images from white adipose tissue isolated from Cx3cr1GFP/+ mice and stained using lipid stain LipidTOX (blue) and anti-GFP (green) antibody. Images are representative of 5 similar experiments. (b) Confocal images of sympathetic nerve fibers in subcutaneous adipose tissue isolated from TH-Cre; LSL-Tomato (red) / Cx3cr1GFP/+ (green) mice and stained using lipid stain LipidTOX (blue). Images are representative of 3 similar experiments. Scale bars in a and b, 50 μm. Boxed regions in a and b represent higher magnification of the main micrographs - scale bars, 25 μm (c) Intra-vital multi-photon visualization of a neuro-adipose connection in the inguinal fat pad of a live Cx3cr1GFP/+ mouse; LipidTOX (blue) labels adipocytes. Images are depicting morphological features and cell dynamics of Cx3cr1GFP/+ cells associated with sympathetic nerve fibers (upper panels) and Cx3cr1GFP/+ cells in the parenchyma of subcutaneous fat (lower panels). Images are representative of 3 similar experiments. Scale bars, 50 μm. Boxed regions represent higher magnification of the main micrograph at time points indicated below micrographs – scale bars, 10 μm. (d) Confocal images from sympathetic nerve fibers isolated from inguinal fat pad of Cx3cr1GFP/+ mice and stained using anti-TH (red) and anti-GFP (green) antibodies. Images are representative of 5 similar experiments. Scale bar, 50 μm. Boxed region represents higher magnification of the main micrograph – scale bar, 25 μm. (e) Correlative confocal and transmission electron microscopy of the nerve fibers isolated from subcutaneous fat pad of Cx3cr1GFP/+ mice. Shown is an overlay of the Cx3cr1GFP/+ fluorescence (green) with the electron micrograph from the same section, (upper left with the lower left panel being a higher magnification), electron micrograph alone (upper middle with the yellow boxed region in the right panel being a higher magnification), and electron micrograph (lower left) with false color-coding of the same image highlighting Cx3cr1GFP/+ cells (green) and sympathetic nerves (red) (lower right). Images are representative of 2 similar experiments. Scale bars, 2 μm.
Figure 2
Figure 2. SAMs highly express macrophage-associated markers and possess the machinery for uptake and degradation of norepinephrine.
(a) Schematic representation (top) of tissue dissections and processing with macrophages isolated from the following tissues: brain, spleen, visceral fat, subcutaneous fat, sympathetic nerve fibers from subcutaneous fat, and sympathetic ganglia. Representative flow cytometry dot plots (bottom) indicating the CD45.2 status of macrophages from each tissue analyzed. (b) Heat map for genes associated with macrophage (green and cyan), microglia (blue and cyan) and glia (purple) profiles, determined by low-input RNA-seq. Values are Reads Per Kilobase of transcript per Million mapped reads (RPKM). (c) Heat map for pro-inflammatory (orange) and anti-inflammatory (purple) genes, determined by low-input RNA-seq. Values are RPKM. (d) Principal component (PC) analysis based on the top 500 most variable genes across SAM fibers (green), SAM ganglia (light green), vATM (orange), sATM (yellow), SpM (black) and microglia (blue). Each dot represents an independent experiment. (e) Heat map of transcripts (RPKM values) based on the top 5000 genes expressed by SAM fibers, determined by low-input RNA-seq. (f) Heat map of genes for neurotransmitter receptors, transporters and catalyzing enzymes. RPKM values are determined by low-input RNA-seq. Values in panels b,c,d,e and f represent 3 independent experiments (SpM, Microglia and SAM ganglia, n = 3) or 2 independent experiments (vATM, sATM and SAM fibers, n = 2). (g) Expression of mRNA for Slc6a2 determined by qRT-PCR presented normalized to Gapdh expression. Each data point represents tissues pooled from 10 mice. n = 5 experiments for SAM fibers and SAM ganglia, n = 4 experiments for SpM, vATM, sATM and Microglia (MG), *P < 0.05, **P < 0.01. (h) Expression of mRNA for Maoa determined by qRT-PCR normalized to Gapdh expression. Each data point represents tissues pooled from 10 mice. n = 5 experiments for SAM fibers and SAM ganglia, n = 4 experiments for SpM, vATM, sATM and n = 3 experiments for MG, **P < 0.01. (i) NE content in sorted CD45.2-PE, F4/80-Alexa Fluor 647-double-positive cells measured by NE ELISA. Number of cells used in NE assays were as followed: 858 ± 258 for SAMs (n = 4 experiments), and 1000 cells for sATM, vATM and SpM (n = 3 experiments), *P < 0.05, **P < 0.01. (j,k) Confocal images from sympathetic nerve fibers (upper panels) and superior cervical ganglia (lower panels) isolated from Cx3cr1GFP/+ mice and stained using anti-GFP (green), anti-Slc6a2 (j) or anti-MAOa (k) (red) and anti-TH (blue) antibodies. Images are representative of 2 experiments. Scale bars, 10 μm. Data in g, h and i were analyzed by one-way ANOVA followed by Tukey’s multiple comparison test. Data are shown as average ± SEM.
Figure 3
Figure 3. SAMs import and metabolize NE via Slc6a2 and MAOa, respectively, to regulate extracellular NE availability.
(a) Representative images of ex-vivo SCG explant cultures. The area of the sympathetic ganglia is represented using reflected light differential interference contrast (DIC) channel in the upper panel, and the Cx3cr1GFP/+ cells from the same explant culture are shown in the lower panel (GFP channel). Images are representative of 20 similar experiments. (b) Schematic representation (left) of optogenetic activation of sympathetic SCG explant culture followed by CD45.2-PE, F4/80-Alexa Fluor 647-double-positive cell sorting (right). (c) NE content in CD45.2-PE, F4/80-Alexa Fluor 647-double-positive cells isolated from SCG explant cultures from TH-Cre;LSL-ChR2-YFP and LSL-ChR2-YFP mice after optogenetic activation. Each data point represents tissues pooled from 6 mice. n = 3-7 experiments, *P < 0.05. The following number of cells were used in NE assays (run in duplicates): 189 ± 30 from TH-Cre;LSL-ChR2-YFP SCG (n = 7), 126 ± 21 from LSL-ChR2-YFP SCG (n = 6), and 159 ± 19 from TH-Cre;LSL-ChR2-YFP SCG stimulated with Slc6a2-blocker (n = 3). (d) Ex vivo NE release upon optogenetic stimulation of SCG explants isolated from TH-Cre;LSL-ChR2-YFP and LSL-ChR2-YFP mice. Each data point represents medium collected from one explant culture. n = 7 per group, ****P < 0.0001. (e) NE content in CD45.2, F4/80-double-positive cells isolated from SCG of either B6 or Slc6a2-/- mice and then incubated with ACh, an ACh and Slc6a2-blocker, an ACh and MAOa-blocker, or culture medium. Each data point represents tissues pooled from 6 mice. n = 3-7 experiments, *P < 0.05. The following number of cells were used in NE assays (run in duplicates): 364 ± 128 from B6 SCG (n = 7), 238 ± 55 from Slc6a2-/- SCG (n = 3), 216 ± 58 from B6 SCG incubated with ACh (n = 7), 201 ± 63 from Slc6a2-/- SCG incubated with ACh (n = 3), 196 ± 18 from B6 SCG incubated with ACh and Slc6a2-blocker (n = 5), 133 ± 11 from B6 SCG incubated with ACh and MAOa-blocker (n = 7). (f) Ex vivo NE release from SCG of either B6 or Slc6a2-/- mice after incubation with ACh, an ACh and Slc6a2-blocker, an ACh and MAOa-blocker or culture medium. Each data point represents medium collected from one explant culture. n = 7 per group, ****P < 0.0001, **P < 0.01. (g) Expression of mRNA by qRT-PCR and relative to Gapdh for pro-inflammatory genes (Tnfa and Il1) in CD45.2, F4/80-double-positive cells isolated from SCG explant cultures from TH-Cre;LSL-ChR2-YFP (blue) and LSL-ChR2-YFP (black) mice. Prior to cell sorting, SCG explants were optogenetically stimulated. n = 3-4 experiments, *P < 0.05 (for Tnfa, n = 4, P = 0.0467; for Il1, n = 3, P = 0.011). (h) Expression of mRNA by qRT-PCR and relative to Gapdh for anti-inflammatory genes (Il4ra and Arg1) in CD45.2, F4/80-double-positive cells isolated from SCG explant cultures from TH-Cre;LSL-ChR2-YFP (blue) and LSL-ChR2-YFP (black) mice. Prior to cell sorting, SCG explants were optogenetically stimulated. n = 3-4 experiments, *P < 0.05 (for Il4ra, n = 3, P = 0.0257; for Arg1, n = 4, P = 0.0497). Data in c, d, e, f, g, h were analyzed by two-tailed unpaired Student’s t-test and are shown as average ± SEM.
Figure 4
Figure 4. Obesity-induced accumulation of SAMs.
(a) Representative histograms showing percentages of F4/80-Alexa Fluor 647-positive cells in sympathetic nerve fibers (left panel), subcutaneous adipose tissue (middle panel) and spleen (right panel) in mice that were genetically obese (ob/ob; black), obese due to high fat diet (red), fed normal diet (blue) or food-deprived for 24 hours (green). CD45.2-PE-positive cells were gated. Histograms are representative of 4 independent experiments. (b) Percentages of F4/80-Alexa Fluor 647- and CD11c-FITC-double-positive cells in sympathetic nerve fibers (left panel), subcutaneous adipose tissue (middle panel) and spleen (right panel) in mice that were genetically obese (ob/ob; black), obese due to high fat diet (red), fed normal diet (blue) or food-deprived for 24 hours (green). CD45.2-PE-positive cells were gated. n = 4 experiments per group, ***P < 0.001. (c) Expression of mRNA determined by qRT-PCR and relative to Gapdh for pro-inflammatory genes (Tnfa and Il1) in CD45.2-PE, F4/80-Alexa Fluor 647-double-positive cells in sympathetic nerve fibers (SAM), subcutaneous adipose tissue (ATM) and spleen (SpM) isolated from mice that were fed either normal (blue) or high fat (red) diet. n = 4 experiments per group, ****P < 0.0001, ***P < 0.001, **P < 0.01. Each data point represents tissues pooled from 10 mice. (d) Expression of mRNA determined by qRT-PCR and relative to Gapdh for anti-inflammatory genes (Arg1 and Il10) in CD45.2-PE, F4/80-Alexa Fluor 647-double-positive cells in sympathetic nerve fibers (SAM), subcutaneous adipose tissue (ATM) and spleen (SpM) isolated from mice that were fed either normal (blue) or high fat (red) diet. n = 4 experiments per group, ****P < 0.0001, **P < 0.01. Each data point represents tissues pooled from 10 mice. (e) Heat map for pro- and anti-inflammatory genes determined by the qRT-PCR analyses in c,d. Data in b were analyzed by one-way ANOVA followed by Bonferroni multiple comparison test with ND as a control group. Data in c, d were analyzed by two-tailed unpaired Student’s t-test. Data are shown as average ± SEM.
Figure 5
Figure 5. Loss of function of Slc6a2 in SAMs rescues thermogenic capacities of ob/ob mice.
(a) Schematic representation of bone marrow transplant from either Slc6a2-/- or control B6 (CD45.1) mice into genetically obese ob/ob mice (ob/obSlc6a2-/- and ob/obCtrl chimeras, respectively). (b) Rectal temperature of ob/obCtrl (black) and ob/obSlc6a2-/- (green) chimeras was measured at RT and after 2 hours of cold challenge (4° C). Each data point represents one mouse. n = 4 mice for ob/obSlc6a2-/-, n = 6 mice for ob/obCtrl, *P = 0.025, ****P < 0.0001. (c) Serum NE levels of the ob/obCtrl (black) and ob/obSlc6a2-/- (green) chimeras were measured at RT and after 2 hours of cold exposure (4°C). Each data point represents one mouse. n = 4 mice per group for ob/obSlc6a2-/-, n = 5 mice per group for ob/obCtrl, *P = 0.022, **P = 0.0072. (d) Optical micrographs of BAT removed from ob/ob chimeras following 2 hours of cold challenge (4° C) and stained with H&E. Left panel represents BAT from ob/obCtrl and right panel shows BAT from the ob/obSlc6a2-/- chimeras. Images are representative of fat organs collected from 4 mice (ob/obCtrl) or 6 mice (ob/obSlc6a2-/-). (e) Expression of mRNA for Ucp1 determined by qRT-PCR and relative to Gapdh in BAT (left panel) and sWAT (right panel) dissected after 2 hours of cold (4° C) challenge. Ob/obCtrl chimeras are represented in black and ob/obSlc6a2-/- chimeras are shown in green. Each data point represents one mouse. n = 4 mice for ob/obSlc6a2-/-, n = 5 mice for ob/obCtrl, *P = 0.0269; **P = 0.0015. (f) Optical micrographs of BAT from ob/obCtrl (left) and ob/obSlc6a-/- (right) chimeras following 2 hours of cold (4° C) challenge and stained with anti-UCP1 antibody. Images are representative of fat organs collected from 4 mice (ob/obCtrl) or 6 mice (ob/obSlc6a2-/-). (g) Optical micrographs of sWAT from ob/obCtrl (left) and ob/ob SAMSlc6a2-/- (right chimeras removed from ob/ob chimeras following 2 hours of cold (4° C) challenge and stained with anti-UCP1 antibody. Images are representative of fat organs collected from 4 mice (ob/obCtrl) or 6 mice (ob/obSlc6a2-/-). (h) Average adipocyte diameter quantified from optical micrographs of sWAT and BAT from ob/ob chimeras following 2 hours of cold (4° C) challenge. Measurements are representative of 4 independent micrographs (4 ob/obSlc6a2-/- mice) or 6 micrographs (6 ob/obCtrl mice). 18-34 measurements were obtained per micrograph. n = 169 for ob/obCtrl sWAT, n = 120 for ob/obSlc6a2-/- sWAT, n = 180 for ob/obCtrl BAT, n = 120 for ob/obSlc6a2-/- BAT, ****P < 0.0001. (i) Body weight change (upper panel) and daily food intake (lower panel) of ob/obCtrl (n = 4 mice) and ob/obSlc6a2-/- (n = 6 mice) chimeras monitored for 7 weeks following 2 weeks of food intake normalization (3 gr/day – grey shade) that started 9 weeks after bone marrow transplant. Yellow triangle indicates when irradiation was performed. *P < 0.05. (j) Blood plasma non-esterified (free) fatty acid concentration in control ob/obCtrl and ob/obSlc6a2-/- chimeras measured 8 weeks after bone marrow transplant and during a 3 gr/day regimen. n = 5 mice per group, **P = 0.0022. Data in panels b, c, e, h, i were analyzed by two-tailed unpaired Student’s t-test and in panel i by multiple t-tests – Student’s t-test per row with correction for multiple comparisons using the Holm-Sidak method. Data are shown as average ± SEM. Scale bars in d, f and g, 100 μm.
Figure 6
Figure 6. SAMs in the human Sympathetic Nervous System.
(a,b) Optical micrographs of human ganglia from the thoracolumbar region stained with H&E. (b) Higher magnification of the micrograph in panel a. (c,d) Optical micrographs of human ganglia from the thoracolumbar region stained with an antibody against CD68. (d) Higher magnification of the micrograph in panel c. (e) Optical micrographs of human ganglia from the thoracolumbar region stained with an antibody against CD68 and Slc6a2. Red arrows, CD68- and Slc6a2- double positive regions. (f) Optical micrographs of human ganglia from the thoracolumbar region stained with an antibody against CD68 and MAOa. Red arrows, CD68- and MAOa- double positive regions. Boxed regions in panels e and f represent higher magnification of the main micrographs. Scale bars for a and c, 1 mm, for c and d, 100 μm, for e and f, 50 μm, for boxed regions 25 μm. Images in a-f are representative of 9 different human samples.

Comment in

References

    1. Zeng W, et al. Sympathetic Neuro-adipose Connections Mediate Leptin-Driven Lipolysis. Cell. 2015;163:84–94. - PMC - PubMed
    1. Mathis D. Immunological Goings-on in Visceral Adipose Tissue. Cell Metab. 2013;17:851–859. - PMC - PubMed
    1. Nguyen KD, et al. Alternatively activated macrophages produce catecholamines to sustain adaptive thermogenesis. Nature. 2011;480:104–108. - PMC - PubMed
    1. Fischer K, et al. Alternatively activated macrophages do not synthesize catecholamines or contribute to adipose tissue adaptive thermogenesis. Nat Med. 2017;23:623–630. - PMC - PubMed
    1. Spadaro O, et al. IGF1 Shapes Macrophage Activation in Response to Immunometabolic Challenge. Cell Rep. 2017;19:225–234. - PMC - PubMed

Substances