. 2017 Oct 16:6:e25884.
doi: 10.7554/eLife.25884.

Subterranean mammals show convergent regression in ocular genes and enhancers, along with adaptation to tunneling

Affiliations

Subterranean mammals show convergent regression in ocular genes and enhancers, along with adaptation to tunneling

Raghavendran Partha et al. Elife. .

Abstract

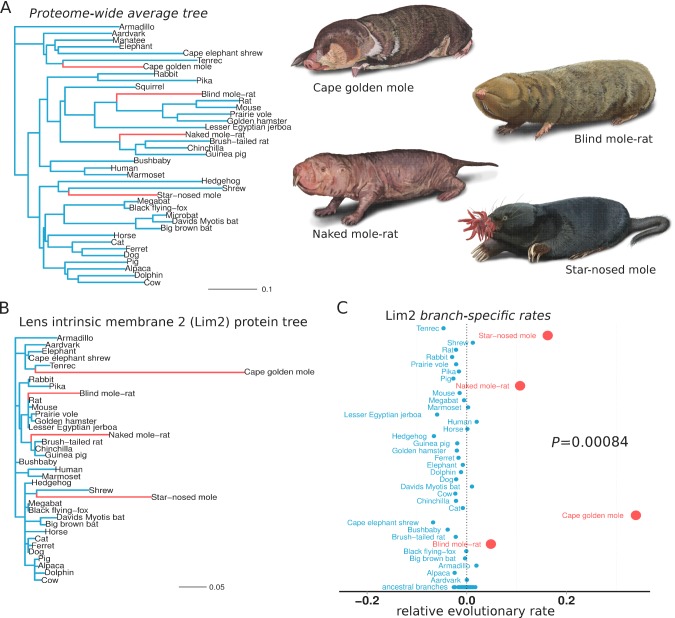
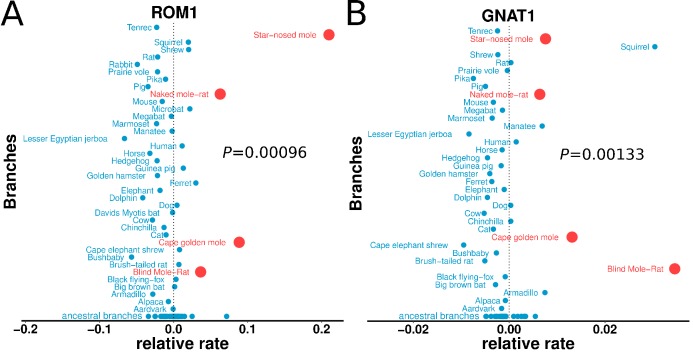
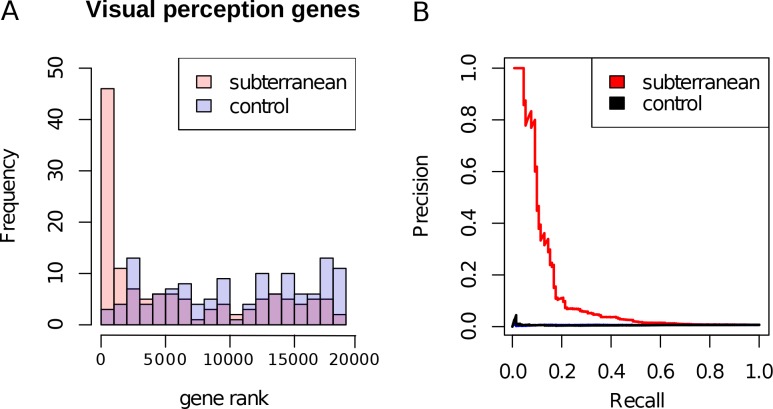
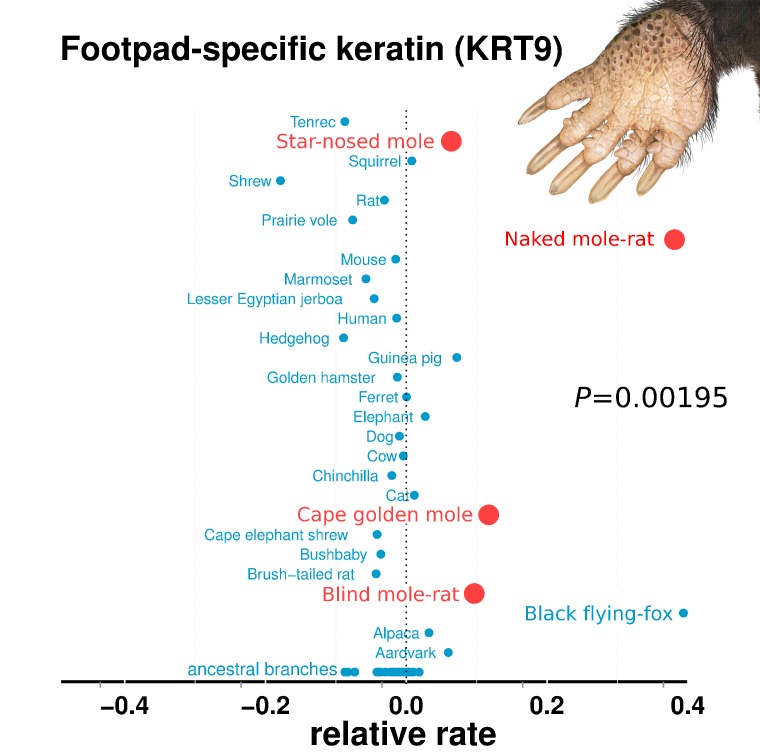
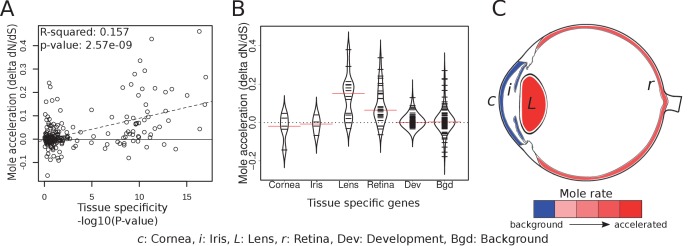
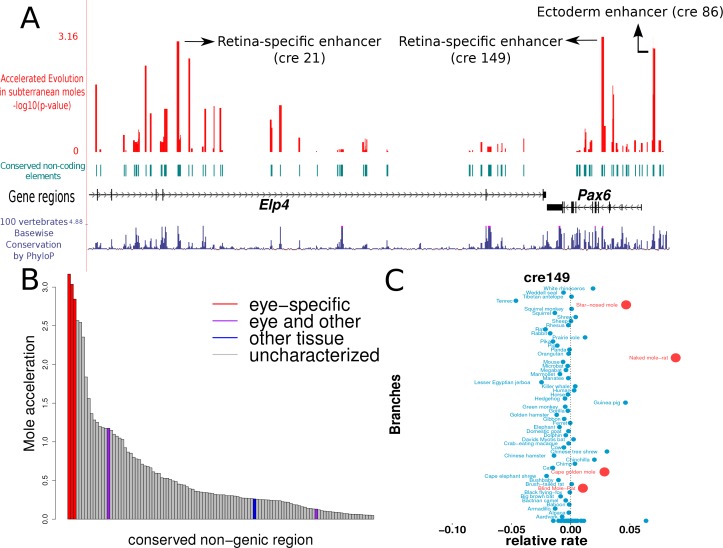
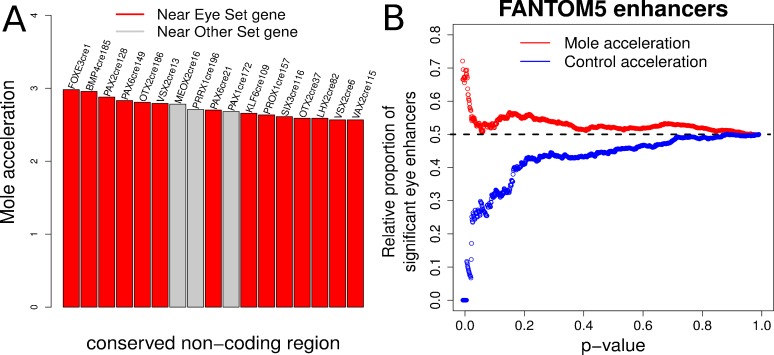
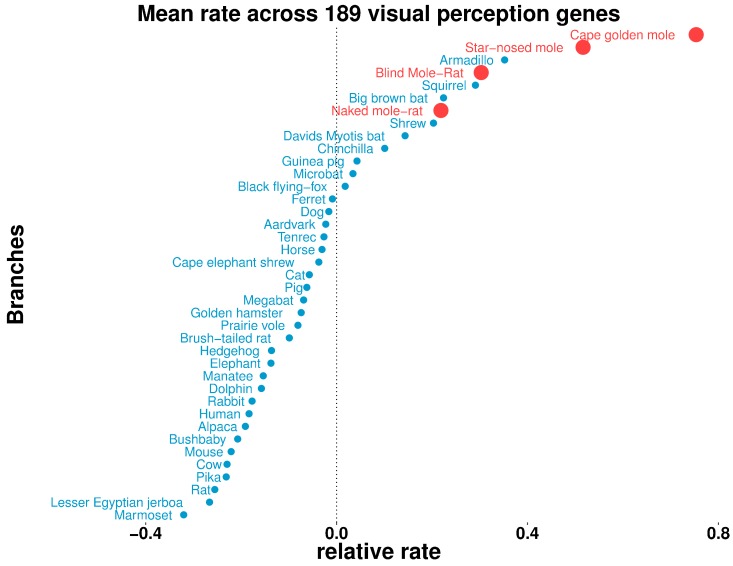
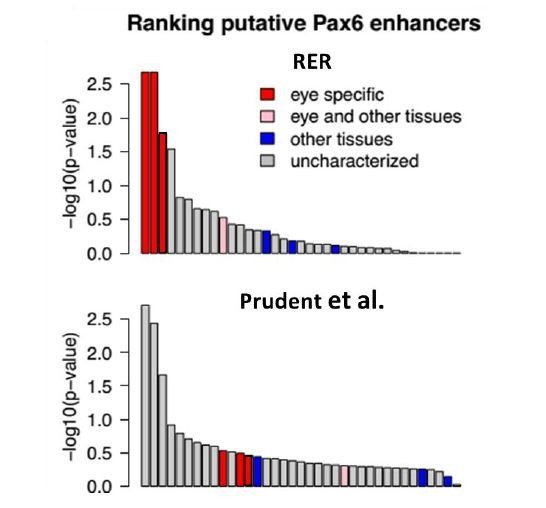
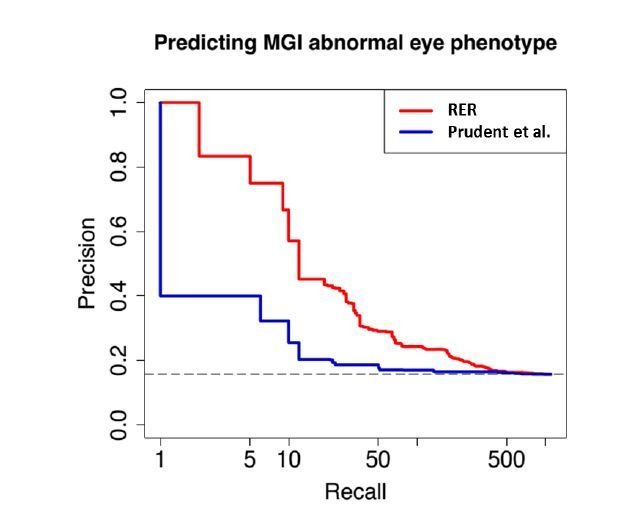
The underground environment imposes unique demands on life that have led subterranean species to evolve specialized traits, many of which evolved convergently. We studied convergence in evolutionary rate in subterranean mammals in order to associate phenotypic evolution with specific genetic regions. We identified a strong excess of vision- and skin-related genes that changed at accelerated rates in the subterranean environment due to relaxed constraint and adaptive evolution. We also demonstrate that ocular-specific transcriptional enhancers were convergently accelerated, whereas enhancers active outside the eye were not. Furthermore, several uncharacterized genes and regulatory sequences demonstrated convergence and thus constitute novel candidate sequences for congenital ocular disorders. The strong evidence of convergence in these species indicates that evolution in this environment is recurrent and predictable and can be used to gain insights into phenotype-genotype relationships.

Keywords: convergent evolution; evolutionary biology; functional constraint; genetics of vision; genomics; none; regressive evolution; relaxation of constraint; subterranean life.


Conflict of interest statement

No competing interests declared.

Figures

Figure 1.
Figure 1.. Lens intrinsic membrane protein 2 (LIM2) evolutionary rates across species.
(A) Mammalian transitions to a subterranean environment occurred in four lineages shown in red. The branch lengths on the mammalian tree reflect the average evolutionary rate across 18,980 protein-coding genes. (B) LIM2 protein-coding sequence shows accelerated rates of evolution on subterranean branches compared to those on the proteome-wide average tree. (C) Relative evolutionary rates of LIM2 showed the strongest acceleration on the subterranean branches amongst all of the genes studied. Illustrations by Michelle Leveille (Artifact Graphics).
Figure 2.
Figure 2.. Relative evolutionary rates of two retinal proteins across species.
Relative evolutionary rates of two retinal proteins, (A) Retinal outer segment membrane protein 1 (ROM1) and (B) Rod cell-specific G protein, subunit alpha (GNAT1), show strong acceleration in the subterranean mammals (marked in red).
Figure 3.
Figure 3.. Enrichment of visual perception genes.
(A) Histogram of the rankings of 189 visual perception genes based on their mole-acceleration. We see a clear enrichment of the genes with low rank numbers, reflecting the strong signal of mole-acceleration in visual perception genes. As a control, we use four non-subterranean species, and as expected, genes involved in vision do not show convergent rate acceleration. (B) Mole-acceleration can equivalently serve as a predictor for function in visual perception. The plot shows the Precision-Recall values at varying p-value thresholds reflecting the fraction of visual perception genes significant at a particular threshold (Precision) and the fraction of visual perception genes retrieved at the same threshold (Recall). We see that mole-acceleration specifically identifies visual perception genes with high precision when compared to acceleration in two sets of four non-subterranean control species.
Figure 4.
Figure 4.. Relative rates of footpad-specific keratin 9 (KRT9).
KRT9 shows strong acceleration on the subterranean branches. The image shown is the footpad of the star-nosed mole, showing characteristic hyperkeratosis. Keratin 9 mutations also lead to hyperkeratosis in mouse models and humans. Illustrations by Michelle Leveille (Artifact Graphics).
Figure 5.
Figure 5.. Tissue-specific retinal and lens genes are highly accelerated in subterranean species.
(A) Ocular genes that are more tissue-specific exhibit stronger acceleration in subterranean ‘mole’ species. The y-axis represents the change in the rate of evolution on branches shifting to a subterranean environment. (B) Panels of tissue-specific genes were tested for their relative accelerations in the subterranean mammals. One hundred randomly chosen ‘background’ genes were not faster or slower on average, and provide an estimate of the variance expected for random genes. Retina- and lens-specific genes show many cases of acceleration in the subterranean environment, and their distributions are significantly elevated when compared to background (p=1.4×10⁻⁵ and 3.2 × 10⁻⁴, respectively). (C) Representation of average mole-acceleration for genes specifically expressed in four different tissues of the eye.
Figure 6.
Figure 6.. Mole-acceleration of eye-specific enhancers in the Pax6 gene region.
(A) Genomic region spanning Pax6 and its neighbor Elp4. The exons and introns of the two genes are represented by black blocks and lines respectively, whereas the conserved non-coding regions analyzed are represented in light blue. The conservation signal as given by the 100 vertebrates Basewise Conservation is shown in dark blue. The mole-acceleration scores for these regions are represented in red. The three most accelerated non-coding regions identified in this analysis are consistent with the eye-specific enhancers regulating Pax6 expression in the eye. (B) The mole-acceleration scores for the three eye-specific enhancers of Pax6 are the highest among 150 regions analyzed, including enhancers of other tissues and uncharacterized non-coding regions. (C) The relative rates in each species for the most accelerated region ‘cre149’.
Figure 7.
Figure 7.. Evidence of mole-acceleration in candidate eye-specific enhancers.
(A) Enrichment of mole-accelerated elements near eye developmental transcription factor genes. The bar plot shows the 17 mole-accelerated conserved non-coding elements identified. Fourteen of the 17 elements are present near transcription factor genes in the Eye set, denoted in red. (B) FANTOM5 Eye enhancers show strong mole-acceleration. The plot shows the relative proportion of FANTOM5 eye enhancers identified among all enhancers significant at the corresponding p-value threshold. We see a strong enrichment of eye enhancers identified at low mole-acceleration p-values (red points) whereas no such enrichment is observed using control-species-acceleration p-values (blue points).
Figure 8.
Figure 8.. Some aboveground species show accelerated rates of evolutionary change in visual perception genes.
On the basis of the relative evolutionary rates across all species for 189 genes with the GO term annotation ‘visual perception’, we calculated the species-wise mean relative rate across of the genes. Our previous observations of mole-acceleration in visual perception genes are recapitulated here – the four subterranean mammals are among the species that show an accelerated rate across these genes. Interestingly, we find other non-subterranean species showing acceleration comparable to the subterranean mammals, indicating adaptations in visual systems.
Author response image 1.
Author response image 2.

References

    1. Albert EM, Zardoya R, García-París M. Phylogeographical and speciation patterns in subterranean worm lizards of the genus Blanus (Amphisbaenia: Blanidae) Molecular Ecology. 2007;16:1519–1531. doi: 10.1111/j.1365-294X.2007.03248.x. - DOI - PubMed
    1. Andersen DC. Below-ground herbivory in natural communities: A review emphasizing fossorial animals. The Quarterly Review of Biology. 1987;62:261–286. doi: 10.1086/415512. - DOI
    1. Andersson R, Gebhard C, Miguel-Escalada I, Hoof I, Bornholdt J, Boyd M, Chen Y, Zhao X, Schmidl C, Suzuki T, Ntini E, Arner E, Valen E, Li K, Schwarzfischer L, Glatz D, Raithel J, Lilje B, Rapin N, Bagger FO, Jørgensen M, Andersen PR, Bertin N, Rackham O, Burroughs AM, Baillie JK, Ishizu Y, Shimizu Y, Furuhata E, Maeda S, Negishi Y, Mungall CJ, Meehan TF, Lassmann T, Itoh M, Kawaji H, Kondo N, Kawai J, Lennartsson A, Daub CO, Heutink P, Hume DA, Jensen TH, Suzuki H, Hayashizaki Y, Müller F, Forrest ARR, Carninci P, Rehli M, Sandelin A. An atlas of active enhancers across human cell types and tissues. Nature. 2014;507:455–461. doi: 10.1038/nature12787. - DOI - PMC - PubMed
    1. Ar A, Arieli R, Shkolnik A. Blood-gas properties and function in the fossorial mole rat under normal and hypoxic-hypercapnic atmospheric conditions. Respiration Physiology. 1977;30:201–218. doi: 10.1016/0034-5687(77)90031-7. - DOI - PubMed
    1. Kent WJ, Sugnet CW, Furey TS, Roskin KM, Pringle TH, Zahler AM, Haussler D. The human genome browser at UCSC. Genome Research. 2002;12:996–1006. doi: 10.1101/gr.229102. - DOI - PMC - PubMed

Publication types