. 2018 Jan 1;34(1):134-136.
doi: 10.1093/bioinformatics/btx437.

Irys Extract

Affiliations

Irys Extract

Rani Arielly et al. Bioinformatics. .

Abstract

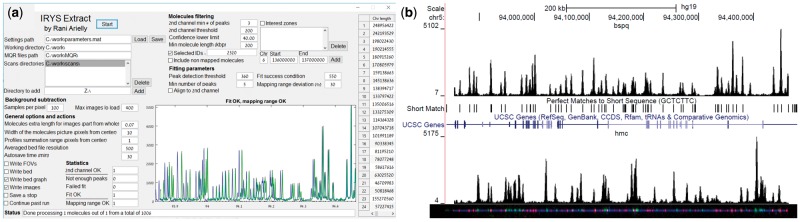
Summary: Irys Extract is a software tool for generating genomic information from data collected by the BioNano Genomics Irys platform. The tool allows the user easy access to the raw data in the form of cropped images and genetically aligned intensity profiles. The latter are also made compatible with the BED format for using with popular genomic browsers such as the UCSC Genome Browser.

Availability and implementation: Irys Extract has been developed in Matlab R2015a, it was tested to work with IrysView 2.4.0.15879 and AutoDetect 2.1.4.9159, and it currently runs under Microsoft Windows operating systems (7-10). Irys Extract can be downloaded alongside its manual and a demo dataset at http://www.nanobiophotonix.com and https://sites.google.com/site/raniarielly/.

Contact: uv@post.tau.ac.il.

Supplementary information: Supplementary data are available at Bioinformatics online.


Figures

Fig. 1
Fig. 1
The graphical user interface (GUI) of Irys Extract and its typical output. (a) The GUI is divided into several areas: directories, molecule filtering, fitting parameters, background subtraction, general options and actions, statistics, chromosomes lengths, status bar and intensity graph. The specific function of each item is described in the online manual (please see the Availability and Implementation section). (b) Bottom: Image of a molecule dyed with YOYO-1 (blue) and marked with sequence specific TAMRA dye labelling using the nicking enzyme Nt.BspQI for the GCTCTTC recognition sequence (red fluorescence spots), and with Dibenzylcyclooctyne-Sulfo-Cy5 fluorescent labeling of Azide-tagged 5-Hydroxymethylcytosine (green fluorescence spots). Top: screen capture from the University of California at Santa Cruz Genome Browser (Kent et al., 2002) (http://genome.ucsc.edu). The screenshot contains intensity profiles for the genetic red (top) and epigenetic green (bottom) channels in the molecule image below. The green signal was stretched according to the Irys data in order to best fit the data of the red channel to the known locations of the GCTCTTC sequence in the genome assembly hg19, Feb 2009 (shown as a track of black tags in the middle of the screen capture). Local genes are indicated in the blue UCSC gene track, showing the advantage of this single molecule method for correlation with published genomic features in terms of required length scale of the data. The top of the image shows the chromosome and position to which the molecule was mapped onto

References

    1. Amini F. et al. (2014) Mapping the ‘Dark Matter’ of Genome – Long Repeats and Complex SVs Leading To True Contiguity of De Novo Assembly with NanoChannel Technology Copy Number Profiles in Cancer Samples. Human Genome Variation, Belfast, Ireland.
    1. Austin M.D. et al. (2011) Single-molecule rapid imaging of linear genomes in nanochannel array. MRS Proc., 1346, mrss11-1346-aa10-02.
    1. Das S.K. et al. (2010) Single molecule linear analysis of DNA in nano-channel labeled with sequence specific fluorescent probes. Nucleic Acids Res., 38, e177.. - PMC - PubMed
    1. Grunwald A. et al. (2015) Bacteriophage strain typing by rapid single molecule analysis. Nucleic Acids Res., 43, e117.. - PMC - PubMed
    1. Hung J.-H., Weng Z. (2016) Data formats in bioinformatics. Cold Spring Harb. Protoc., 2016, pdb.top093211. - PubMed