. 2017 Nov 15;33(22):3567-3574.
doi: 10.1093/bioinformatics/btx442.

Prediction and modeling of pre-analytical sampling errors as a strategy to improve plasma NMR metabolomics data

Affiliations

Prediction and modeling of pre-analytical sampling errors as a strategy to improve plasma NMR metabolomics data

Carl Brunius et al. Bioinformatics. .

Abstract

Motivation: Biobanks are important infrastructures for life science research. Optimal sample handling regarding e.g. collection and processing of biological samples is highly complex, with many variables that could alter sample integrity and even more complex when considering multiple study centers or using legacy samples with limited documentation on sample management. Novel means to understand and take into account such variability would enable high-quality research on archived samples.

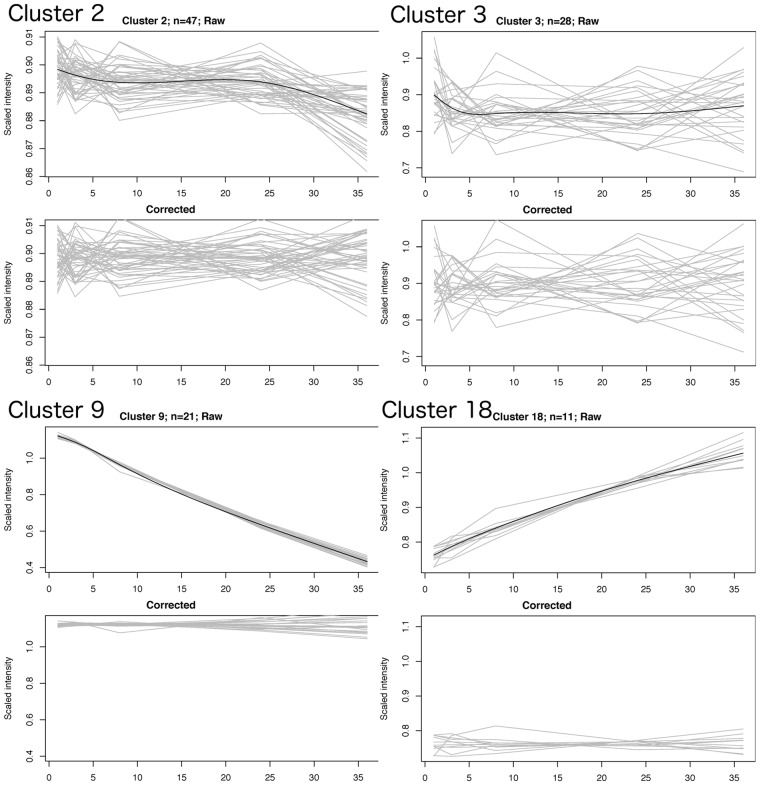
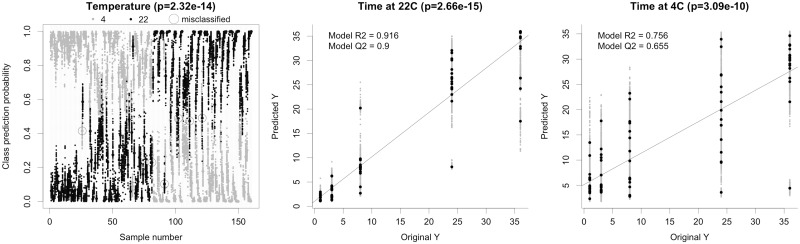
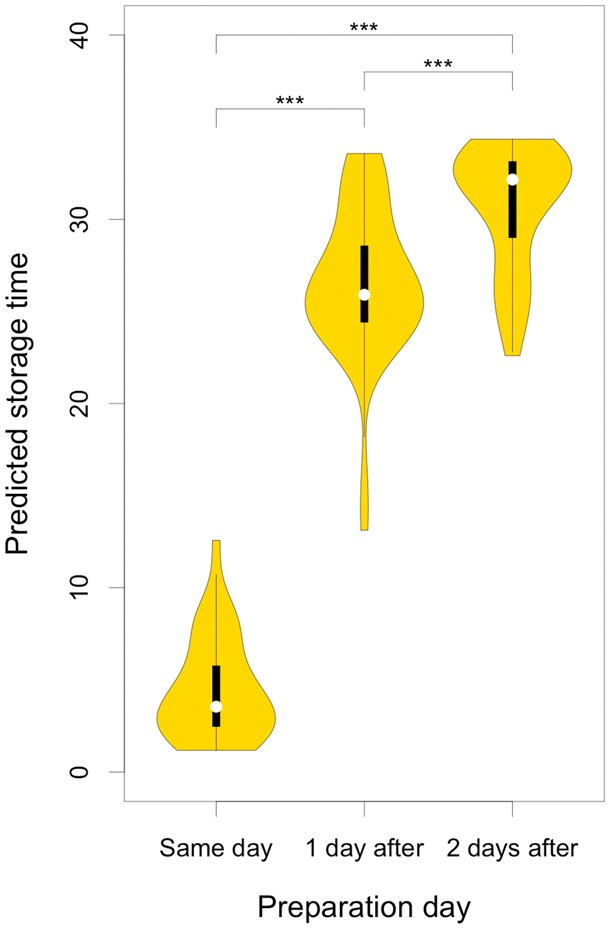
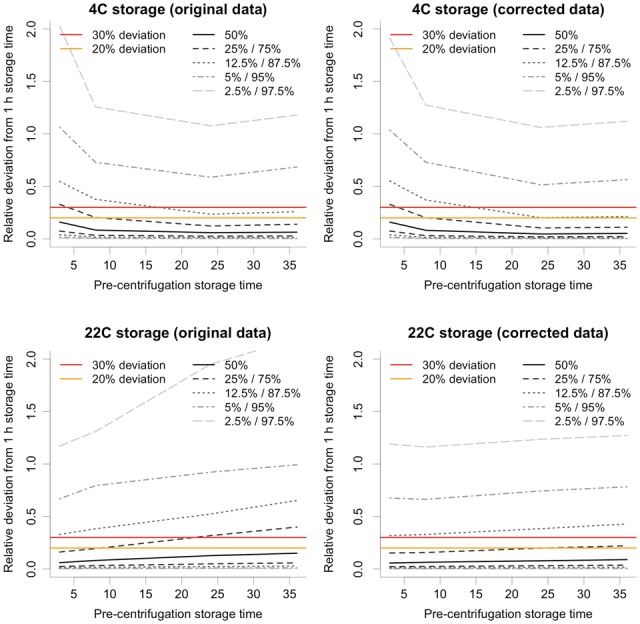
Results: This study investigated whether pre-analytical sample variability could be predicted and reduced by modeling alterations in the plasma metabolome, measured by NMR, as a function of pre-centrifugation conditions (1-36 h pre-centrifugation delay time at 4 °C and 22 °C) in 16 individuals. Pre-centrifugation temperature and delay times were predicted using random forest modeling and performance was validated on independent samples. Alterations in the metabolome were modeled at each temperature using a cluster-based approach, revealing reproducible effects of delay time on energy metabolism intermediates at both temperatures, but more pronounced at 22 °C. Moreover, pre-centrifugation delay at 4 °C resulted in large, specific variability at 3 h, predominantly of lipids. Pre-analytical sample handling error correction resulted in significant improvement of data quality, particularly at 22 °C. This approach offers the possibility to predict pre-centrifugation delay temperature and time in biobanked samples before use in costly downstream applications. Moreover, the results suggest potential to decrease the impact of undesired, delay-induced variability. However, these findings need to be validated in multiple, large sample sets and with analytical techniques covering a wider range of the metabolome, such as LC-MS.

Availability and implementation: The sampleDrift R package is available at https://gitlab.com/CarlBrunius/sampleDrift.

Contact: carl.brunius@chalmers.se.

Supplementary information: Supplementary data are available at Bioinformatics online.


Figures

Fig. 1.
Fig. 1.
Drift modeling of four clusters with different drift patterns from 22 °C data (Table 1). The two upper graphs represent clusters with small to minimal drift during pre-centrifugation delay time with either significant (left) or non-significant (right) improvement of feature CV after correction. The two lower graphs represent clusters with either decreased (left) or increased (right) feature intensity with increased pre-centrifugation time and significant CV improvement after correction. For each cluster, the upper graph shows the cluster-averaged scaled feature intensities in grey and the cluster drift function in black. The lower half shows the same features in the same y-scale after application of cluster-based drift correction
Fig. 2.
Fig. 2.
Cross-validated prediction of pre-centrifugation temperature (left) and pre-centrifugation time at 22 °C (center) or 4 °C (right). The pre-centrifugation temperature modeling correctly predicted 96% of samples as either stored at 4 °C (black) or 22 °C (grey). In pre-centrifugation time modeling, predicted times (y-axes) were strongly associated with actual times (x-axes). Predictions were better for pre-centrifugation time modeling at 22 °C, which reflected the larger effects on the metabolome at higher temperatures. All models were highly significant (P from permutation analysis; Supplementary Fig. S2)
Fig. 3.
Fig. 3.
Predicted pre-centrifugation time at 22 °C for external validation samples (n = 111). Samples were prepared on either the same day as sampling, the next day, or the day after that. Predicted pre-centrifugation times were significantly different between levels (P < 2.2e-16). All pair-wise comparisons were significant after Tukey adjustment (P < 0.001)
Fig. 4.
Fig. 4.
Effects of pre-centrifugation time on metabolite feature stability. The upper graphs show the effects of pre-centrifugation delay time at 4 °C as relative deviation of metabolite feature intensities compared with the reference level (at 1 h) for original data (left) and after data correction based on metadata information (right). Isobaric lines correspond to percentiles in the distribution of relative differences of 7648 measurements (16 samples × 478 features). The lower graphs show corresponding effects of pre-centrifugation delay time at 22 °C. The two horizontal lines correspond to 20% (lower line) and 30% (higher line) absolute deviation in feature intensity from the 1 h reference state

References

    1. Almqvist C. et al. (2011) LifeGene—a large prospective population-based study of global relevance. Eur. J. Epidemiol., 26, 67–77. - PMC - PubMed
    1. Anton G. et al. (2015) Pre-analytical sample quality: metabolite ratios as an intrinsic marker for prolonged room temperature exposure of serum samples. PLoS One, 10, e0121495.. - PMC - PubMed
    1. Bernini P. et al. (2011) Standard operating procedures for pre-analytical handling of blood and urine for metabolomic studies and biobanks. J. Biomol. NMR, 49, 231–243. - PubMed
    1. Breier M. et al. (2014) Targeted metabolomics identifies reliable and stable metabolites in human serum and plasma samples. PLoS One, 9, e89728.. - PMC - PubMed
    1. Brunius C. et al. (2016) Large-scale untargeted LC-MS metabolomics data correction using between-batch feature alignment and cluster-based within-batch signal intensity drift correction. Metabolomics, 12, 173.. - PMC - PubMed