EELS at very high energy losses
- PMID: 29036593
- PMCID: PMC6025225
- DOI: 10.1093/jmicro/dfx036
EELS at very high energy losses
Abstract
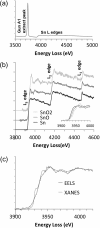
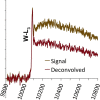
Electron energy-loss spectroscopy (EELS) has been investigated in the range from 2 to >10 keV using an optimized optical coupling of the microscope to the spectrometer to improve the high loss performance in EELS. It is found that excellent quality data can now be acquired up until about 5 keV, suitable for both energy loss near edge structure (ELNES) studies of oxidation and local chemistry, and potentially useful for extended energy loss fine structure (EXELFS) studies of local atomic ordering. Examples studied included oxidation in Zr, Mo and Sn, and the ELNES and EXELFS of the Ti-K edge. It is also shown that good quality electron energy-loss spectroscopy can even be performed for losses above 9.2 keV, the energy loss at which the collection angle becomes 'infinite', and this is demonstrated using the tungsten L3 edge at about 10.2 keV.
Figures


References
-
- Brown L M. (1997) A synchrotron in a microscope In: Rodenburg J M (ed.). Electron Microscopy and Analysis 1997: pp. 17–22 (IOP Publishing Ltd, Bristol: ).
-
- Hug G, Blanche G, Jaouen M, Flank A M, and Rehr J J (1995) Simulation of the extended fine-structure of K-shell edges in intermetallic ordered alloys. Ultramicroscopy 59: 121–136.
-
- Vlachos D, Craven A J, and McComb D W (2001) The influence of dopant concentration on the oxygen K-edge ELNES and XANES in yttria-stabilized zirconia. J. Phys. Condens. Mat. 13: 10799–10809.
-
- Ahn C C, and Krivanek O L (1983) EELS Atlas - A Reference Guide of Electron Energy Loss Spectra Covering All Stable Elements, (ASU HREM Facility & Gatan Inc., Warrendale, PA: ).
-
- Bach D, Schneider R, Gerthsen D, Verbeeck J, and Sigle W (2009) EELS of niobium and stoichiometric niobium-oxide phases-part I: plasmon and near-edges fine structure. Microsc. Microanal. 15: 505–523. - PubMed
LinkOut - more resources
Full Text Sources
Other Literature Sources

