. 2017 Nov 16;45(20):11594-11606.
doi: 10.1093/nar/gkx883.

N6-adenine DNA methylation is associated with the linker DNA of H2A.Z-containing well-positioned nucleosomes in Pol II-transcribed genes in Tetrahymena

Affiliations

N6-adenine DNA methylation is associated with the linker DNA of H2A.Z-containing well-positioned nucleosomes in Pol II-transcribed genes in Tetrahymena

Yuanyuan Wang et al. Nucleic Acids Res. .

Abstract

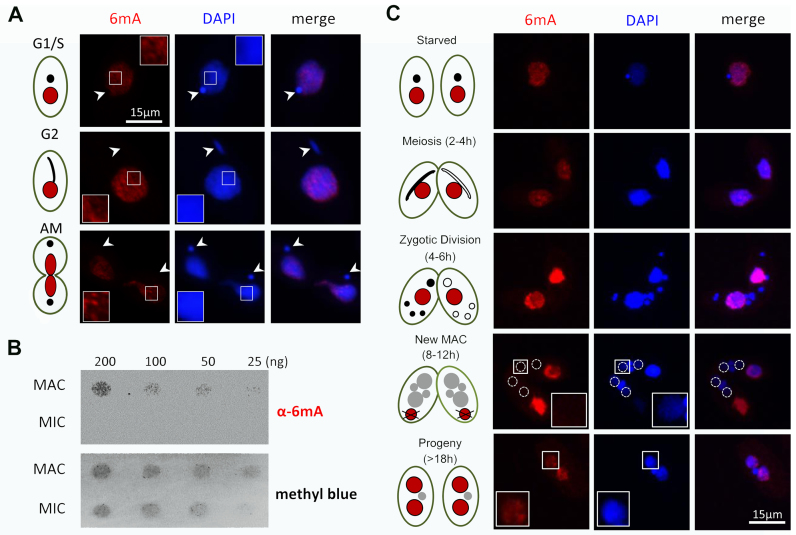
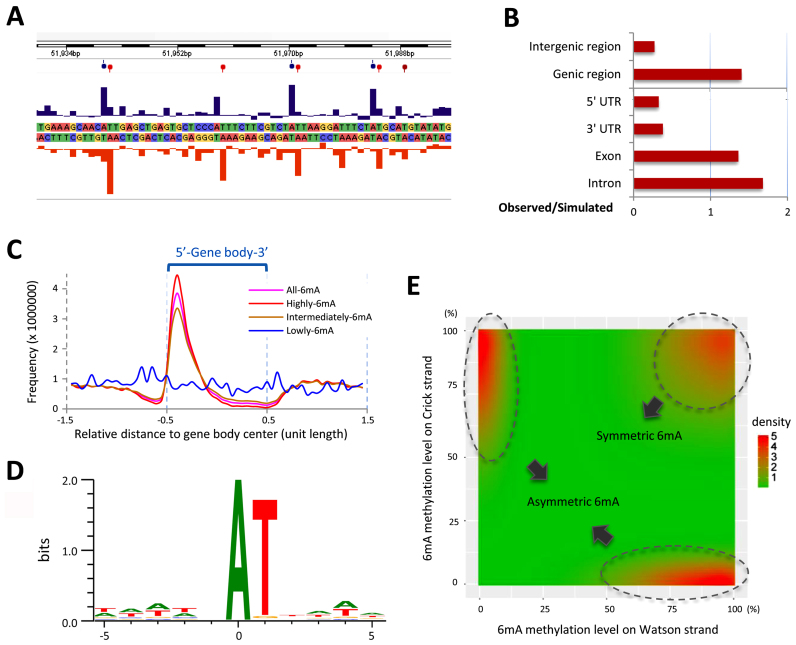
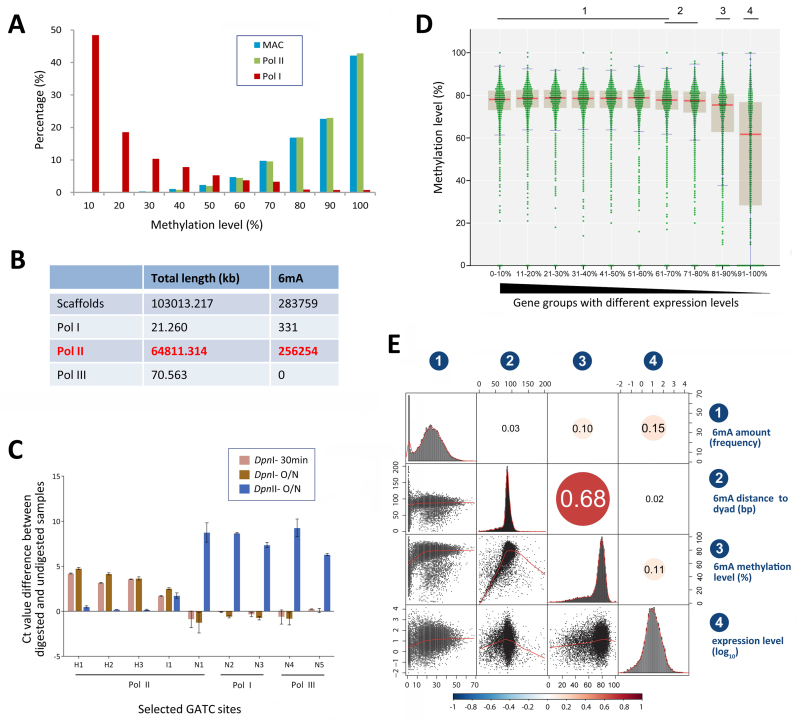
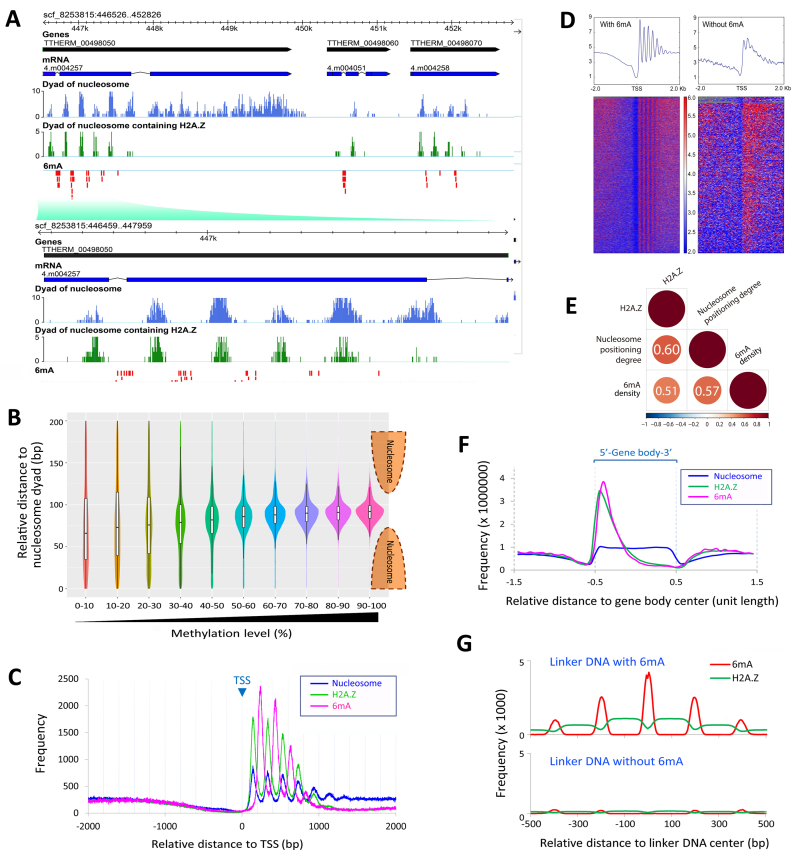
DNA N6-methyladenine (6mA) is newly rediscovered as a potential epigenetic mark across a more diverse range of eukaryotes than previously realized. As a unicellular model organism, Tetrahymena thermophila is among the first eukaryotes reported to contain 6mA modification. However, lack of comprehensive information about 6mA distribution hinders further investigations into its function and regulatory mechanism. In this study, we provide the first genome-wide, base pair-resolution map of 6mA in Tetrahymena by applying single-molecule real-time (SMRT) sequencing. We provide evidence that 6mA occurs mostly in the AT motif of the linker DNA regions. More strikingly, these linker DNA regions with 6mA are usually flanked by well-positioned nucleosomes and/or H2A.Z-containing nucleosomes. We also find that 6mA is exclusively associated with RNA polymerase II (Pol II)-transcribed genes, but is not an unambiguous mark for active transcription. These results support that 6mA is an integral part of the chromatin landscape shaped by adenosine triphosphate (ATP)-dependent chromatin remodeling and transcription.


Figures

Figure 1.
Figure 1.
Cellular distribution of 6mA in Tetrahymena. (A) 6mA occurs in vegetative cells with no obvious cell-cycle difference, shown by immunofluorescence staining with the modification-specific antibody. Note the absence of 6mA signal in MIC (arrowheads). Bar = 15 μm. (B) Differential distribution of 6mA in MAC and MIC, revealed by dot blot analysis using a specific anti-6mA antibody. Methylene blue hydrate staining was performed to determine the amount of loaded DNA. (C) 6mA occurs de novo in the newly developed MAC during conjugation. Cell stages are distinguished by nuclear events during conjugation. In the early phase of conjugation (starved, meiosis and zygotic), 6mA only exists in the parental MAC. Along with degradation of the old MAC, 6mA signal gradually builds up in the new MAC (dotted line circles). Bar = 15 μm.
Figure 2.
Figure 2.
Genomic distribution of 6mA in Tetrahymena. (A) Representative interpulse duration (IPD) ratios of SMRT sequencing data of vegetative Tetrahymena cells (SB210). Columns indicate the IPD peaks and balloons indicate the detected 6mA signals on both the sense (blue) and antisense (red) strands based on the IPD ratio. (B) Comparison of observed versus simulated distributions of 6mA in the different regions of the Tetrahymena genome indicates that 6mA is enriched in genic regions, including exons and introns. See Supplementary Table S1D for details. (C) 6mA sites with different degrees of methylation have different distributions in the gene body (bin = 5% of gene body length). The gene body is scaled to unit length and is extended on each side by one unit length. Distribution of all 6mA is in pink. Distributions of 6mA sites with high/intermediate/low methylation levels are in red, brown and blue, respectively. (D) SMRT sequencing identified 5′-AT-3′ as the most representative motif. (E) Distribution of methylation levels of 6mA modifications on Watson–Crick strands indicated that asymmetric 6mA (top left and bottom right) were not an insufficiently methylated status of symmetric 6mA (top right). Plotted by ggplot2 in R, bandwidth = c (0.25,0.25).
Figure 3.
Figure 3.
6mA is preferentially associated with RNA Polymerase II-transcribed genes. (A) Comparison of 6mA methylation levels on bulk genomic DNA (MAC, blue), Polymerase II transcribed gene regions (Pol II, green) and rDNA (Pol I, red). (B) No 6mA methylation is localized on RNA Polymerase III transcribed genes. Pol III genes are listed in Supplementary Table S2. (C) qPCR validation of nine selected GATC sites located on genes transcribed by different RNA polymerases (Pol I, II and III). Genomic DNA of SB210 was digested at 37°C with DpnI for 30 min or overnight or with DpnII overnight. qPCR was performed with primers flanking GATC sites or with internal control primers (Supplementary Table S3). Y-axis represents methylation level that is reflected by normalized Ct value difference between digested and undigested samples. H1-H3: highly methylated sites. I1: intermediately methylated sites. N1-N5: unmethylated sites. (D) Methylation levels of 6mA distributed in the 1 kb region downstream the TSS of genes with different expression levels. Genes are ranked from high to low by their expression levels and divided into 10 quantiles (Q1-Q10). Each 6mA is shown as a green dot. Median of methylation level in each group of genes is marked with a red line. Inter-quartile ranges (IQR) are plotted as brown boxes. Confidence intervals are marked with blue lines. Ten groups of genes with different expression levels are divided into four homogeneous subsets according to ANOVA analysis (significance of each subset compared with others are 0.040, 0.016, 1.000 and 1.000, respectively, under condition of α = 0.01; see Supplementary Table S4). (E) Correlation matrix of different attributes of genes: (i) 6mA amount in 1 kb region downstream TSS, (ii) relative distance of 6mA to nucleosome dyad in this region, (iii) methylation level of 6mA in this region and (iv) gene expression levels (log10). Correlation coefficients and correlation color dots were shown in the higher triangle of the correlation matrix (P < 0.01). Negative correlations are in blue and positive ones in red, as the color bar shown below. The histograms of the attributes are shown on the diagonal. Bivariate scatterplots among attributes, with fitted lines, are plotted in the lower triangle of the correlation matrix.
Figure 4.
Figure 4.
6mA is preferentially associated with the linker DNA between well-positioned nucleosomes and/or nucleosomes containing the histone variant H2A.Z. (A) GBrowse snapshot of the genomic data. The tracks from top to bottom are gene models (black), mRNA transcripts (blue), dyads of nucleosomes (light blue), dyads of nucleosomes containing H2A.Z (green) and 6mA modifications (red), respectively. Note that 6mA signals are located in inter-nucleosomal regions, toward the 5′ end of gene bodies. (B) The methylation level of 6mA is correlated with the distance to the nucleosome dyad. Note that 6mA with high methylation levels are excluded from the nucleosomal DNA. The violin plots showed the density of 6mA at different relative distances to the nucleosome dyad in different methylation level groups (filled with different colors). The box plots in the violin plots indicate the median and the interquartile range in each group. (C) Distribution profiles of nucleosome (blue), H2A.Z (green) and 6mA (pink) around TSS. (D) Nucleosomes exhibit a more consistent phase relative to TSS in genes marked with 6mA (left) than genes without 6mA (right). A total of 15 841 TSS of well-modeled genes are used, including 13 485 TSS of genes marked with 6mA and 2356 TSS of genes without 6mA. (E) Correlation matrix of H2A.Z, nucleosome positioning degree, and density of highly-methylated 6mA. Correlation coefficients and correlation color dots are shown (p < 0.01). Negative correlations are in blue and positive ones in red, as the color bar shown below. (F) Distribution profiles of nucleosome (blue), H2A.Z (green) and 6mA (pink) on the gene body showing that they are all enriched toward the 5′ end of gene bodies (bin = 5% of H2A.Z peak length). Genes are scaled to unit length and one unit length is extended to each side. (G) Relative distribution of 6mA (red) and H2A.Z (green). Note that 6mA is enriched in the well-defined linker DNA regions (45–55 bp) flanked by H2A.Z-containing nucleosomes. Bin = 5 bp, normalized to 1 million tags.

References

    1. Zacharias W. Jost JP, Saluz HP. Methylation of cytosine influences the DNA structure. DNA Methylation. 1993; 64:Basel: Birkhäuser Verlag; 27–38. - PubMed
    1. Reisenauer A., Kahng L.S., McCollum S., Shapiro L.. Bacterial DNA methylation: a cell cycle regulator?. J. Bacteriol. 1999; 181:5135–5139. - PMC - PubMed
    1. Bird A. The essentials of DNA methylation. Cell. 1992; 70:5–8. - PubMed
    1. Hattman S., Kenny C., Berger L., Pratt K.. Comparative study of DNA methylation in three unicellular eucaryotes. J. Bacteriol. 1978; 135:1156–1157. - PMC - PubMed
    1. Fu Y., Luo G., Chen K., Deng X., Yu M., Han D., Hao Z., Liu J., Lu X., Doré L.C.. N6-methyldeoxyadenosine marks active transcription start sites in Chlamydomonas. Cell. 2015; 161:879–892. - PMC - PubMed

MeSH terms