. 2017 Dec 15;26(24):4823-4835.
doi: 10.1093/hmg/ddx361.

Genetic reduction of Nrf2 exacerbates cognitive deficits in a mouse model of Alzheimer's disease

Affiliations

Genetic reduction of Nrf2 exacerbates cognitive deficits in a mouse model of Alzheimer's disease

Caterina Branca et al. Hum Mol Genet. .

Abstract

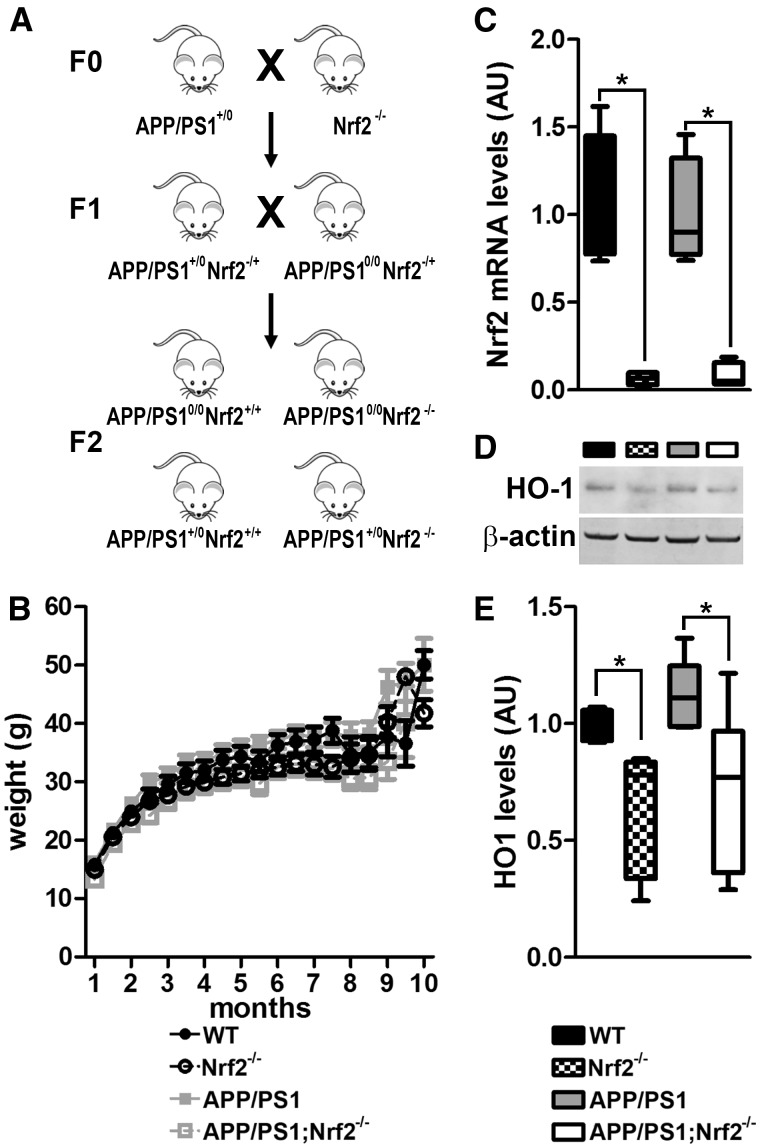
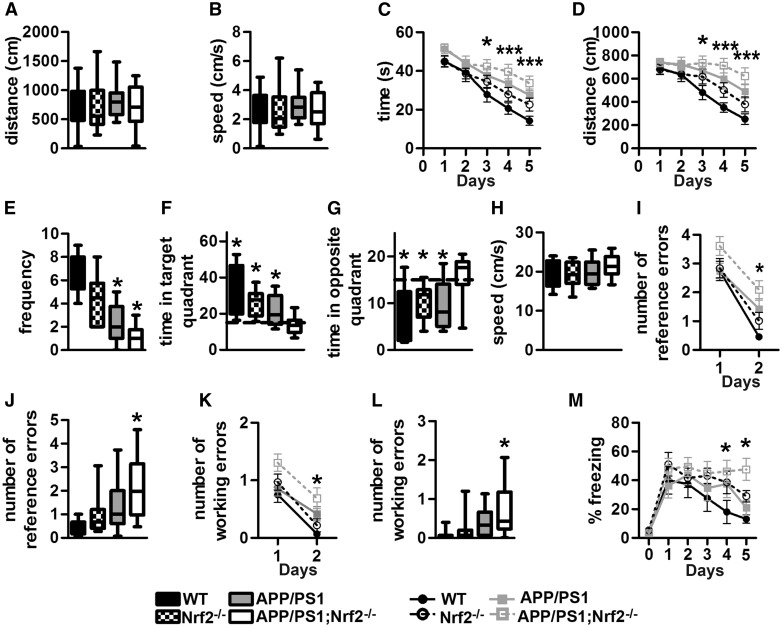
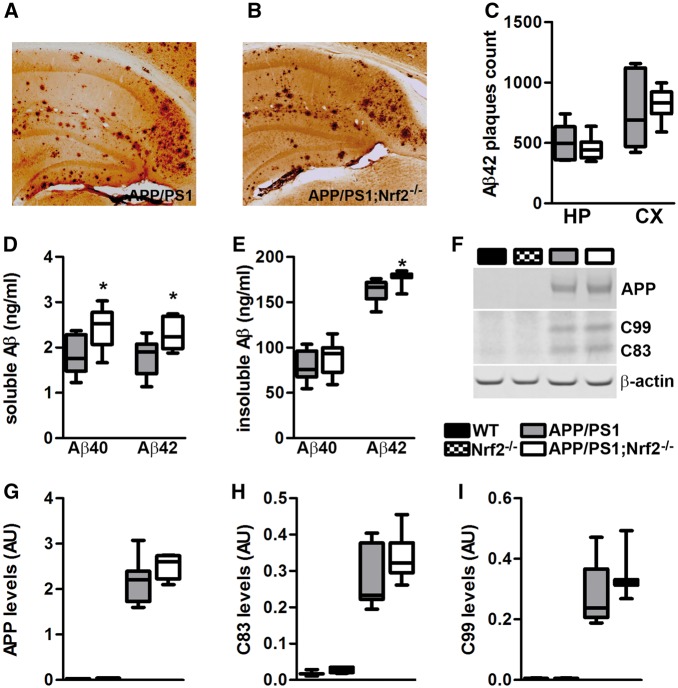
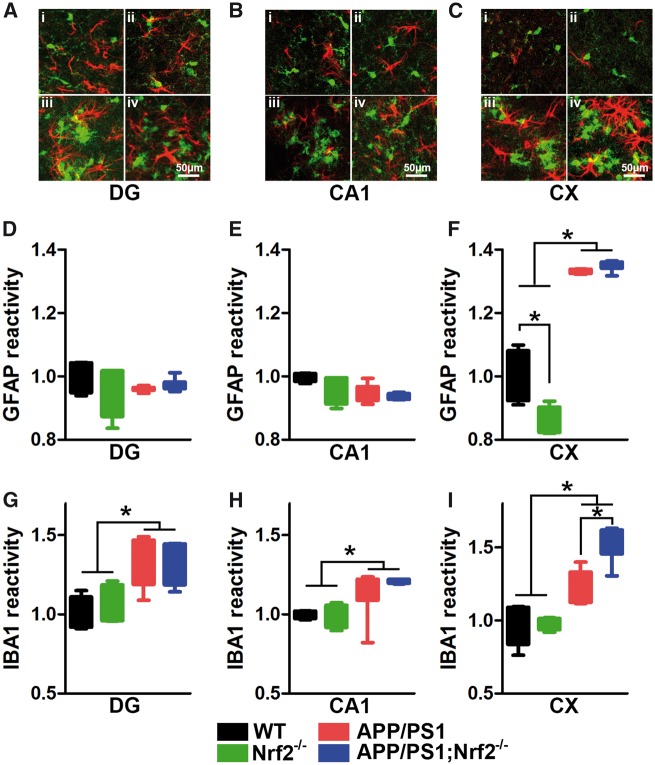
Aging is the major risk factor for several neurodegenerative diseases, including Alzheimer's disease (AD). However, the mechanisms by which aging contributes to neurodegeneration remain elusive. The nuclear factor (erythroid-derived 2)-like 2 (Nrf2) is a transcription factor that regulates expression of a vast number of genes by binding to the antioxidant response element. Nrf2 levels decrease as a function of age, and reduced Nrf2 levels have been reported in postmortem human brains and animal models of AD. Nevertheless, it is still unknown whether Nrf2 plays a role in the cognitive deficits associated with AD. To address this question, we used a genetic approach to remove the Nrf2 gene from APP/PS1 mice, a widely used animal model of AD. We found that the lack of Nrf2 significantly exacerbates cognitive deficits in APP/PS1, without altering gross motor function. Specifically, we found an exacerbation of deficits in spatial learning and memory, as well as in working and associative memory. Different brain regions control these behavioral tests, indicating that the lack of Nrf2 has a global effect on brain function. The changes in cognition were linked to an increase in Aβ and interferon-gamma (IFNγ) levels, and microgliosis. The changes in IFNγ levels are noteworthy as previously published evidence indicates that IFNγ can increase microglia activation and induce Aβ production. Our data suggest a clear link between Nrf2 and AD-mediated cognitive decline and further strengthen the connection between Nrf2 and AD.


Figures

Figure 1.
Figure 1.
Removing the Nrf2 genes from APP/PS1 mice does not alter body weight. (A) Schematic representation of the breeding strategy used to delete both copies of the Nrf2 gene from APP/PS1 mice. Four littermate groups were generated and used for the experiments described here: WT mice (APP/PS10/0; Nrf2+/+, n =  5 females and 3 males), APP/PS1 mice (APP/PS1+/0;Nrf2+/+, n =  5 females and 8 males), Nrf2−/− mice (APP/PS10/0;Nrf2−/−, n =  7 females and 5 males), and APP/PS1;Nrf2−/− mice (APP/PS1+/0;Nrf2−/−, n =  8 females and 4 males). (B) The graph shows the body weight of mice, which was taken monthly. All groups gained weight at the same pace, and no statistically significant differences were detected for any of the genotypes. Data are presented as means ± SEM and were analysed by two-way ANOVA. (C) The graph shows Nrf2 mRNA levels in the different genotypes (n =  4/genotype). As expected, Nrf2 was only detected in WT and APP/PS1 mice. (D) Representative western blots of protein extracted from brains of 12-month-old mice probed with the indicated antibodies. (E) A significant reduction of HO-1 protein was detected in the brain of mice lacking the Nrf2 gene. Data were generated by normalizing the levels of the protein of interest to β-actin loading control. Data are presented as box plots and were analysed by unpaired t-test.
Figure 2.
Figure 2.
Lack of Nrf2 exacerbates cognitive function in APP/PS1 mice. (A,B) The graphs show total distance traveled and speed during the open field test. The data were not statistically different among the four groups (P = 0.8112 and 0.8661, respectively). (C,D) Learning curves of 11-month-old mice trained in the spatial reference version of the MWM. Each day represents the average of four training trials. For the escape latency (time), we found a significant effect for day and genotype [day effect: P < 0.0001; F(4, 220) = 30.71; genotype effect: P < 0.0001; F(3, 220) = 13.93]. APP/PS1 mice were impaired at day 4 and 5, while APP/PS1;Nrf2−/− were impaired starting from day 3. The same results were obtained when analysing the distance traveled to find the platform [day effect: P < 0.0001, F(4, 220) = 14.30; genotype effect: P < 0.0001, F(3, 220) = 12.92]. Data were analysed by two-way ANOVA. (E) The graph shows the numbers of platform location crosses (frequency) during a single 60-s probe trial. We found a significant difference among groups (P < 0.0001). Post hoc analysis with Bonferroni’s correction showed that the WT mice performed better than all the other groups (P < 0.001 vs. APP/PS1 and APP/PS1;Nrf2−/−, P < 0.05 vs. Nrf2−/−). (F,G) The graphs show the time mice spent in the target and the opposite quadrants during the probe trials. In both cases, only the APP/PS1;Nrf2−/− performed at chance level (15 s). (H) Average swim speed during the probe trials. The data were not statistically different among the four groups (P = 0.3591). (I,J) Mice were evaluated in the RAWM. The graphs show the number of reference errors during the two days of testing (I) and the second day (J). All four groups learned the task but APP/PS1;Nrf2−/− mice performed significantly worse than WT mice on day 2 (P < 0.01). (K,L) Mice were evaluated in the RAWM. The graphs show the number of working memory errors during the two days of testing (K) and the second day (L). All four groups learned the task but APP/PS1;Nrf2−/− mice performed significantly worse than WT mice on day 2 (P < 0.01). (M) Mice were tested in the CFC task. The graph shows the percentage freezing on different days. Mice received a mild foot shock on day 0 only. For the other days, they were re-exposed to the environment without receiving further foot shocks. The APP/PS1;Nrf2−/− was the only group that did not extinguish the memory after repetitive exposure to the same environment [days effect, P < 0.0001, F(5, 210) = 16.93; genotype effect, P = 0.001, F(3, 210) = 5.650]. Post hoc analysis with Bonferroni’s correction showed that on day 5 (P < 0.05) and 6 (P < 0.01) APP/PS1;Nrf2−/− mice performed worse than the other groups. Data in panels A, B, E-H, J, and L are presented as box plots and were analysed by one-way ANOVA. Data in panels C-D, I, K, and M are presented as means ± SEM and were analysed by two-way ANOVA.
Figure 3.
Figure 3.
Lack of Nrf2 increases Aβ levels but not plaque number in APP/PS1 mice. (A,B) Representative microphotographs of brain sections immunostained with an Aβ42 specific antibody. (C) Quantitative analysis of the Aβ42 immunoreactivity in the cortex and hippocampus showed no differences among groups (P = 0.6568 for the cortex, P = 0.4785 for the hippocampus, n =  6/genotype). (D,E) Aβ40 and Aβ42 levels measured by ELISA (n = 8/genotype). In the soluble fraction, both Aβ40 and Aβ42 levels were significantly different between APP/PS1 and APP/PS1;Nrf2−/− mice (P = 0.0143 and 0.0182, respectively). In the insoluble fraction, Aβ42 levels were significantly different between APP/PS1 and APP/PS1;Nrf2−/− mice, while no differences were detected for Aβ40 (P = 0.0158 and 0.4484, respectively). (F) Representative western blots of protein extracted from brains of 12-month-old mice probed with the indicated antibodies. (G–I) Quantitative analyses of the blots. In APP/PS1 and APP/PS1;Nrf2−/− mice the levels of APP, C83, and C99 were significantly higher than the two WT groups. These changes were independent of Nrf2. Data are presented as box plots and were analysed by unpaired t-test (D,E) or one-way ANOVA (G–I).
Figure 4.
Figure 4.
Lack of Nrf2 does not change proteasome or autophagy activity in APP/PS1 mice. (A–C) Proteasomal activity was evaluated using selective fluorogenic substrates. No differences among genotypes were detected for the caspase-like activity. Trypsin- or chymotrypsin- activities were different among groups (P < 0.0001 for both). Post hoc analysis with Bonferroni’s correction highlighted that these differences were driven by the WT group (P < 0.001 for both). (D) Representative western blots of protein extracted from brains of 12-month-old mice probed with the indicated antibodies. (E–I) Quantitative analyses of the blots show no differences among genotypes for any of the proteins analysed (P = 0.8690 for p-mTOR, P = 0.4928 for p-p70S6K, P = 0.7004 for Atg3, P = 0.2273 for Atg5, and P = 0.4092 for Atg7). Data are presented as box plots and were analysed by one-way ANOVA.
Figure 5.
Figure 5.
Lack of Nrf2 affects oxidative stress in APP/PS1 mice. (A) Representative western blots of proteins extracted from brains of 12-month-old mice probed with the indicated antibodies (n =  7/genotype). (B) Quantitative analyses of the blots show higher 4-HNE levels in presence of the APP transgene, independent of the Nrf2 genotype [APP transgene effect: P = 0.0278 and F(1, 24) = 5.518. Nrf2 effect: P = 0.6554 and F(1, 24) = 0.2044]. (C) Protein carbonyl levels were measured by ELISA (n =  7/genotype) in the soluble fraction. Both APP transgene and Nrf2 genotype affected protein carbonyl levels [APP transgene effect: P = 0.0039 and F(1, 24) = 9.127. Nrf2 effect: P = 0.0141 and F(1, 24) = 6.451. Fig. 5C]. No differences were detected between APP/PS1 and APP/PS1;Nrf2−/− mice. Data are presented as box plots, and were analysed by two-way ANOVA.
Figure 6.
Figure 6.
Increased microglia immunoreactivity in the cortex of APP/PS1 mice lacking the Nrf2 gene. (A–C) Representative microphotographs of different brain regions (DG, dentate gyrus; CA1, Cornu Ammonis 1; CX, cortex) from sections immunostained with GFAP (red) and Iba1 (green). i, WT; ii, Nrf2−/−; iii, APP/PS1; iv, APP/PS1;Nrf2−/−. (D–F) Semiquantitative analysis of GFAP immunoreactivity showed no differences among groups in DG and CA1. In contrast, there was a significant difference in the CX [APP transgene effect: P < 0.0001 and F(1, 16) = 472.9; Nrf2 effect: P = 0.0044 and F(1, 16) = 10.94; interaction: P = 0.0005 and F(1, 16) = 18.61]. (G–I) Semiquantitative analysis of Iba1 immunoreactivity showed that the presence of the APP transgene changed Iba1 immunoreactivity in DG and CA1 [P = 0.0001 and F(1, 16) = 26.01 for DG; P = 0.0008 and F(1, 16) = 17.06 for CA1]. Moreover, in the CX Iba1 immunoreactivity was different among the four groups [APP transgene effect: P < 0.0001 and F(1, 16) = 52.39; Nrf2 effect: P = 0.0119 and F(1, 16) = 8.04; interaction: P = 0.0057 and F(1, 16) = 10.18]. Post hoc analysis with Bonferroni’s correction indicated that Iba1 immunoreactivity was significantly higher in APP/PS1;Nrf2−/− mice compared with APP/PS1 mice (P < 0.001). Data are presented as box plots and were analysed by two-way ANOVA.

Similar articles

Cited by

References

    1. Deshmukh P., Unni S., Krishnappa G., Padmanabhan B. (2017) The Keap1-Nrf2 pathway: promising therapeutic target to counteract ROS-mediated damage in cancers and neurodegenerative diseases. Biophys. Rev., 9, 41–56. - PMC - PubMed
    1. Pajares M., Cuadrado A., Rojo A.I. (2017) Modulation of proteostasis by transcription factor NRF2 and impact in neurodegenerative diseases. Redox. Biol., 11, 543–553. - PMC - PubMed
    1. Hayes J.D., Dinkova-Kostova A.T. (2014) The Nrf2 regulatory network provides an interface between redox and intermediary metabolism. Trends Biochem. Sci., 39, 199–218. - PubMed
    1. Johnson D.A., Johnson J.A. (2015) Nrf2–a therapeutic target for the treatment of neurodegenerative diseases. Free Radic. Biol. Med., 88, 253–267. - PMC - PubMed
    1. Itoh K., Wakabayashi N., Katoh Y., Ishii T., Igarashi K., Engel J.D., Yamamoto M. (1999) Keap1 represses nuclear activation of antioxidant responsive elements by Nrf2 through binding to the amino-terminal Neh2 domain. Genes Dev., 13, 76–86. - PMC - PubMed

Publication types

MeSH terms