

Comparative genome and transcriptome analyses reveal adaptations to opportunistic infections in woody plant degrading pathogens of Botryosphaeriaceae
- PMID: 29036669
- PMCID: PMC5824938
- DOI: 10.1093/dnares/dsx040
Comparative genome and transcriptome analyses reveal adaptations to opportunistic infections in woody plant degrading pathogens of Botryosphaeriaceae
Abstract
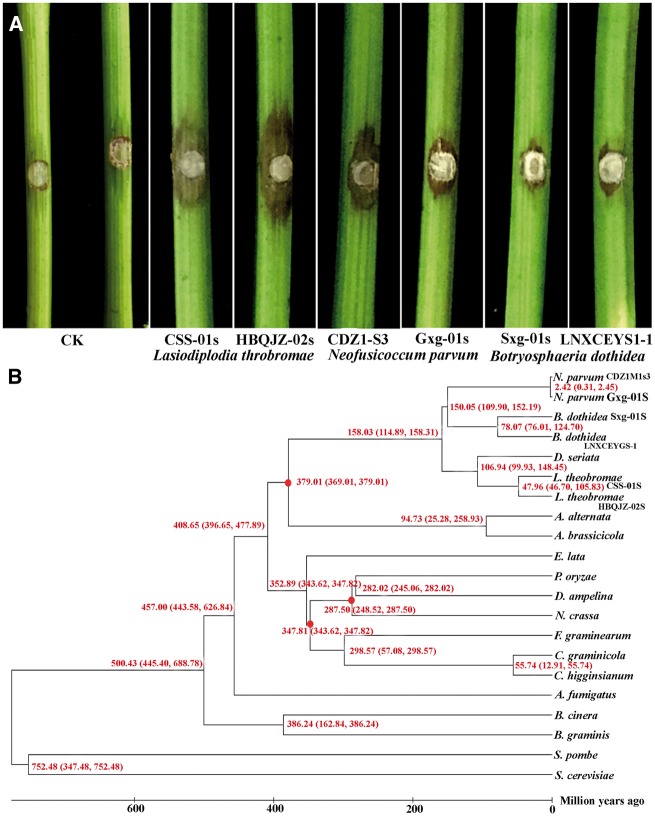
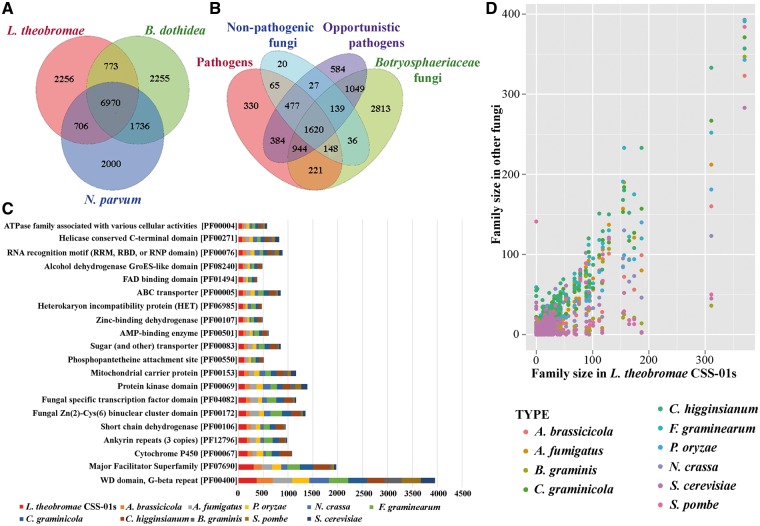
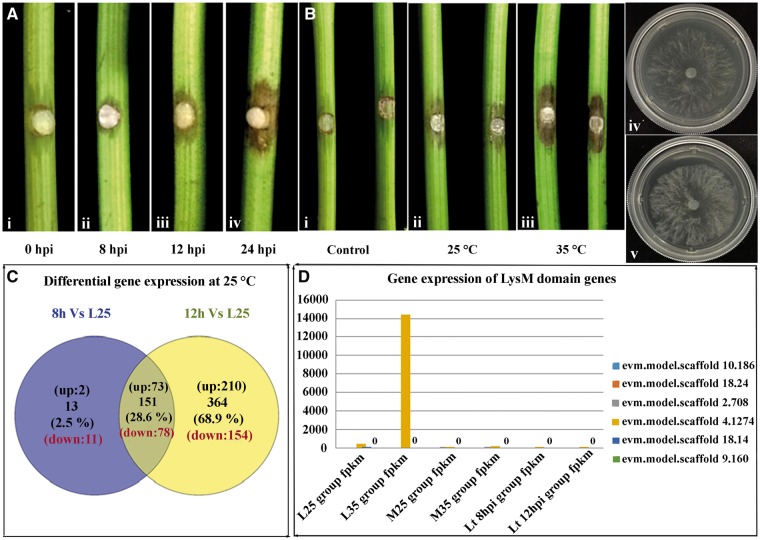
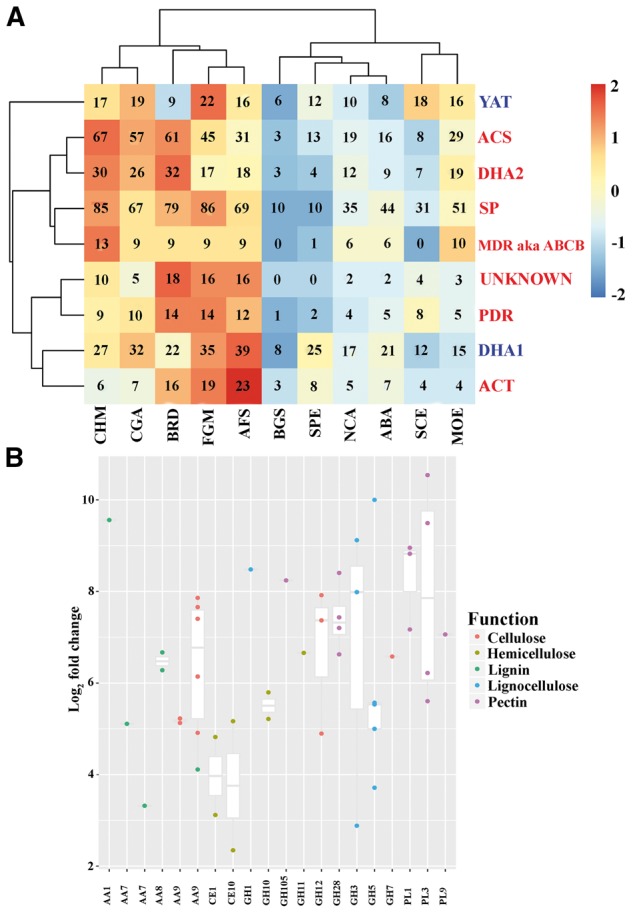
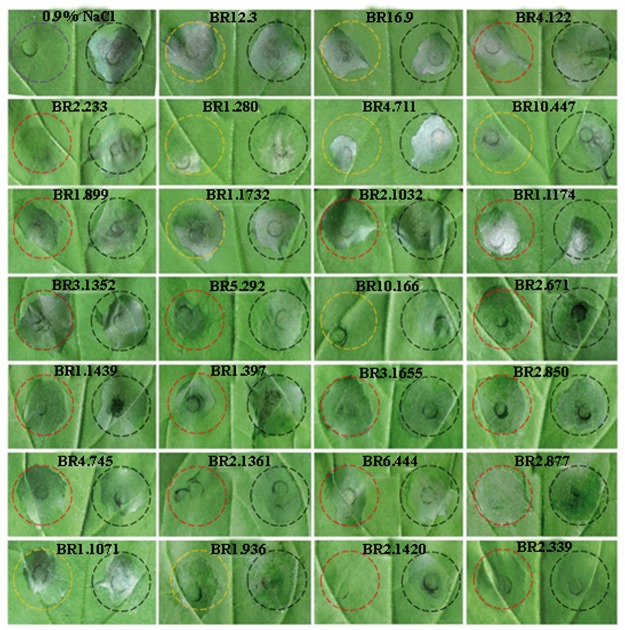
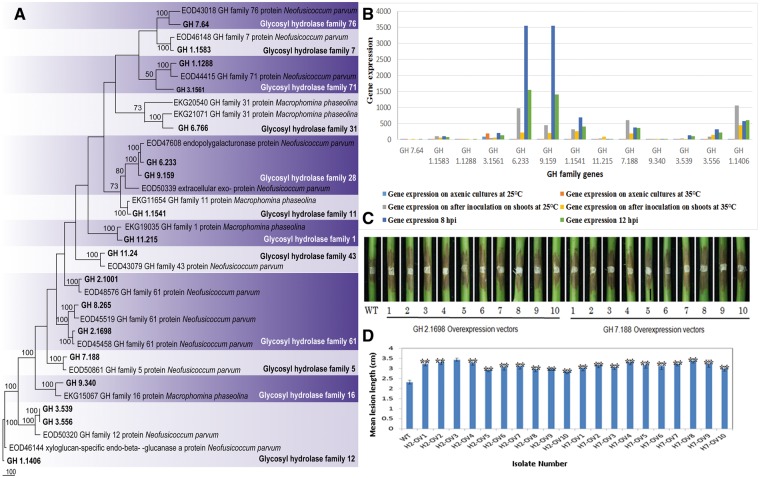
Botryosphaeriaceae are an important fungal family that cause woody plant diseases worldwide. Recent studies have established a correlation between environmental factors and disease expression; however, less is known about factors that trigger these diseases. The current study reports on the 43.3 Mb de novo genome of Lasiodiplodia theobromae and five other genomes of Botryosphaeriaceae pathogens. Botryosphaeriaceous genomes showed an expansion of gene families associated with cell wall degradation, nutrient uptake, secondary metabolism and membrane transport, which contribute to adaptations for wood degradation. Transcriptome analysis revealed that genes involved in carbohydrate catabolism, pectin, starch and sucrose metabolism, and pentose and glucuronate interconversion pathways were induced during infection. Furthermore, genes in carbohydrate-binding modules, lysine motif domain and the glycosyl hydrolase gene families were induced by high temperature. Among these genes, overexpression of two selected putative lignocellulase genes led to increased virulence in the transformants. These results demonstrate the importance of high temperatures in opportunistic infections. This study also presents a set of Botryosphaeriaceae-specific effectors responsible for the identification of virulence-related pathogen-associated molecular patterns and demonstrates their active participation in suppressing hypersensitive responses. Together, these findings significantly expand our understanding of the determinants of pathogenicity or virulence in Botryosphaeriaceae and provide new insights for developing management strategies against them.
Keywords: Lasiodiplodia theobromae; de novo assembly; RNASeq; low-depth sequencing; virulence factors.
© The Author 2017. Published by Oxford University Press on behalf of Kazusa DNA Research Institute.
Figures
Similar articles
-
Phylogenomics of Plant-Associated Botryosphaeriaceae Species.Front Microbiol. 2021 Mar 18;12:652802. doi: 10.3389/fmicb.2021.652802. eCollection 2021. Front Microbiol. 2021. PMID: 33815343 Free PMC article.
-
Genome and transcriptome analysis of the latent pathogen Lasiodiplodia theobromae, an emerging threat to the cacao industry.Genome. 2020 Jan;63(1):37-52. doi: 10.1139/gen-2019-0112. Epub 2019 Oct 3. Genome. 2020. PMID: 31580730
-
Botryosphaeriaceae gene machinery: Correlation between diversity and virulence.Fungal Biol. 2023 May;127(5):1010-1031. doi: 10.1016/j.funbio.2023.03.004. Epub 2023 Mar 30. Fungal Biol. 2023. PMID: 37142361
-
Pathogenicity Factors of Botryosphaeriaceae Associated with Grapevine Trunk Diseases: New Developments on Their Action on Grapevine Defense Responses.Pathogens. 2022 Aug 22;11(8):951. doi: 10.3390/pathogens11080951. Pathogens. 2022. PMID: 36015071 Free PMC article. Review.
-
Botryosphaeria dothidea: a latent pathogen of global importance to woody plant health.Mol Plant Pathol. 2017 May;18(4):477-488. doi: 10.1111/mpp.12495. Epub 2016 Dec 13. Mol Plant Pathol. 2017. PMID: 27682468 Free PMC article. Review.
Cited by
-
Dual RNA-Seq Reveals Temperature-Mediated Gene Reprogramming and Molecular Crosstalk between Grapevine and Lasiodiplodia theobromae.J Fungi (Basel). 2023 Dec 14;9(12):1197. doi: 10.3390/jof9121197. J Fungi (Basel). 2023. PMID: 38132797 Free PMC article.
-
Phylogenomics of Plant-Associated Botryosphaeriaceae Species.Front Microbiol. 2021 Mar 18;12:652802. doi: 10.3389/fmicb.2021.652802. eCollection 2021. Front Microbiol. 2021. PMID: 33815343 Free PMC article.
-
De novo transcriptomic assembly and mRNA expression patterns of Botryosphaeria dothidea infection with mycoviruses chrysovirus 1 (BdCV1) and partitivirus 1 (BdPV1).Virol J. 2018 Aug 13;15(1):126. doi: 10.1186/s12985-018-1033-4. Virol J. 2018. PMID: 30103770 Free PMC article.
-
LtGAPR1 Is a Novel Secreted Effector from Lasiodiplodia theobromae That Interacts with NbPsQ2 to Negatively Regulate Infection.J Fungi (Basel). 2023 Jan 31;9(2):188. doi: 10.3390/jof9020188. J Fungi (Basel). 2023. PMID: 36836303 Free PMC article.
-
Candidate Effectors from Botryosphaeria dothidea Suppress Plant Immunity and Contribute to Virulence.Int J Mol Sci. 2021 Jan 7;22(2):552. doi: 10.3390/ijms22020552. Int J Mol Sci. 2021. PMID: 33430504 Free PMC article.
References
-
- Yan J., Xie Y., Zhang W., et al.2013, Species of Botryosphaeriaceae involved in grapevine dieback in China, Fungal Divers., 61, 221–36.
-
- Chethana K. W. T., Li X. H., Zhang W., Hyde K. D., Yan J. Y.. 2016. Trail decryption of molecular research on Botryosphaeriaceae in woody plants, Phytopathol. Mediterr., 55, 147–71.
LinkOut - more resources
Full Text Sources
Other Literature Sources
Miscellaneous
