. 2017 Oct 16;18(1):72.
doi: 10.1186/s12868-017-0391-y.

PeakCaller: an automated graphical interface for the quantification of intracellular calcium obtained by high-content screening

Affiliations

PeakCaller: an automated graphical interface for the quantification of intracellular calcium obtained by high-content screening

Elena Artimovich et al. BMC Neurosci. .

Abstract

Background: Intracellular calcium is an important ion involved in the regulation and modulation of many neuronal functions. From regulating cell cycle and proliferation to initiating signaling cascades and regulating presynaptic neurotransmitter release, the concentration and timing of calcium activity governs the function and fate of neurons. Changes in calcium transients can be used in high-throughput screening applications as a basic measure of neuronal maturity, especially in developing or immature neuronal cultures derived from stem cells.

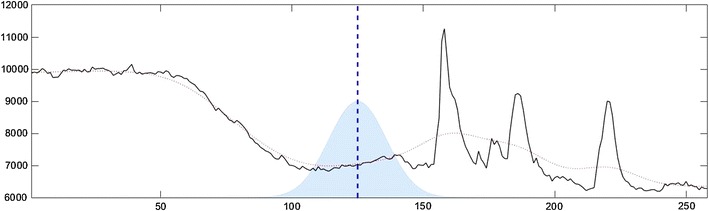
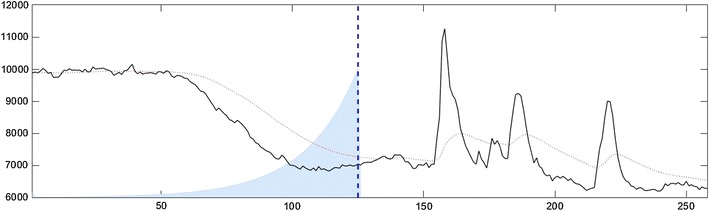
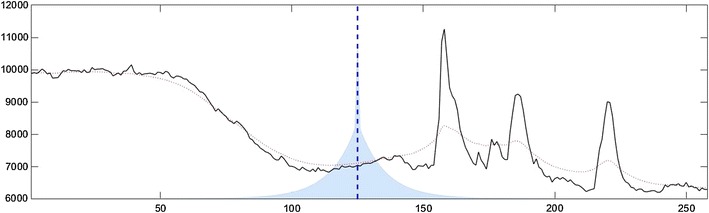
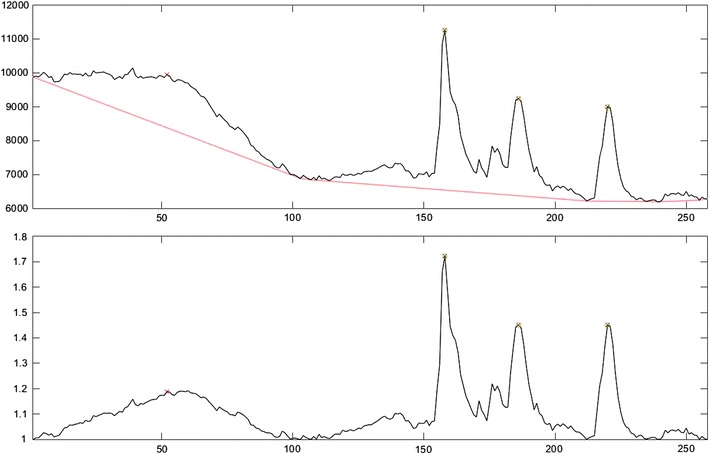
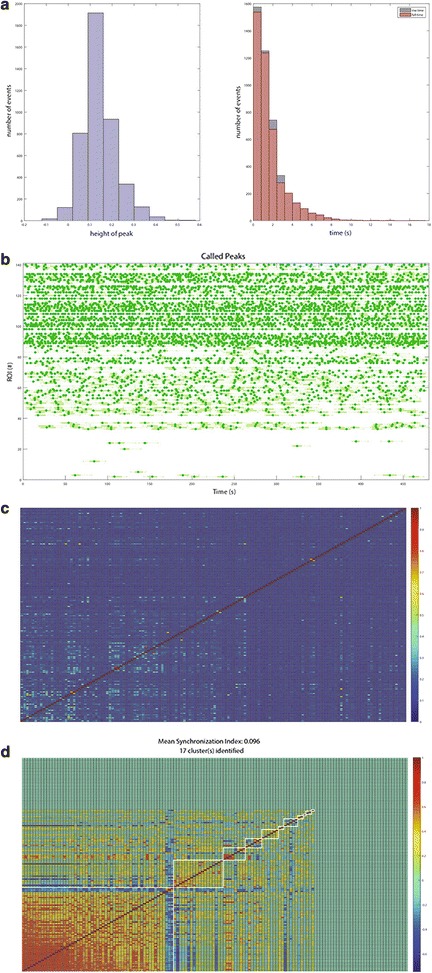
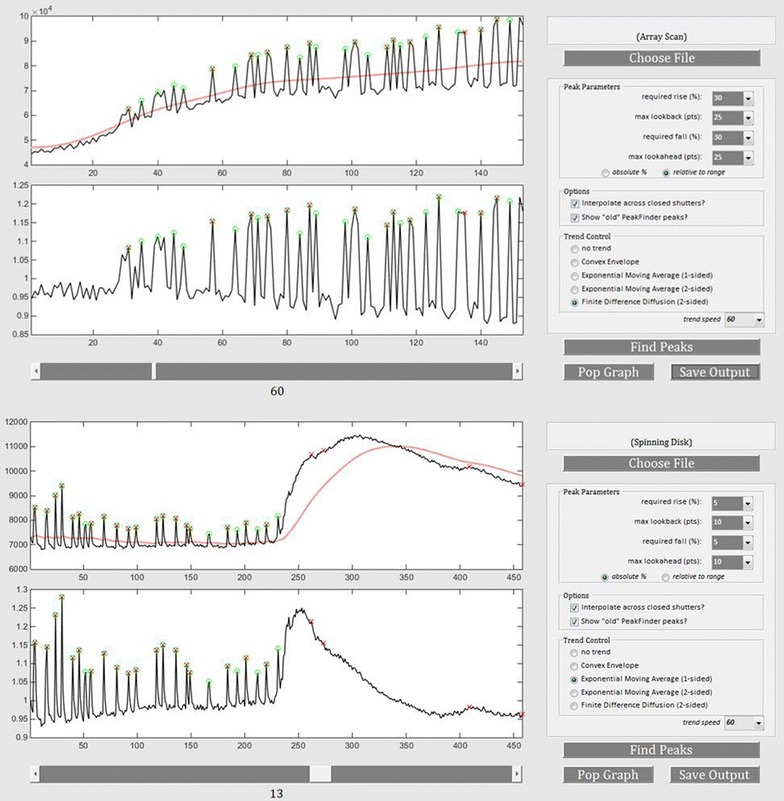
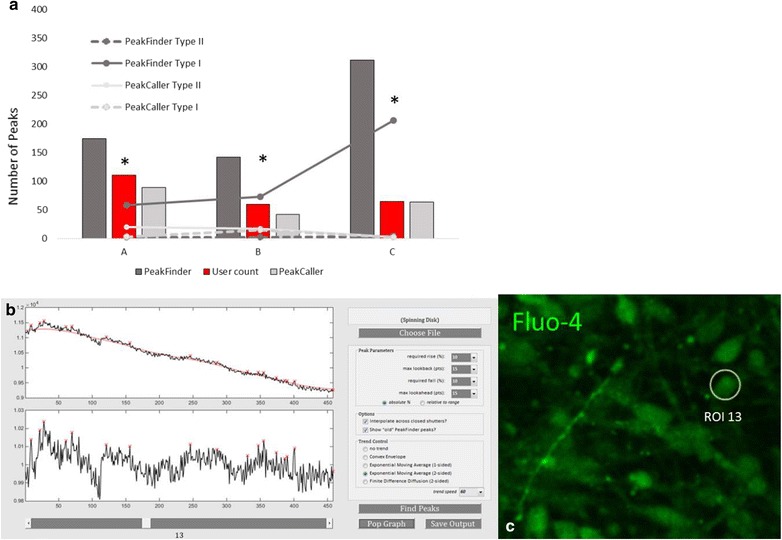
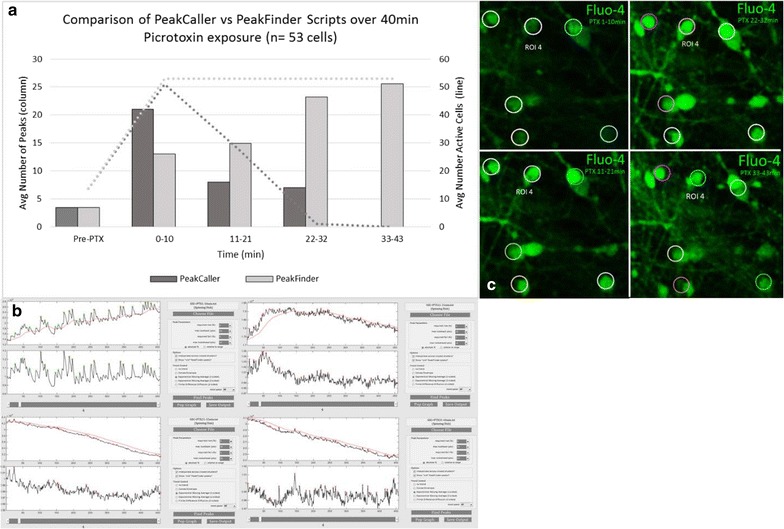
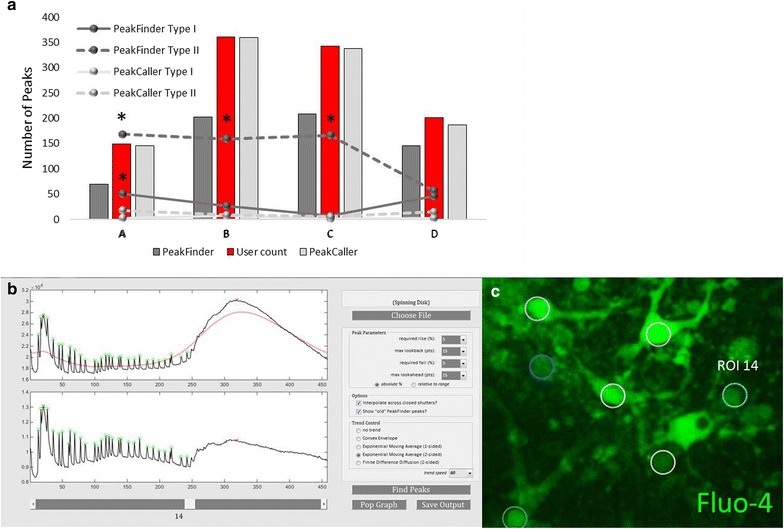
Results: Using human induced pluripotent stem cell derived neurons and dissociated mouse cortical neurons combined with the calcium indicator Fluo-4, we demonstrate that PeakCaller reduces type I and type II error in automated peak calling when compared to the oft-used PeakFinder algorithm under both basal and pharmacologically induced conditions.

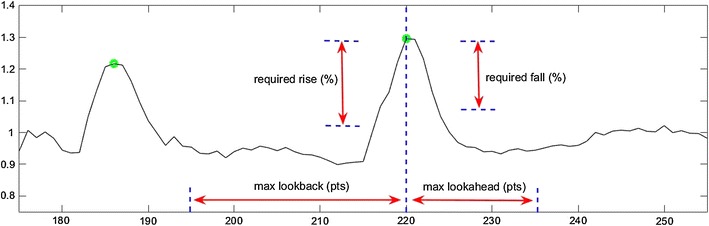
Conclusion: Here we describe PeakCaller, a novel MATLAB script and graphical user interface for the quantification of intracellular calcium transients in neuronal cultures. PeakCaller allows the user to set peak parameters and smoothing algorithms to best fit their data set. This new analysis script will allow for automation of calcium measurements and is a powerful software tool for researchers interested in high-throughput measurements of intracellular calcium.

Keywords: Calcium imaging; Calcium imaging software; High-content screening; Human stem cells.


Figures

Fig. 1
Fig. 1
This figure illustrates the weight function and smoothing corresponding to finite difference diffusion, with the trend smoothness parameter set to 80. Time is on the horizontal axis (in seconds) and the fluorescence intensity of the Fluo-4 emission is on the vertical axis (arbitrary units). For the original Ca2+ recording (in black), the smoothing is given by the dotted red curve. To visualize the smoothing calculation, at the dashed blue line, the smoothed value is computed by weighting the values of the original profile proportionally with the weight function shaded in light blue. Notice that this weight function is approximately Gaussian
Fig. 2
Fig. 2
Example of  the weight function and smoothing corresponding to a 1-sided exponential moving average with the trend smoothness parameter set to 40. For the original Ca2+ recording (in black), the smoothing is given by the dotted red curve. To visualize the smoothing calculation, at the dashed blue line, the smoothed value is computed by weighting the values of the original profile proportionally with the weight function shaded in light blue. Note especially that the smoothed value at any point depends only on the portion of the original profile to the left of that point
Fig. 3
Fig. 3
Graphical representation of  the weight function and smoothing corresponding to a 2-sided exponential moving average with the trend smoothness parameter set to 20. For the original Ca2+ profile (in black), the smoothing is given by the dotted red curve. To visualize the smoothing calculation, at the dashed blue line, the smoothed value is computed by weighting the values of the original profile proportionally with the weight function shaded in light blue. Notice especially the double-weight given to the value at the blue line, as it is the only point in common to both the forward- and backward-looking moving averages
Fig. 4
Fig. 4
Illustration of smoothing using the convex envelope and shows the actual graphics provided by PeakCaller. In the upper graph, for the original Ca2+ recording (in black), the smoothing using a convex envelope is given by the dotted red curve. The lower graph shows the de-trended data series, which is simply the quotient of the original data divided by the smoothed data. Note in this case that the de-trended data “bounces off” of a minimum value of one exactly at the corners where the convex envelope touches the original profile. Peaks identified by PeakCaller are marked with a green circle, whereas peaks identified by PeakFinder are marked with a red ‘X’
Fig. 5
Fig. 5
This figure details the parameters used by PeakCaller to characterize a peak. For a point to be classified as a peak there must be a significant rise over a designated interval before the point, and a significant fall within a designated interval after the point
Fig. 6
Fig. 6
Multiple traces and ROIs can be visualized using the Peak Caller. The top dark parts of the trace are the identified peaks for each time series. This visualization can be rotated to examine the activity across an entire data set. a Ca2+ transients recorded from ~ 500 human iPSC-derived neurons transfected with the Ca2+ indicator GCamp6 recording using the ThermoFisher ArrayScan system. b Ca2+ transients recorded from ~ 200 human iPSC-derived neurons treated with the Ca2+ indicator Fluo-4 imaged at 10 Hz (x-axis represents time in seconds, y-axis represents number of ROIs and z-axis represents amplitude as ΔF/F)
Fig. 7
Fig. 7
Typical functional output for a high-content Ca2+ imaging experiment. a Histograms, b raster plots, c correlation, and d synchronization indexes can be calculated for large numbers of cells to determine group characteristics of calcium transients in a high-throughput screen. The heat maps and synchronization index can give the end user a measure of the functional connectivity in a given dataset. In this dataset the Ca2+ transients are not functionally connected, as evidenced by no bursting patterns in the raster plot, low autocorrelations in the heat map, and a synchronicity index of 0.096. This is to be expected, as these transients were recorded from neural progenitors at day 21 derived from human iPSCs
Fig. 8
Fig. 8
Analysis of Zeiss Spinning Disk and ThermoFisher Array Scan Ca2+ imaging data output by PeakCaller. The vertical axis represents Fluo-4 fluorescence emission intensity (arbitrary units) and the horizontal axis is time in seconds. Green circles represent PeakCaller identified peaks. Red Xs represent PeakFinder identified peaks. Parameters were chosen to best represent data generated on both platforms
Fig. 9
Fig. 9
PeakCaller decreases the incidence of type I errors in cultured hiPSC-derived cortical neurons (*p < 0.05). a No difference in incidence of type II errors was found between PeakCaller and PeakFinder under these culture conditions. b Representative trace shows over estimation of peak incidence and frequency in PeakFinder (red X) script. c Designated ROI for the recording in this representative trace
Fig. 10
Fig. 10
a Reduction of type I errors by PeakCaller after application of PTX to induce excitation. Prior to PTX exposure both PeakFinder and PeakCaller correctly identified the same number of peaks per active cell. After PTX exposure (50 μM), PeakCaller correctly modeled the state of induced excitation and excitotoxicity in the hiPSC derived cortical neurons, while PeakFinder initially under estimated the number of peaks and then over estimated the number or Ca2+ peaks. b Representative traces of ROI 4 are provided to show the transient increase in Ca2+ signaling after application of PTX. c Designated ROIs across all recordings for this representative experiment
Fig. 11
Fig. 11
a Reduction of type II error in dissociated mouse cortical neurons. PeakCaller demonstrated the ability to reduce the occurrence of type II errors (p < 0.05) in three of four Ca2+ recordings. No difference in incidence of type II error was found between the two scripts for the fourth recording. PeakCaller also showed a significant (p < 0.05) reduction in type I error in recording A. b Representative traces below show PeakCaller peaks in green circles and PeakFinder peaks as red Xs. c Designated ROIs for this representative experiment

References

    1. Sutherland DJ, Goodhill GJ. The interdependent roles of Ca(2+) and cAMP in axon guidance. Dev Neurobiol. 2015;75:402–410. doi: 10.1002/dneu.22144. - DOI - PubMed
    1. Rosenberg SS, Spitzer NC. Calcium signaling in neuronal development. Cold Spring Harb Perspect Biol. 2011;3:a004259. doi: 10.1101/cshperspect.a004259. - DOI - PMC - PubMed
    1. Evans RM, Zamponi GW. Presynaptic Ca2+ channels–integration centers for neuronal signaling pathways. Trends Neurosci. 2006;29:617–624. doi: 10.1016/j.tins.2006.08.006. - DOI - PubMed
    1. Zucker RS. Calcium- and activity-dependent synaptic plasticity. Curr Opin Neurobiol. 1999;9:305–313. doi: 10.1016/S0959-4388(99)80045-2. - DOI - PubMed
    1. Demuro A, Parker I, Stutzmann GE. Calcium signaling and amyloid toxicity in Alzheimer disease. J Biol Chem. 2010;285:12463–12468. doi: 10.1074/jbc.R109.080895. - DOI - PMC - PubMed

Publication types