Assessment of local pulse wave velocity distribution in mice using k-t BLAST PC-CMR with semi-automatic area segmentation
- PMID: 29037199
- PMCID: PMC5641989
- DOI: 10.1186/s12968-017-0382-2
Assessment of local pulse wave velocity distribution in mice using k-t BLAST PC-CMR with semi-automatic area segmentation
Abstract
Background: Local aortic pulse wave velocity (PWV) is a measure for vascular stiffness and has a predictive value for cardiovascular events. Ultra high field CMR scanners allow the quantification of local PWV in mice, however these systems are yet unable to monitor the distribution of local elasticities.
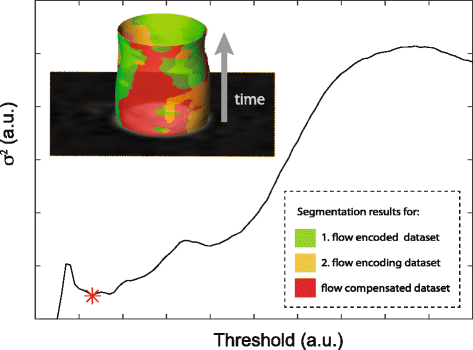
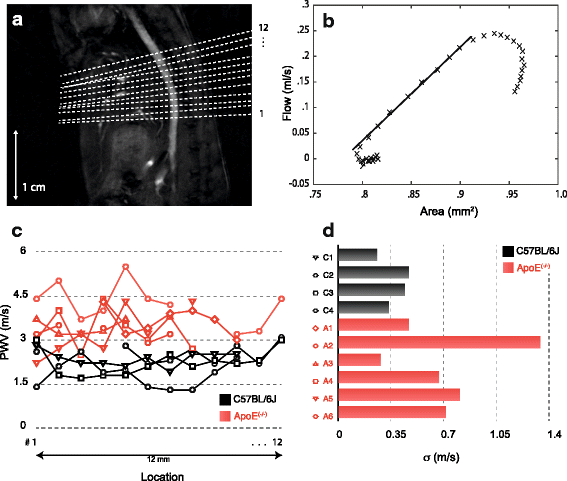
Methods: In the present study we provide a new accelerated method to quantify local aortic PWV in mice with phase-contrast cardiovascular magnetic resonance imaging (PC-CMR) at 17.6 T. Based on a k-t BLAST (Broad-use Linear Acquisition Speed-up Technique) undersampling scheme, total measurement time could be reduced by a factor of 6. The fast data acquisition enables to quantify the local PWV at several locations along the aortic blood vessel based on the evaluation of local temporal changes in blood flow and vessel cross sectional area. To speed up post processing and to eliminate operator bias, we introduce a new semi-automatic segmentation algorithm to quantify cross-sectional areas of the aortic vessel. The new methods were applied in 10 eight-month-old mice (4 C57BL/6J-mice and 6 ApoE (-/-)-mice) at 12 adjacent locations along the abdominal aorta.
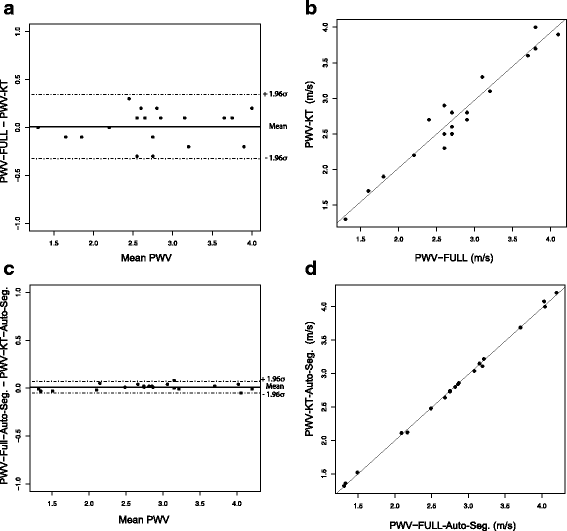
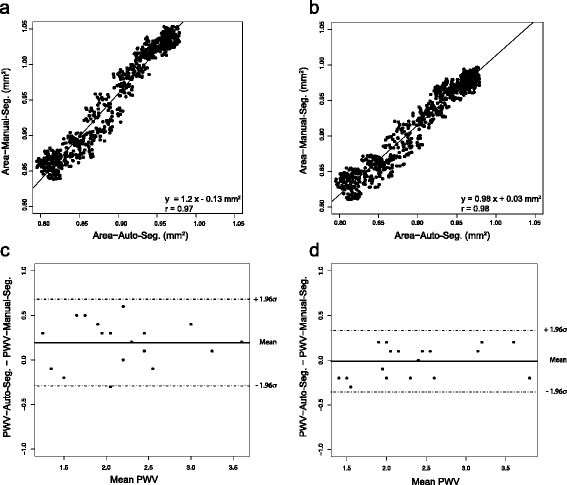
Results: Accelerated data acquisition and semi-automatic post-processing delivered reliable measures for the local PWV, similiar to those obtained with full data sampling and manual segmentation. No statistically significant differences of the mean values could be detected for the different measurement approaches. Mean PWV values were elevated for the ApoE (-/-)-group compared to the C57BL/6J-group (3.5 ± 0.7 m/s vs. 2.2 ± 0.4 m/s, p < 0.01). A more heterogeneous PWV-distribution in the ApoE (-/-)-animals could be observed compared to the C57BL/6J-mice, representing the local character of lesion development in atherosclerosis.
Conclusion: In the present work, we showed that k-t BLAST PC-MRI enables the measurement of the local PWV distribution in the mouse aorta. The semi-automatic segmentation method based on PC-CMR data allowed rapid determination of local PWV. The findings of this study demonstrate the ability of the proposed methods to non-invasively quantify the spatial variations in local PWV along the aorta of ApoE (-/-)-mice as a relevant model of atherosclerosis.
Keywords: ApoE (−/−); Magnetic resonance imaging; Phase contrast; Pulse wave velocity.
Conflict of interest statement
Ethics approval and consent to participate
All experimental procedures were in accordance with institutional and internationally recognized guidelines and were approved by the Regierung von Unterfranken (Government of Lower Franconia, Würzburg, Germany, Az. 55.2-2531.01-23/11) to comply with german animal protection law.
Consent for publication
All authors have approved the final manuscript and give consent for publication.
Competing interests
The authors declare that they have no competing interests.
Publisher’s Note
Springer Nature remains neutral with regard to jurisdictional claims in published maps and institutional affiliations.
Figures


References
-
- Sutton-Tyrrell K, Najjar SS, Boudreau RM, Venkitachalam L, Kupelian V, Simonsick EM, Havlik R, Lakatta EG, Spurgeon H, Kritchevsky S, et al. Elevated aortic pulse wave velocity, a marker of arterial stiffness, predicts cardiovascular events in well-functioning older adults. Circulation. 2005;111:3384–90. doi: 10.1161/CIRCULATIONAHA.104.483628. - DOI - PubMed
MeSH terms
LinkOut - more resources
Full Text Sources
Other Literature Sources
Medical
Research Materials
Miscellaneous

