. 2018 Jan;188(1):111-124.
doi: 10.1016/j.ajpath.2017.09.009. Epub 2017 Oct 14.

Co-Localization of Insulin-Like Growth Factor Binding Protein-1, Casein Kinase-2β, and Mechanistic Target of Rapamycin in Human Hepatocellular Carcinoma Cells as Demonstrated by Dual Immunofluorescence and in Situ Proximity Ligation Assay

Affiliations

Co-Localization of Insulin-Like Growth Factor Binding Protein-1, Casein Kinase-2β, and Mechanistic Target of Rapamycin in Human Hepatocellular Carcinoma Cells as Demonstrated by Dual Immunofluorescence and in Situ Proximity Ligation Assay

Sahil S Singal et al. Am J Pathol. 2018 Jan.

Abstract

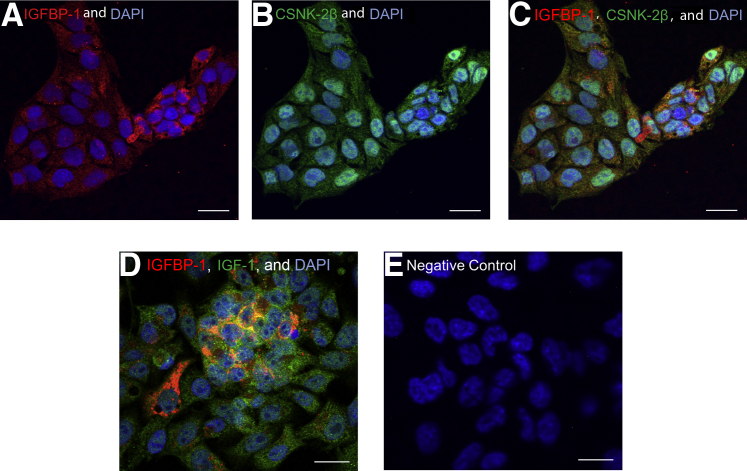
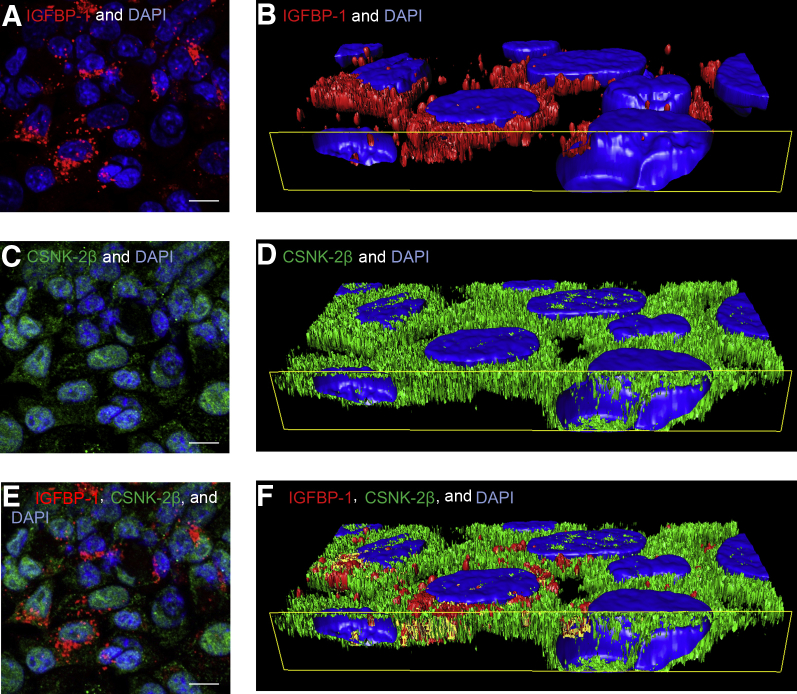
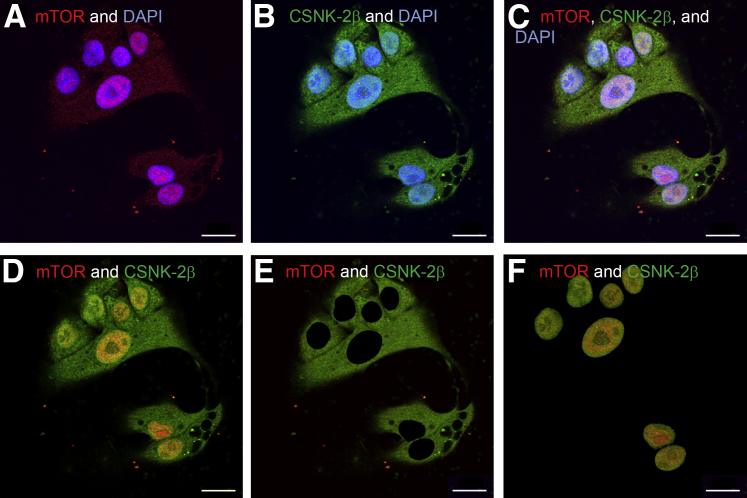
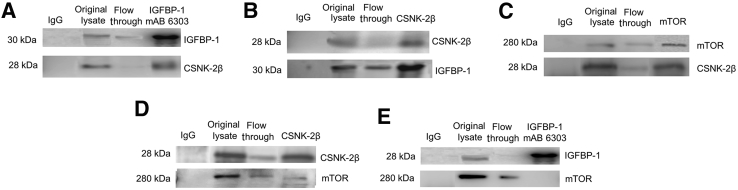
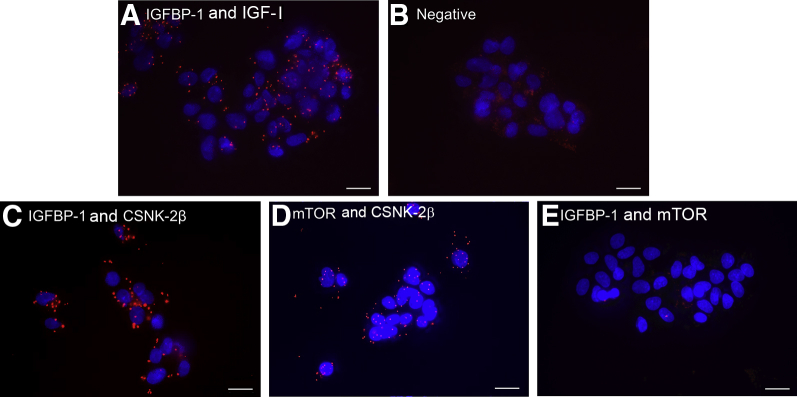
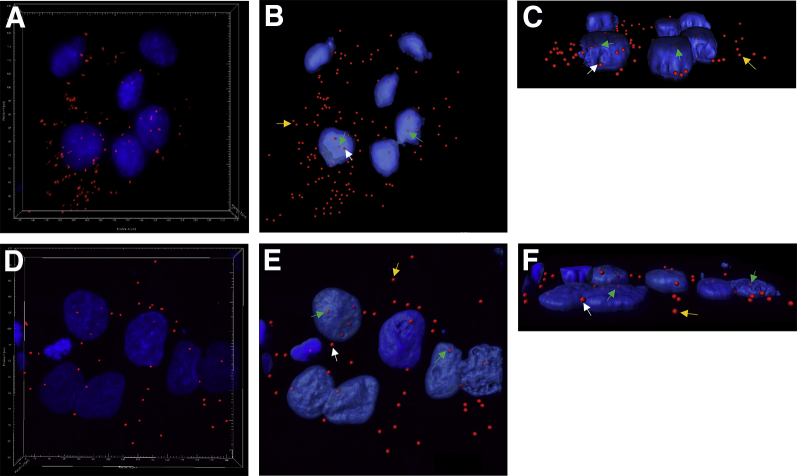
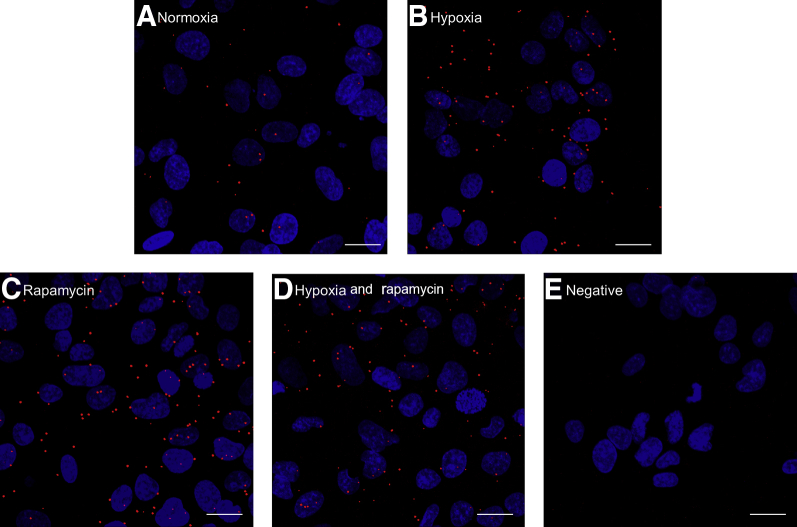
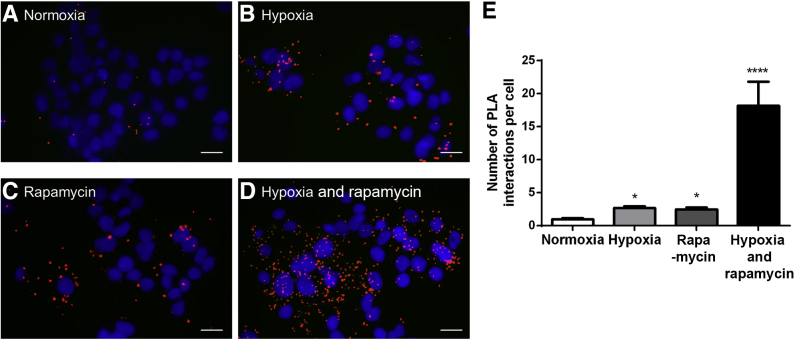
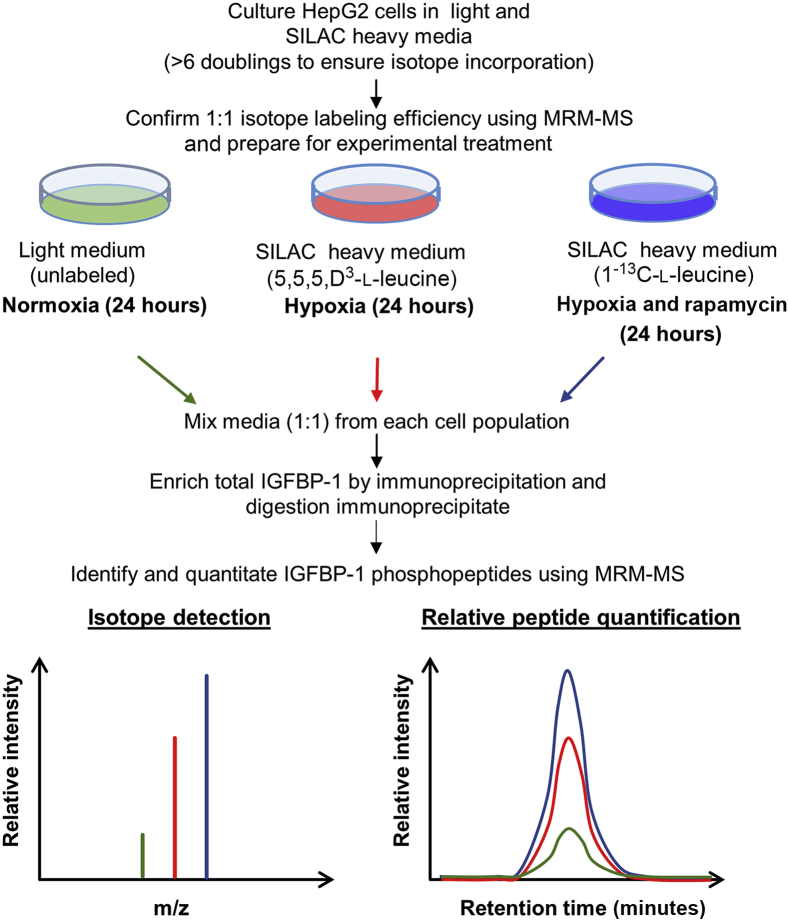
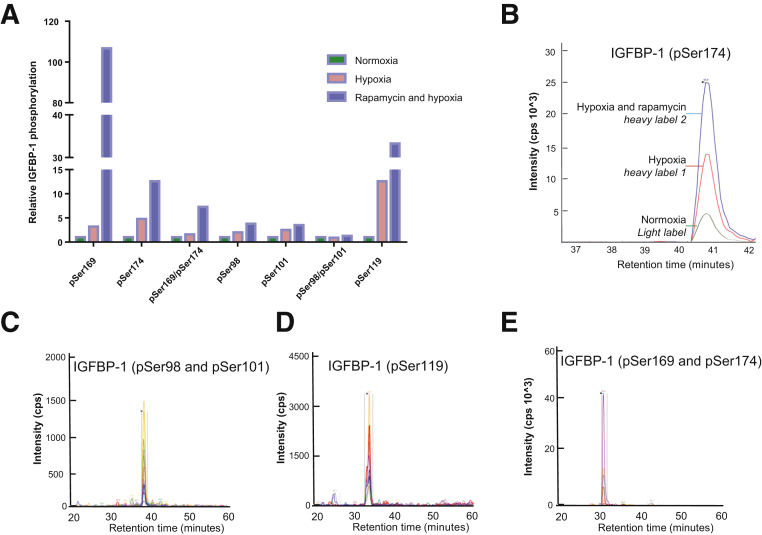
Insulin-like growth factor binding protein (IGFBP)-1 influences fetal growth by modifying insulin-like growth factor-I (IGF-I) bioavailability. IGFBP-1 phosphorylation, which markedly increases its affinity for IGF-I, is regulated by mechanistic target of rapamycin (mTOR) and casein kinase (CSNK)-2. However, the underlying molecular mechanisms remain unknown. We examined the cellular localization and potential interactions of IGFBP-1, CSNK-2β, and mTOR as a prerequisite for protein-protein interaction. Analysis of dual immunofluorescence images indicated a potential perinuclear co-localization between IGFBP-1 and CSNK-2β and a nuclear co-localization between CSNK-2β and mTOR. Proximity ligation assay (PLA) indicated proximity between IGFBP-1 and CSNK-2β as well as mTOR and CSNK-2β but not between mTOR and IGFBP-1. Three-dimensional rendering of the PLA images validated that IGFBP-1 and CSNK-2β interactions were in the perinuclear region and mTOR and CSNK-2β interactions were also predominantly perinuclear rather than nuclear as indicated by mTOR and CSNK-2β co-localization. Compared with control, hypoxia and rapamycin treatment showed markedly amplified PLA signals for IGFBP-1 and CSNK-2β (approximately 18-fold, P = 0.0002). Stable isotope labeling with multiple reaction monitoring-mass spectrometry demonstrated that hypoxia and rapamycin treatment increased IGFBP-1 phosphorylation at Ser98/Ser101/Ser119/Ser174 but most considerably (106-fold) at Ser169. We report interactions between CSNK-2β and IGFBP-1 as well as mTOR and CSNK-2β, providing strong evidence of a mechanistic link between mTOR and IGF-I signaling, two critical regulators of cell growth via CSNK-2.


Figures

Figure 1
Figure 1
Dual immunofluorescence staining for the co-localization of insulin-like growth factor (IGF) binding protein (IGFBP)-1 and casein kinase (CSNK)-2β. Human hepatocellular carcinoma (HepG2) cells were stained with anti-mouse IGFBP-1 (monoclonal antibody 6303), anti-rabbit IGF-I, and anti-rabbit CSNK-2β antibodies. Corresponding secondary antibodies were Alexa anti-mouse 660 and anti-rabbit 568. Images were captured via confocal microscopy. A and B: IGFBP-1 (red) is predominantly localized in the perinuclear region of the cells (A), whereas CSNK-2β (green) is detected throughout the cell (B). C: Merged channel image shows co-localization predominantly in the perinuclear region (yellow). D: Co-localization of IGFBP-1 (red) and IGF-I (green) in HepG2 cells, indicating a positive control. E: Dual immunofluorescence with no primary antibodies depicting a negative control where no staining was visualized. Scale bars: 20 μm.
Figure 2
Figure 2
Localization of insulin-like growth factor binding protein (IGFBP)-1 and casein kinase (CSNK)-2β using Image Pro-Premier 3D software version 9.2 (Media Cybernetics). A, C, and E: After performing dual immunofluorescence using anti-mouse IGFBP-1 (red) and anti-rabbit CSNK-2β (green) antibodies, we captured 63× magnified images on a confocal microscope. B, D, and F: To examine the localization of IGFBP-1 and CSNK-2β and their potential co-localization in HepG2 cells in more detail, iso-surface images were generated with Image Pro-Premier 3D software. Yellow rectangle outlines the cross section of the Z-stack–captured dual-immunofluorescence image. IGFBP-1 is present in the perinuclear region but not inside the nucleus; in addition, the abundance of IGFBP-1 appears to vary from cell to cell (B). CSNK-2β is clearly visualized throughout the cytosol and nucleus of HepG2 cells (D). Merged iso-surface image with the addition of a co-localization channel depicted as yellow, which is present in the perinuclear region of HepG2 cells (F). Scale bars: 10 μm.
Figure 3
Figure 3
Dual immunofluorescence staining for insulin-like growth factor binding protein (IGFBP)-1 expression in proliferating human hepatocellular carcinoma (HepG2) cells. HepG2 cells were stained with anti-mouse IGFBP-1 (monoclonal antibody 6303) and anti-rabbit Ki-67 antibodies. An antibody targeting Ki-67, a proliferation marker, was used to detect proliferating HepG2 cells. A: IGFBP-1 (red) abundance shows significant cell-to-cell variability. B: Ki-67 (green) identifies growing cells and is clearly present in the nucleus. C: Merged channel image clearly depicts that Ki-67–positive HepG2 cells do not express high amounts of IGFBP-1. Scale bars: 20 μm.
Figure 4
Figure 4
Dual immunofluorescence staining for the co-localization of mechanistic target of rapamycin (mTOR) and casein kinase (CSNK)-2β. Human hepatocellular carcinoma cells were stained with anti-mouse mTOR and anti-rabbit CSNK-2β antibodies. Corresponding secondary antibodies were Alexa anti-mouse 568 and Alexa anti-rabbit 660, respectively. Images were captured via confocal microscopy. A: mTOR (red) is present throughout the cell but most abundant in the nucleus. B: CSNK-2β (green) is found throughout the cell. C: Merged channel image shows co-localization (yellow). D: Because DAPI staining obscured the depiction of yellow co-localization, dual-immunofluorescence staining is visualized without DAPI. E: To determine the cytosolic co-localization of mTOR and CSNK-2β, we subtracted the positive DAPI staining area from the whole cell image. F: With the use of the positive DAPI stain, nuclear co-localization of mTOR and CSNK-2β is observed. Scale bars: 20 μm.
Figure 5
Figure 5
Co-immunoprecipitation suggests interactions between insulin-like growth factor binding protein (IGFBP)-1 and casein kinase (CSNK)-2β as well as mechanistic target of rapamycin (mTOR) and CSNK-2 in human hepatocellular carcinoma (HepG2) cell lysate. A: HepG2 cell lysates were immunoprecipitated using IGFBP-1 [monoclonal antibody (mAb) 6303] antibody. The immunoprecipitated proteins were tested on Western blot for IGFBP-1 using IGFBP-1 polyclonal antibody and CSNK-2β antibody. Immunoprecipitation with mAb 6303 co-immunoprecipitates CSNK-2β. B: HepG2 cell lysates were immunoprecipitated using CSNK-2β antibody. The immunoprecipitated proteins were tested on Western blots for IGFBP-1 using IGFBP-1 polyclonal antibody or CSNK-2β. Immunoprecipitation with CSNK-2β co-immunoprecipitates IGFBP-1. C: HepG2 cell lysates were immunoprecipitated using anti-human mTOR monoclonal antibody. The immunoprecipitated proteins were tested on Western blots for mTOR and CSNK-2β. Immunoprecipitation with mTOR antibody co-immunoprecipitates CSNK-2β. D: HepG2 cell lysates were immunoprecipitated using CSNK-2β antibody. The immunoprecipitated proteins were tested on Western blot for mTOR and CSNK-2β. Immunoprecipitation with CSNK-2β co-immunoprecipitates mTOR. E: HepG2 cell lysates were immunoprecipitated using IGFBP-1 (mAb 6303) antibody. The immunoprecipitated proteins were tested on Western blot for mTOR and IGFBP-1. Immunoprecipitation with IGFBP-1 mAb 6303 does not co-immunoprecipitate mTOR.
Figure 6
Figure 6
Interactions of insulin-like growth factor (IGF) binding protein (IGFBP)-1 with mechanistic target of rapamycin (mTOR) and casein kinase (CSNK)-2β visualized by proximity ligation assay (PLA). Representative PLA images where the PLA signal (red) represents close proximity (<40 nm) between two proteins. A: IGFBP-1 interaction with its ligand IGF-I serving as a positive control. B: Without primary antibodies, no PLA signal is observed. C and D: Representative PLA images of IGFBP-1 and CSNK-2β (C) and mTOR and CSNK-2β (D) showing a distinct PLA signal, suggesting interaction among these proteins. E: No signal is visible when PLA targeted IGFBP-1 and mTOR, suggesting minimal interaction between these two proteins. Scale bars: 20 μm.
Figure 7
Figure 7
Three-dimensional rendering of proximity ligation assay (PLA) signals. Representative images of PLA targeting casein kinase (CSNK)-2β and insulin-like growth factor binding protein (IGFBP)-1 in human hepatocellular carcinoma (HepG2) cells demonstrate that the signal is predominantly extranuclear: A: Confocal image of PLA signal from CSNK-2β and IGFBP-1. B: Transparent iso-surface of nuclear outline reveals PLA signals in cytoplasmic area. C: Rotated IGFBP-1/CSNK-2β. Representative images of CSNK-2β and mechanistic target of rapamycin (mTOR) interaction in HepG2 cells demonstrates that the PLA signal is predominantly extranuclear. D: Confocal image of PLA signals in CSNK-2β and mTOR. E: Transparent iso-surface of nuclear outline reveals most PLA spots in extra nuclear location relative to the nucleus. F: Rotated mTOR and CSNK-2β. White arrows indicate perinuclear PLA interactions; gold arrows, cytosolic interactions; and green arrows, nuclear interactions. Original magnification, ×40.
Figure 8
Figure 8
Effects of hypoxia, rapamycin, and hypoxia and rapamycin on the interaction between casein kinase (CSNK)-2β and mechanistic target of rapamycin (mTOR) as visualized by proximity ligation assay (PLA). Representative images of CSNK-2β and mTOR interaction in human hepatocellular carcinoma cells under normoxia (A), hypoxia (B), rapamycin (C), hypoxia and rapamycin (D), and negative control depicting no positive PLA interaction (E). Compared with control (normoxia), hypoxia, rapamycin, or combined hypoxia and rapamycin results in a stronger PLA signal, consistent with an increased interaction between these two proteins in these conditions. Scale bars: 20 μm.
Figure 9
Figure 9
The change in casein kinase (CSNK)-2β and insulin-like growth factor binding protein (IGFBP)-1 interaction when exposed to hypoxia, rapamycin, and hypoxia and rapamycin treatments visualized by proximity ligation assay (PLA). A–D: Representative images of CSNK-2β and IGFBP-1 interaction in human hepatocellular carcinoma cells under normoxia (A), hypoxia (B), rapamycin (C), and hypoxia and rapamycin (D). E: Hypoxia combined with rapamycin treatment markedly increases CSNK-2β and IGFBP-1 interaction. Data are expressed as means ± SEM (E). P < 0.05, ∗∗∗∗P < 0.0001. Scale bars: 20 μm.
Figure 10
Figure 10
Schematic of the stable isotope labeling with amino acids in cell culture (SILAC) experiment. The light and two heavy cell populations were treated with hypoxia or hypoxia and rapamycin combined and processed together to measure the heavy to light peptide signal ratios. HepG2, human hepatocellular carcinoma; IGFBP-1, insulin-like growth factor binding protein 1; m/z, mass to charge ratio; MRM-MS, multiple reaction monitoring–mass spectrometry.
Figure 11
Figure 11
Stable isotope labeling with amino acids in cell culture (SILAC) combined with quantitative multiple reaction monitoring–mass spectrometry of insulin-like growth factor binding protein (IGFBP)-1 phosphorylation sites under hypoxia and rapamycin treatments. Human hepatocellular carcinoma cells were grown in regular Dulbecco's modified Eagle's medium/F12 media supplemented with 10% dialyzed fetal bovine serum (control) or grown in SILAC media that contained 5,5,5,D3-l-leucine or 1-1-13C-l-leucine stabile isotope labels. A: Histogram comparing the phosphopeptide intensity of each single or multiple IGFBP-1 phosphorylation sites among experimental conditions. The data are representative of one experiment from pooled 3 mL of media from the three treatments (unlabeled control, 5,5,5,D3-l-leucine–labeled hypoxia, and 1-13C-l-leucine–labeled hypoxia and rapamycin). B: Representative histogram of overlaid total peptide transitions from the three isotope labels and corresponding treatments for the novel IGFBP-1 Ser174 phosphorylated peptide. C–E: Examples of the extracted ion chromatographs showing the optimized transitions used to validate the phosphorylation at Ser98/Ser101 (C), Ser119 (D), and Ser169/Ser174 (E) in the singly or doubly phosphorylated peptides. All mass spectrometry was performed using QTRAP 4000 (AB Sciex, Concord, ON, Canada) with Q3 used as a linear ion trap. p-, phosphorylated.

References

    1. Han V.K., Matsell D.G., Delhanty P.J., Hill D.J., Shimasaki S., Nygard K. IGF-binding protein mRNAs in the human fetus: tissue and cellular distribution of developmental expression. Horm Res. 1996;45:160–166. - PubMed
    1. Jones J.I., Busby W.H., Jr., Wright G., Clemmons D.R. Human IGFBP-1 is phosphorylated on 3 serine residues: effects of site-directed mutagenesis of the major phosphoserine. Growth Regul. 1993;3:37–40. - PubMed
    1. Martina N.A., Kim E., Chitkara U., Wathen N.C., Chard T., Giudice L.C. Gestational age-dependent expression of insulin-like growth factor-binding protein-1 (IGFBP-1) phosphoisoforms in human extraembryonic cavities, maternal serum, and decidua suggests decidua as the primary source of IGFBP-1 in these fluids during early pregnancy. J Clin Endocrinol Metab. 1997;82:1894–1898. - PubMed
    1. Abu Shehab M., Khosravi J., Han V.K., Shilton B.H., Gupta M.B. Site-specific IGFBP-1 hyper-phosphorylation in fetal growth restriction: clinical and functional relevance. J Proteome Res. 2010;9:1873–1881. - PubMed
    1. Nissum M., Abu Shehab M., Sukop U., Khosravi J.M., Wildgruber R., Eckerskorn C., Han V.K., Gupta M.B. Functional and complementary phosphorylation state attributes of human insulin-like growth factor-binding protein-1 (IGFBP-1) isoforms resolved by free flow electrophoresis. Mol Cell Proteomics. 2009;8:1424–1435. - PMC - PubMed

MeSH terms

Substances