

Plasmodium falciparum PfEMP1 Modulates Monocyte/Macrophage Transcription Factor Activation and Cytokine and Chemokine Responses
- PMID: 29038124
- PMCID: PMC5736827
- DOI: 10.1128/IAI.00447-17
Plasmodium falciparum PfEMP1 Modulates Monocyte/Macrophage Transcription Factor Activation and Cytokine and Chemokine Responses
Abstract
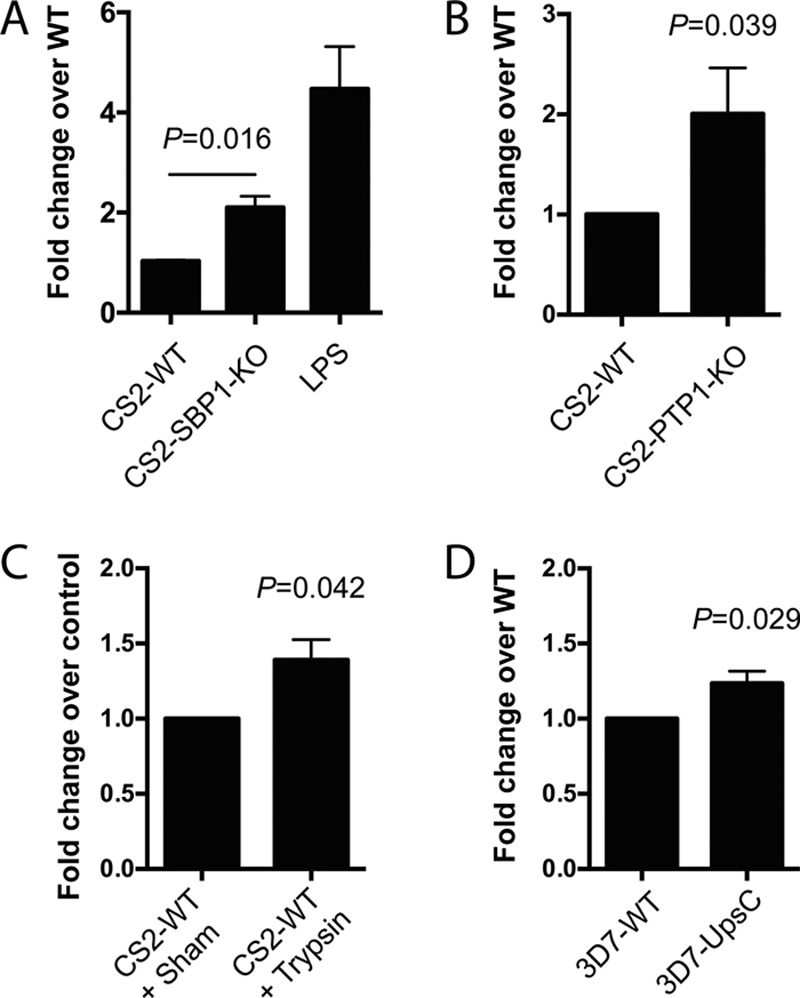
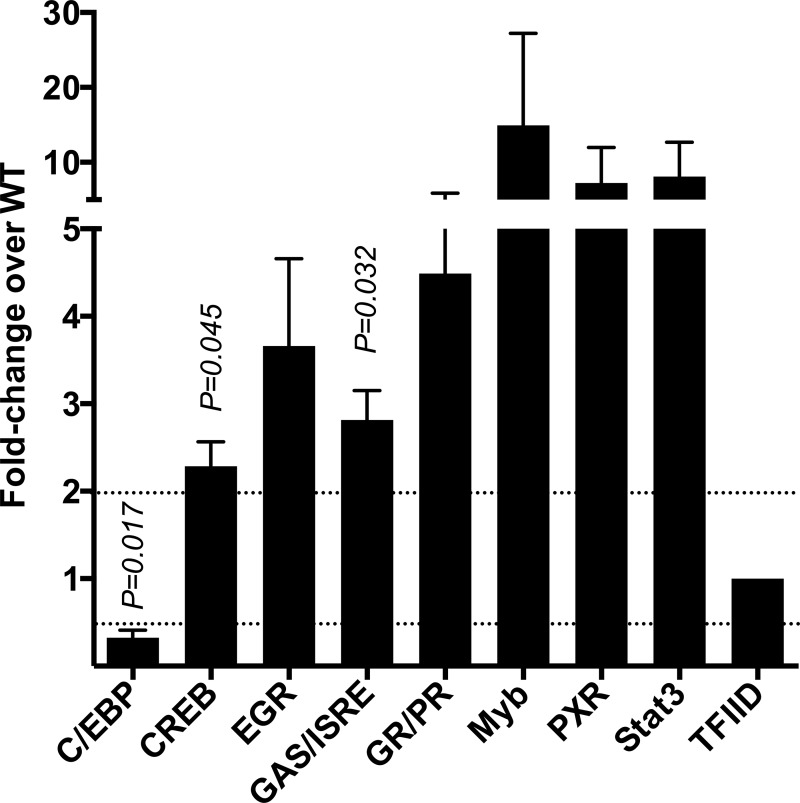
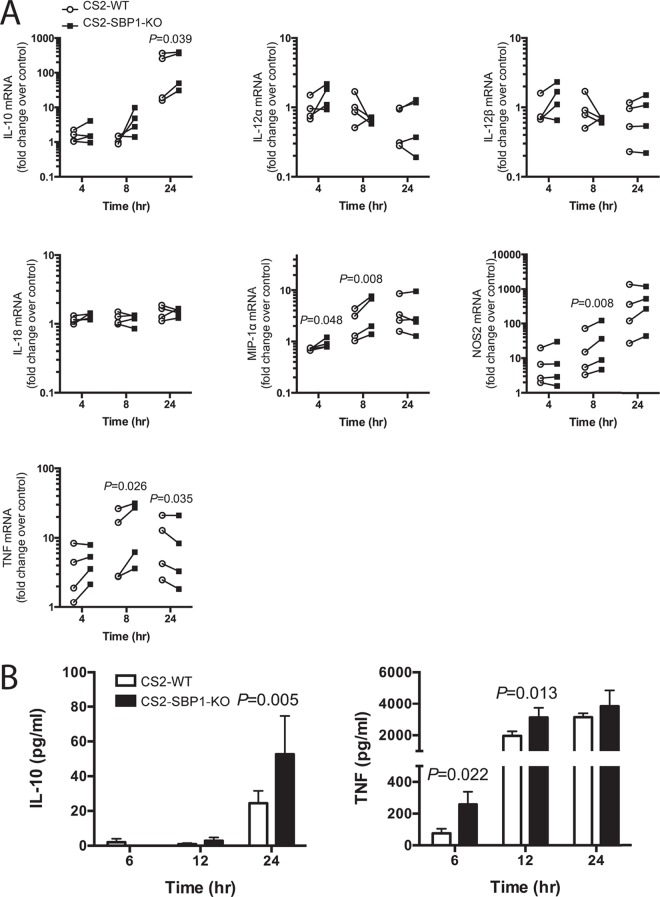
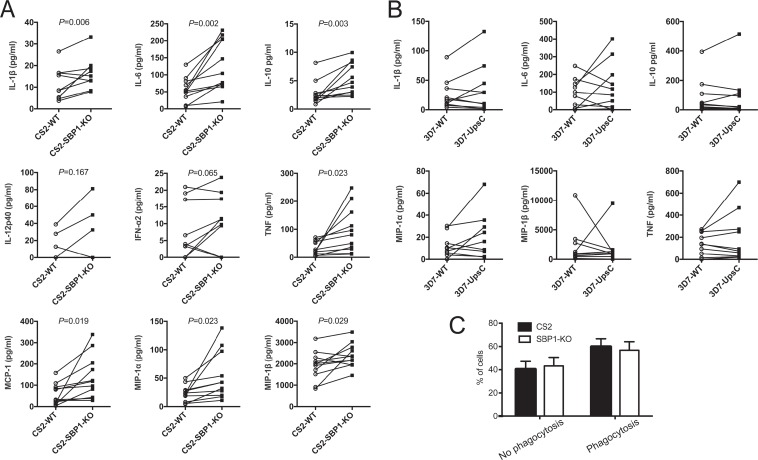
Immunity to Plasmodium falciparum malaria is slow to develop, and it is often asserted that malaria suppresses host immunity, although this is poorly understood and the molecular basis for such activity remains unknown. P. falciparum erythrocyte membrane protein 1 (PfEMP1) is a virulence factor that plays a key role in parasite-host interactions. We investigated the immunosuppressive effect of PfEMP1 on monocytes/macrophages, which are central to the antiparasitic innate response. RAW macrophages and human primary monocytes were stimulated with wild-type 3D7 or CS2 parasites or transgenic PfEMP1-null parasites. To study the immunomodulatory effect of PfEMP1, transcription factor activation and cytokine and chemokine responses were measured. The level of activation of NF-κB was significantly lower in macrophages stimulated with parasites that express PfEMP1 at the red blood cell surface membrane than in macrophages stimulated with PfEMP1-null parasites. Modulation of additional transcription factors, including CREB, also occurred, resulting in reduced immune gene expression and decreased tumor necrosis factor (TNF) and interleukin-10 (IL-10) release. Similarly, human monocytes released less IL-1β, IL-6, IL-10, monocyte chemoattractant protein 1 (MCP-1), macrophage inflammatory protein 1α (MIP-1α), MIP-1β, and TNF specifically in response to VAR2CSA PfEMP1-containing parasites than in response to PfEMP1-null parasites, suggesting that this immune regulation by PfEMP1 is important in naturally occurring infections. These results indicate that PfEMP1 is an immunomodulatory molecule that affects the activation of a range of transcription factors, dampening cytokine and chemokine responses. Therefore, these findings describe a potential molecular basis for immune suppression by P. falciparum.
Keywords: NF-κB; PfEMP1; Plasmodium falciparum; cytokines; immunosuppression; innate immunity; macrophages; malaria; monocytes; transcription factors.
Copyright © 2017 Sampaio et al.
Figures

Similar articles
-
B-cell responses to pregnancy-restricted and -unrestricted Plasmodium falciparum erythrocyte membrane protein 1 antigens in Ghanaian women naturally exposed to malaria parasites.Infect Immun. 2014 May;82(5):1860-71. doi: 10.1128/IAI.01514-13. Epub 2014 Feb 24. Infect Immun. 2014. PMID: 24566620 Free PMC article.
-
Dissection of the role of PfEMP1 and ICAM-1 in the sensing of Plasmodium-falciparum-infected erythrocytes by natural killer cells.PLoS One. 2007 Feb 21;2(2):e228. doi: 10.1371/journal.pone.0000228. PLoS One. 2007. PMID: 17311092 Free PMC article.
-
Extracellular vesicles from early stage Plasmodium falciparum-infected red blood cells contain PfEMP1 and induce transcriptional changes in human monocytes.Cell Microbiol. 2018 May;20(5):e12822. doi: 10.1111/cmi.12822. Epub 2018 Feb 15. Cell Microbiol. 2018. PMID: 29349926
-
PfEMP1 - A Parasite Protein Family of Key Importance in Plasmodium falciparum Malaria Immunity and Pathogenesis.Adv Parasitol. 2015 Apr;88:51-84. doi: 10.1016/bs.apar.2015.02.004. Epub 2015 Mar 23. Adv Parasitol. 2015. PMID: 25911365 Review.
-
PfEMP1: an antigen that plays a key role in the pathogenicity and immune evasion of the malaria parasite Plasmodium falciparum.Int J Biochem Cell Biol. 2009 Jul;41(7):1463-6. doi: 10.1016/j.biocel.2008.12.012. Epub 2008 Dec 25. Int J Biochem Cell Biol. 2009. PMID: 19150410 Review.
Cited by
-
Target acquired: transcriptional regulators as drug targets for protozoan parasites.Int J Parasitol. 2021 Jul;51(8):599-611. doi: 10.1016/j.ijpara.2020.12.007. Epub 2021 Mar 13. Int J Parasitol. 2021. PMID: 33722681 Free PMC article. Review.
-
Cerebral Plasmodium falciparum malaria: The role of PfEMP1 in its pathogenesis and immunity, and PfEMP1-based vaccines to prevent it.Immunol Rev. 2020 Jan;293(1):230-252. doi: 10.1111/imr.12807. Epub 2019 Sep 27. Immunol Rev. 2020. PMID: 31562653 Free PMC article. Review.
-
Epigenetic and transcriptional regulation of cytokine production by Plasmodium falciparum-exposed monocytes.Sci Rep. 2024 Feb 5;14(1):2949. doi: 10.1038/s41598-024-53519-w. Sci Rep. 2024. PMID: 38316918 Free PMC article.
-
Mechanisms for Host Immune Evasion Mediated by Plasmodium falciparum-Infected Erythrocyte Surface Antigens.Front Immunol. 2022 Jun 15;13:901864. doi: 10.3389/fimmu.2022.901864. eCollection 2022. Front Immunol. 2022. PMID: 35784341 Free PMC article. Review.
-
Low-Complexity Repetitive Epitopes of Plasmodium falciparum Are Decoys for Humoural Immune Responses.Front Immunol. 2020 Apr 15;11:610. doi: 10.3389/fimmu.2020.00610. eCollection 2020. Front Immunol. 2020. PMID: 32351503 Free PMC article.
References
-
- D'Ombrain MC, Robinson LJ, Stanisic DI, Taraika J, Bernard N, Michon P, Mueller I, Schofield L. 2008. Association of early interferon-gamma production with immunity to clinical malaria: a longitudinal study among Papua New Guinean children. Clin Infect Dis 47:1380–1387. doi:10.1086/592971. - DOI - PubMed
-
- Stanisic DI, Cutts J, Eriksson E, Fowkes FJI, Rosanas-Urgell A, Siba P, Laman M, Davis TME, Manning L, Mueller I, Schofield L. 2014. γδ T cells and CD14+ monocytes are predominant cellular sources of cytokines and chemokines associated with severe malaria. J Infect Dis 210:295–305. doi:10.1093/infdis/jiu083. - DOI - PubMed
Publication types
MeSH terms
Substances
LinkOut - more resources
Full Text Sources
Other Literature Sources
Research Materials
Miscellaneous
