. 2017 Dec 13;38(1):e00302-17.
doi: 10.1128/MCB.00302-17. Print 2018 Jan 1.

A High-Resolution Genome-Wide CRISPR/Cas9 Viability Screen Reveals Structural Features and Contextual Diversity of the Human Cell-Essential Proteome

Affiliations

A High-Resolution Genome-Wide CRISPR/Cas9 Viability Screen Reveals Structural Features and Contextual Diversity of the Human Cell-Essential Proteome

Thierry Bertomeu et al. Mol Cell Biol. .

Abstract

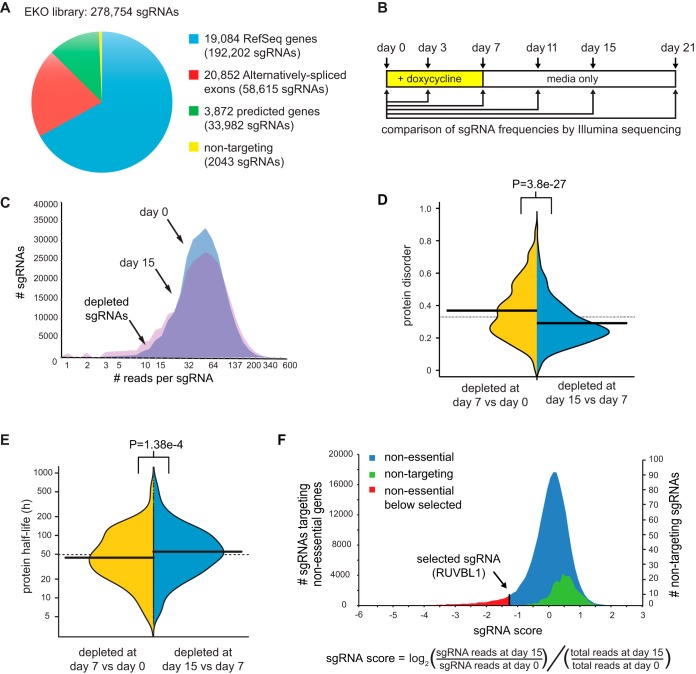
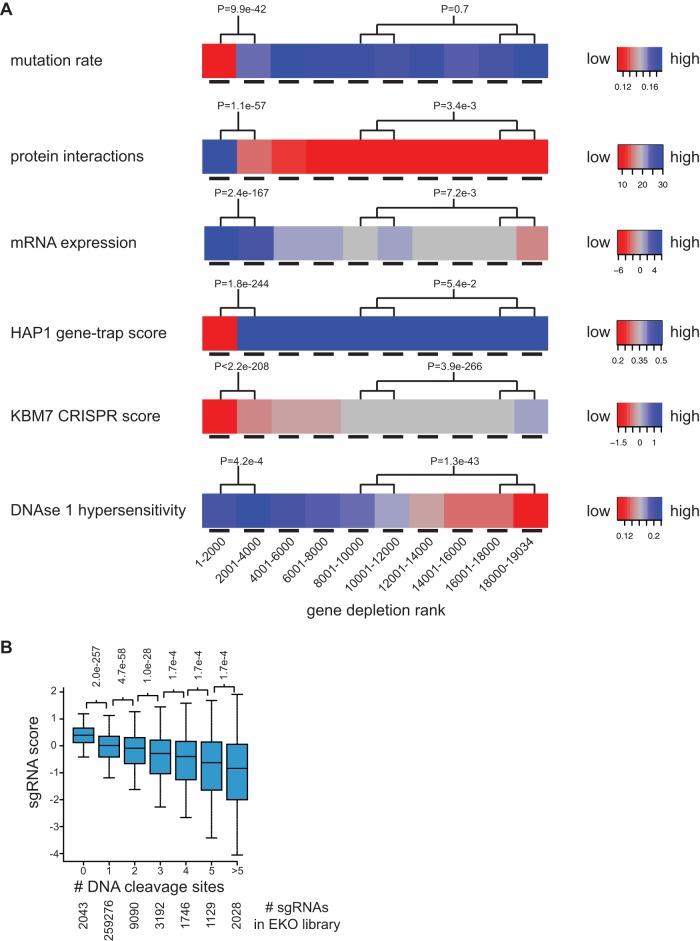
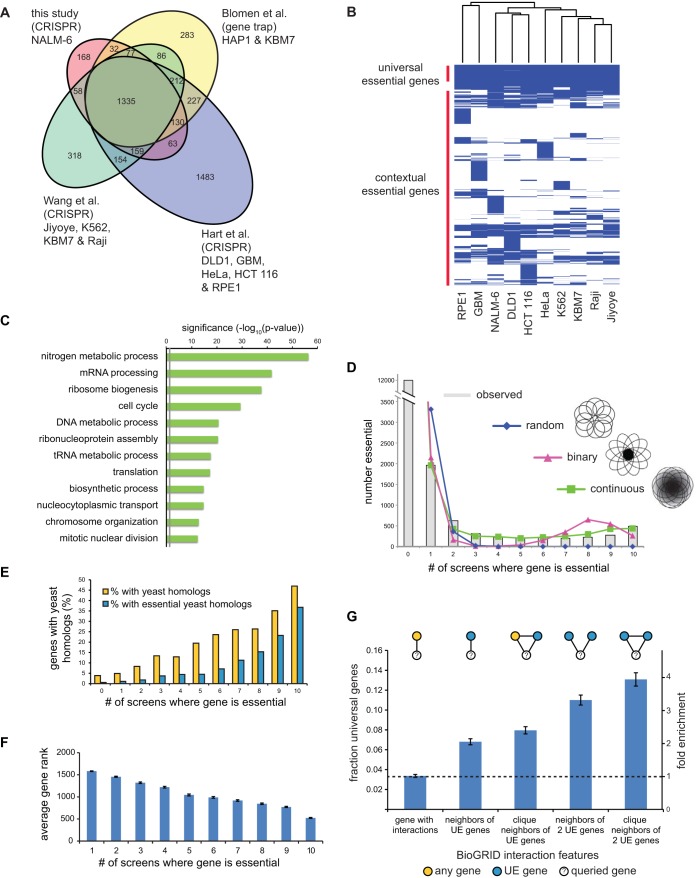
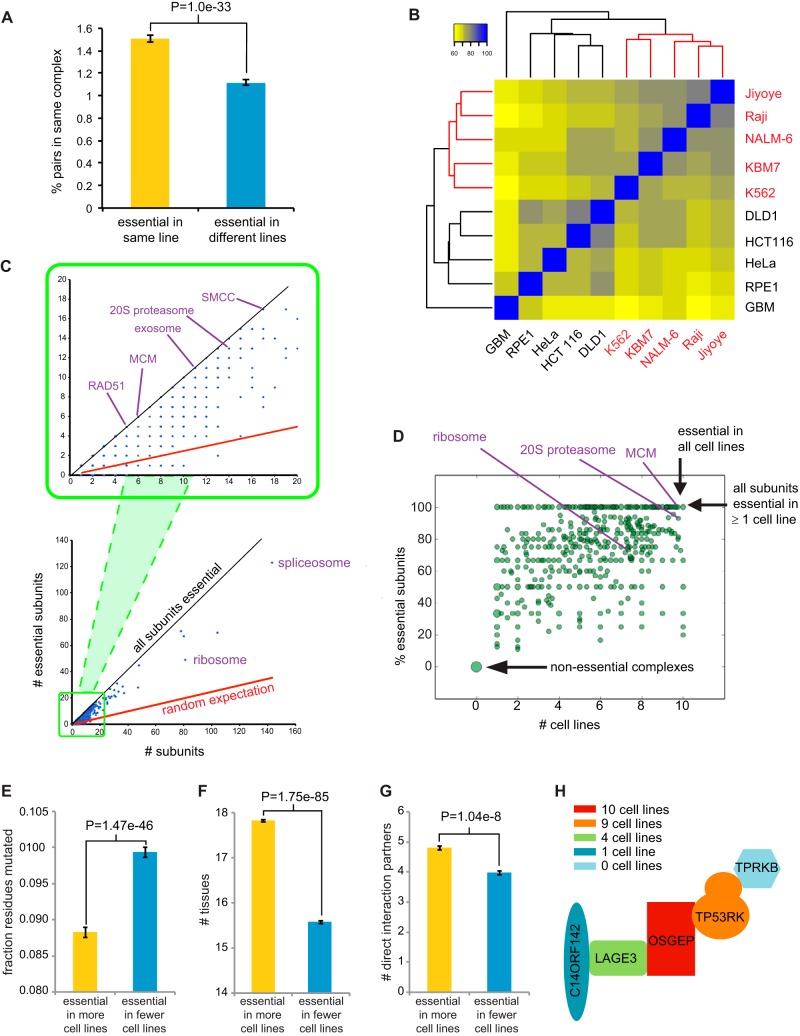
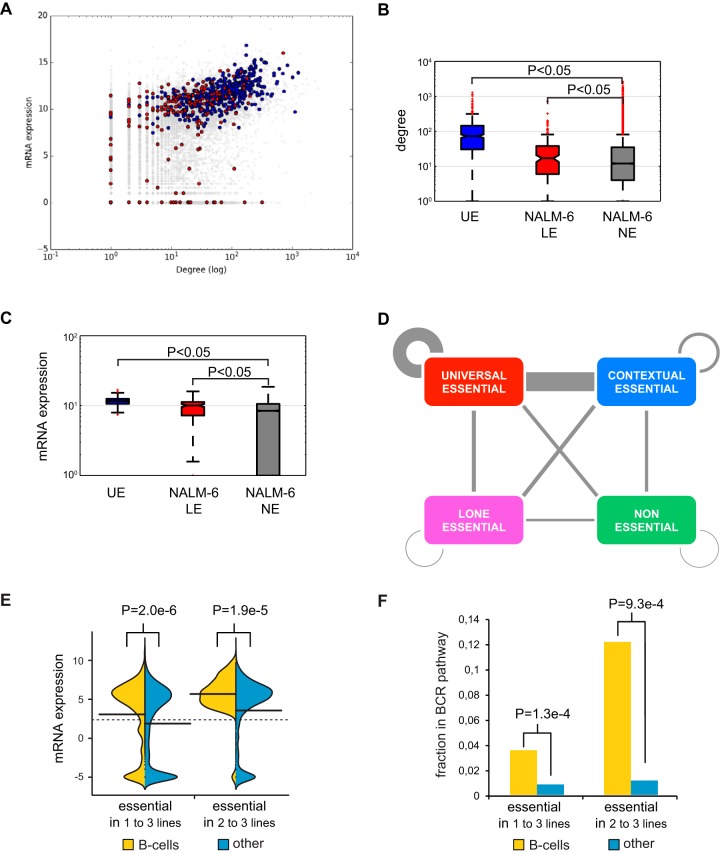
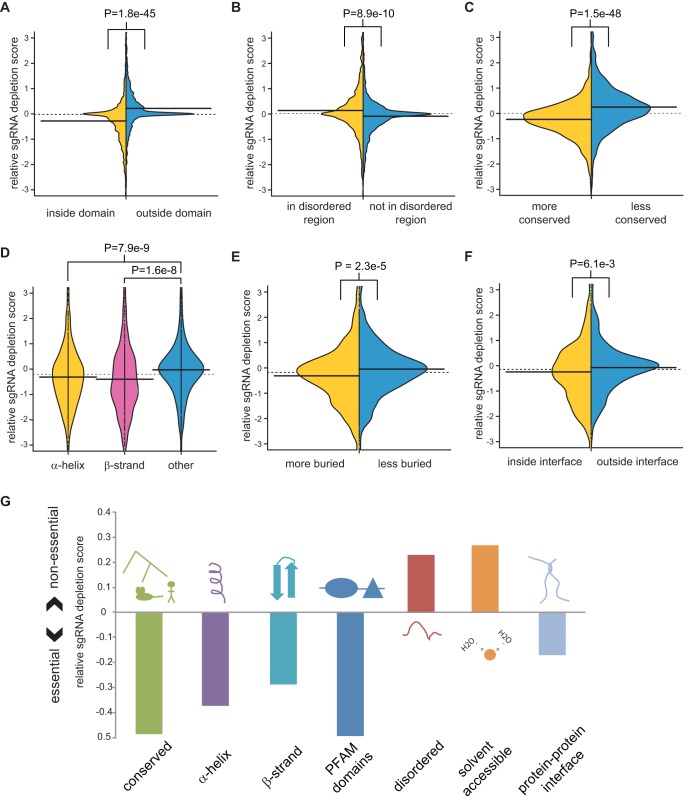
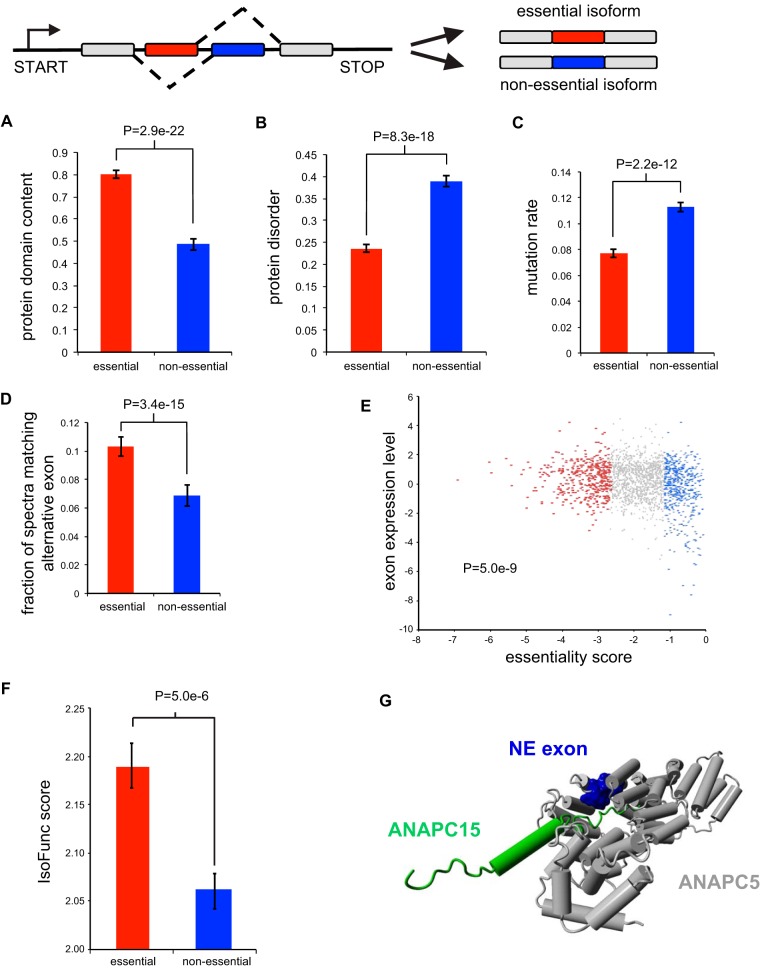
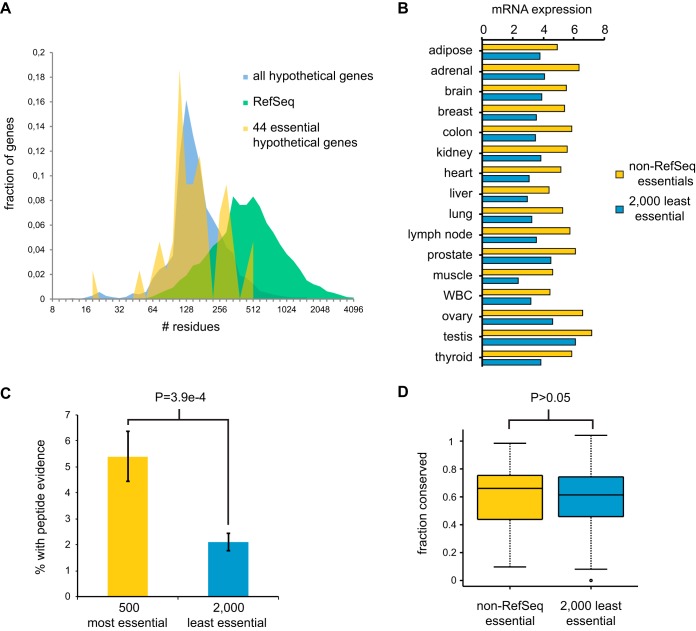
To interrogate genes essential for cell growth, proliferation and survival in human cells, we carried out a genome-wide clustered regularly interspaced short palindromic repeat (CRISPR)/Cas9 screen in a B-cell lymphoma line using a custom extended-knockout (EKO) library of 278,754 single-guide RNAs (sgRNAs) that targeted 19,084 RefSeq genes, 20,852 alternatively spliced exons, and 3,872 hypothetical genes. A new statistical analysis tool called robust analytics and normalization for knockout screens (RANKS) identified 2,280 essential genes, 234 of which were unique. Individual essential genes were validated experimentally and linked to ribosome biogenesis and stress responses. Essential genes exhibited a bimodal distribution across 10 different cell lines, consistent with a continuous variation in essentiality as a function of cell type. Genes essential in more lines had more severe fitness defects and encoded the evolutionarily conserved structural cores of protein complexes, whereas genes essential in fewer lines formed context-specific modules and encoded subunits at the periphery of essential complexes. The essentiality of individual protein residues across the proteome correlated with evolutionary conservation, structural burial, modular domains, and protein interaction interfaces. Many alternatively spliced exons in essential genes were dispensable and were enriched for disordered regions. Fitness defects were observed for 44 newly evolved hypothetical reading frames. These results illuminate the contextual nature and evolution of essential gene functions in human cells.

Keywords: CRISPR/Cas9; alternative splicing; gene essentiality; genetic screen; hypothetical gene; protein complex; proteome.


Figures

FIG 1
FIG 1
Genome-wide sgRNA library generation and screen for essential genes. (A) Composition of the EKO library. Note that some sgRNAs were used to evaluate both an alternative exon and the entire gene. (B) Experimental design for screen. A NALM-6 doxycycline-inducible Cas9 cell line was transduced with the EKO library at an MOI of ∼0.5, followed by sgRNA vector selection, population outgrowth, and determination of sgRNA frequencies at the indicated time points. (C) Number of sgRNA reads before doxycycline induction (day 0) superimposed on distributions after doxycycline induction (day 7) and after a further 8 days of outgrowth in medium only (day 15). A constant factor was used to center the two distributions. (D) Effect of protein intrinsic disorder on kinetics of sgRNA depletion. The average probability of disordered stretches over the entire protein as predicted by IUPred (76) for the 1,000 genes with most highly depleted sgRNAs at day 7 versus day 15 (two-tailed Wilcoxon test) is shown. (E) Effect of target protein half-life on kinetics of sgRNA depletion. The half-lives of mouse orthologs of the 1,000 most highly depleted genes after day 7 (n = 645) were compared to those after day 15 (n = 724). P value, two-tailed Wilcoxon test. (F) Distribution of log2 sgRNA frequency changes for day 0 versus day 15 for all previously described nonessential sgRNAs (22–24) compared to nontargeting sgRNAs in this study. An sgRNA targeting an essential gene in this study (RUVBL1) is shown for reference. Single-tailed P values for each sgRNA were calculated as the area under the curve of the control distribution to the left of the sgRNA score divided by the total area under the control curve.
FIG 2
FIG 2
Features correlated with gene depletion. (A) RefSeq genes were ranked in bins of 2,000 genes from most to least depleted sgRNAs. The mutation rate was the fraction of aligned residues that differed from the human sequence across 45 vertebrate species in a 46-way Multi-Z whole-genome alignment. Protein interaction was the number of partners reported in the BioGRID database (3.4.133 release). mRNA expression was the log2 RNA-seq reads per million in the NALM-6 cell line. The HAP1 gene trap score was the ratio of sense to antisense intronic insertions (24). The KBM7 CRISPR score was the average log2 read frequency change (22). DNase I hypersensitivity was the number of read peaks per kbp in naive B cells from ENCODE. (B) Correlation of gene depletion with potential sgRNA target sites. The log2 read frequency fold change for day 0 to day 15 was binned by number of perfect matches or single-base mismatches (within the first 12 bases of the sgRNA) to the human genome.
FIG 3
FIG 3
Universal essential genes. (A) Overlap between genes defined as essential in this study and three other studies (22–24). The indicated overlap is between all essential genes identified in each study, i.e., an amalgam across all cell lines, in order to assess interlibrary reproducibility. (B) Clustergram of essential genes across 10 different cell lines from the CRISPR screens in panel A. (C) Biological processes enriched in UE genes. (D) Number of essential genes shared between cell lines. Experimentally observed essential genes are shown as a histogram. The indicated models to account for shared essential genes were fitted using maximum likelihood. See the text for details. (E) Fraction of essential genes with orthologous nonessential or essential yeast genes as a function of cell line number. (F) Average essentiality rank of each essential gene as a function of cell line number. (G) Fraction and relative enrichment of UE proteins in specific protein-protein interaction network motifs from BioGRID.
FIG 4
FIG 4
Essential subunits of protein complexes. (A) Pairs of essential genes in the same cell line tend to encode subunits of the same protein complex compared to essential genes unique to different cell lines. All possible pairs of cell lines were sampled by randomly choosing two pairs of genes per sample, one in which each gene was essential in line 1 but not in line 2 and then one additional gene essential in line 2 but not line 1. The probability of the first and second genes belonging to the same complex and that of the first and third genes were estimated from 10 million trials. P value, Fisher's exact test. Self-interacting proteins were excluded. (B) Cell lines clustered as function of shared essential protein complexes. All protein complexes were taken from the CORUM database release 17.02.2012 (77) and are listed in Table S4 in the supplemental material. (C) Distribution of essential subunits in protein complexes. (D) Fraction of essential subunits as a function of cell line number. The dot size is proportional to the number of complexes. (E) Mean fraction of mutated residues across 45 vertebrate species for all pairs of proteins that are part of a common CORUM complex and essential in at least one cell line. P value, paired Wilcoxon rank sum test. (F) Expression of subunits of CORUM complexes across 30 different tissues types as function of essentiality. (G) Proximity of subunits with at least 4 mapped subunits in a common PDB structure as a function of essentiality. (H) Variable essentiality of subunits of the KEOPS complex (38).
FIG 5
FIG 5
Cell-type-specific essential genes. (A) Expression level as a function of protein interaction degree for essential genes unique to the NALM-6 screen (red) versus UE genes (blue). (B) Average interaction degree for proteins encoded by UE genes, LE genes in NALM-6, and NE genes. (C) Expression levels of UE genes, LE genes in NALM-6, and NE genes. (D) Interactions between UE, CE, LE, and NE proteins. Counts were normalized by number of genes and interactions per class. (E) mRNA expression in NALM-6 cells of essential genes either unique to one or more B-cell-derived cell lines or unique to an equivalent number of other cell lines. (F) Participation in the B-cell receptor (BCR) pathway of essential genes either unique to one or more B-cell-derived cell lines or unique to an equivalent number of other cell lines.
FIG 6
FIG 6
Correlation of sgRNA depletion with subgene- and protein-level features. The average log P values of sgRNAs linked to each feature were normalized to the gene average for all sgRNAs. (A) Overlap with Pfam domains. (B) Predicted protein disorder of >40% probability as determined by UIPred (76). (C) Protein-level conservation of a 30-residue window, either more conserved or less conserved than gene average. (D) Location of residues within an α-helix, an extended β-strand, or neither as annotated from PDB. (E) Residue burial, defined as the number of nonhydrogen atoms from nonadjacent residues present within 6 Å of the residue, for residues more or less buried than the average for the protein. (F) Residue proximity to a protein-protein interface. (G) Summary of protein-level features that influence sgRNA depletion from the library pool, as analyzed in panels A to F.
FIG 7
FIG 7
Alternatively spliced exons in essential genes. (A) Fraction of exons that overlap a Pfam domain (E value, <10−5) for essential exons (FDR < 0.05) and nonessential exons (FDR > 0.3) in essential genes. (B) Average IUPred predicted probability of exon residues belonging to a long disordered region. (C) Average fraction of residues mutated relative to human in 45 vertebrate species. (D) Fraction of matched mass spectra per alternative exon (FDR < 0.1) across a panel of human tissues. (E) Log2 RNA-seq read density in the exon normalized to gene average. (F) Average IsoFunc fold change, representing the likeliness that a specific isoform codes for a given GO function for isoforms of essential genes. (G) Nonessential alternative exon (blue) in the essential gene ANAPC5, within the anaphase-promoting complex/cyclosome, interacts with ANAPC15, a nonessential component (green) of the complex.
FIG 8
FIG 8
Essentiality-correlated features of predicted hypothetical genes. (A) ORF length distribution of RefSeq genes and hypothetical ORFs from AceView or GenCode covered by the EKO library. The 44 hypothetical ORFs with significant (FDR < 0.05) essentiality scores in the NALM-6 screen are indicated separately. For genes with multiple transcripts, only the length of the longest predicted protein was considered. (B) Mean log2 (reads/kilobase) across 16 tissues from the Human BodyMap 2.0 for 44 essential and the 2,000 least essential hypothetical genes. (C) Fraction of genes with uniquely matched mass spectra at an FDR of <0.001 for the 500 most essential and the 2,000 least essential hypothetical genes. (D) Fraction of residues conserved across 46 vertebrate genomes for the 44 essential and the 2,000 least essential hypothetical genes.

References

    1. Giaever G, Chu AM, Ni L, Connelly C, Riles L, Veronneau S, Dow S, Lucau-Danila A, Anderson K, Andre B, Arkin AP, Astromoff A, El-Bakkoury M, Bangham R, Benito R, Brachat S, Campanaro S, Curtiss M, Davis K, Deutschbauer A, Entian KD, Flaherty P, Foury F, Garfinkel DJ, Gerstein M, Gotte D, Guldener U, Hegemann JH, Hempel S, Herman Z, Jaramillo DF, Kelly DE, Kelly SL, Kotter P, LaBonte D, Lamb DC, Lan N, Liang H, Liao H, Liu L, Luo C, Lussier M, Mao R, Menard P, Ooi SL, Revuelta JL, Roberts CJ, Rose M, Ross-Macdonald P, Scherens B, et al. . 2002. Functional profiling of the Saccharomyces cerevisiae genome. Nature 418:387–391. doi:10.1038/nature00935. - DOI - PubMed
    1. Hartman JLt, Garvik B, Hartwell L. 2001. Principles for the buffering of genetic variation. Science 291:1001–1004. doi:10.1126/science.291.5506.1001. - DOI - PubMed
    1. Tong AH, Evangelista M, Parsons AB, Xu H, Bader GD, Page N, Robinson M, Raghibizadeh S, Hogue CW, Bussey H, Andrews B, Tyers M, Boone C. 2001. Systematic genetic analysis with ordered arrays of yeast deletion mutants. Science 294:2364–2368. doi:10.1126/science.1065810. - DOI - PubMed
    1. Costanzo M, Baryshnikova A, Bellay J, Kim Y, Spear ED, Sevier CS, Ding H, Koh JL, Toufighi K, Mostafavi S, Prinz J, St Onge RP, VanderSluis B, Makhnevych T, Vizeacoumar FJ, Alizadeh S, Bahr S, Brost RL, Chen Y, Cokol M, Deshpande R, Li Z, Lin ZY, Liang W, Marback M, Paw J, San Luis BJ, Shuteriqi E, Tong AH, van Dyk N, Wallace IM, Whitney JA, Weirauch MT, Zhong G, Zhu H, Houry WA, Brudno M, Ragibizadeh S, Papp B, Pal C, Roth FP, Giaever G, Nislow C, Troyanskaya OG, Bussey H, Bader GD, Gingras AC, Morris QD, Kim PM, Kaiser CA, et al. . 2010. The genetic landscape of a cell. Science 327:425–431. doi:10.1126/science.1180823. - DOI - PMC - PubMed
    1. Costanzo M, VanderSluis B, Koch EN, Baryshnikova A, Pons C, Tan G, Wang W, Usaj M, Hanchard J, Lee SD, Pelechano V, Styles EB, Billmann M, van Leeuwen J, van Dyk N, Lin ZY, Kuzmin E, Nelson J, Piotrowski JS, Srikumar T, Bahr S, Chen Y, Deshpande R, Kurat CF, Li SC, Li Z, Usaj MM, Okada H, Pascoe N, San Luis BJ, Sharifpoor S, Shuteriqi E, Simpkins SW, Snider J, Suresh HG, Tan Y, Zhu H, Malod-Dognin N, Janjic V, Przulj N, Troyanskaya OG, Stagljar I, Xia T, Ohya Y, Gingras AC, Raught B, Boutros M, Steinmetz LM, Moore CL, Rosebrock AP, et al. . 2016. A global genetic interaction network maps a wiring diagram of cellular function. Science 353:aaf1420. doi:10.1126/science.aaf1420. - DOI - PMC - PubMed

LinkOut - more resources