. 2017 Dec 13;38(1):e00392-17.
doi: 10.1128/MCB.00392-17. Print 2018 Jan 1.

Systematic Analysis of Human Cells Lacking ATG8 Proteins Uncovers Roles for GABARAPs and the CCZ1/MON1 Regulator C18orf8/RMC1 in Macroautophagic and Selective Autophagic Flux

Affiliations

Systematic Analysis of Human Cells Lacking ATG8 Proteins Uncovers Roles for GABARAPs and the CCZ1/MON1 Regulator C18orf8/RMC1 in Macroautophagic and Selective Autophagic Flux

Laura Pontano Vaites et al. Mol Cell Biol. .

Abstract

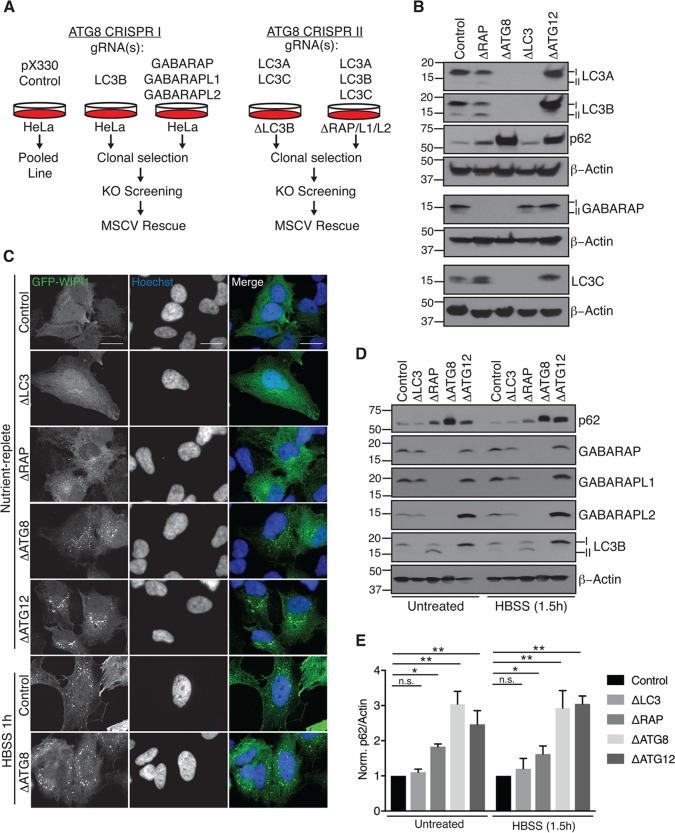
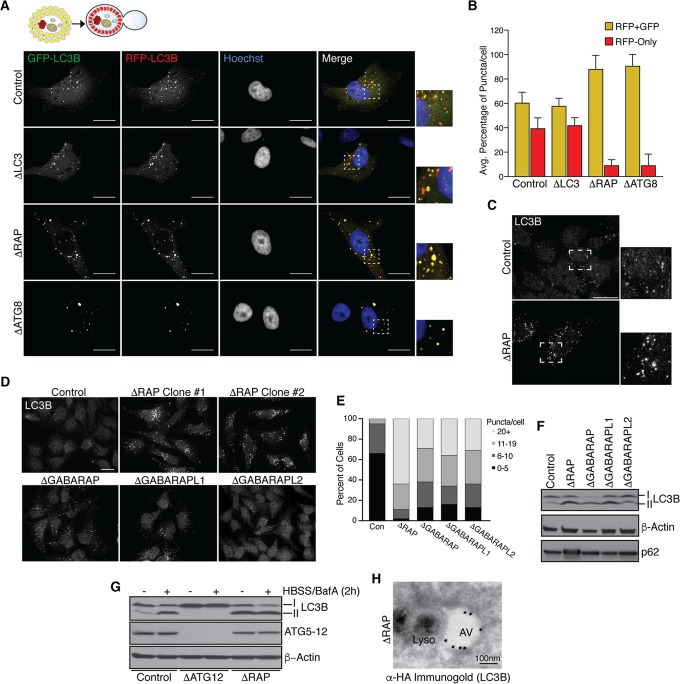
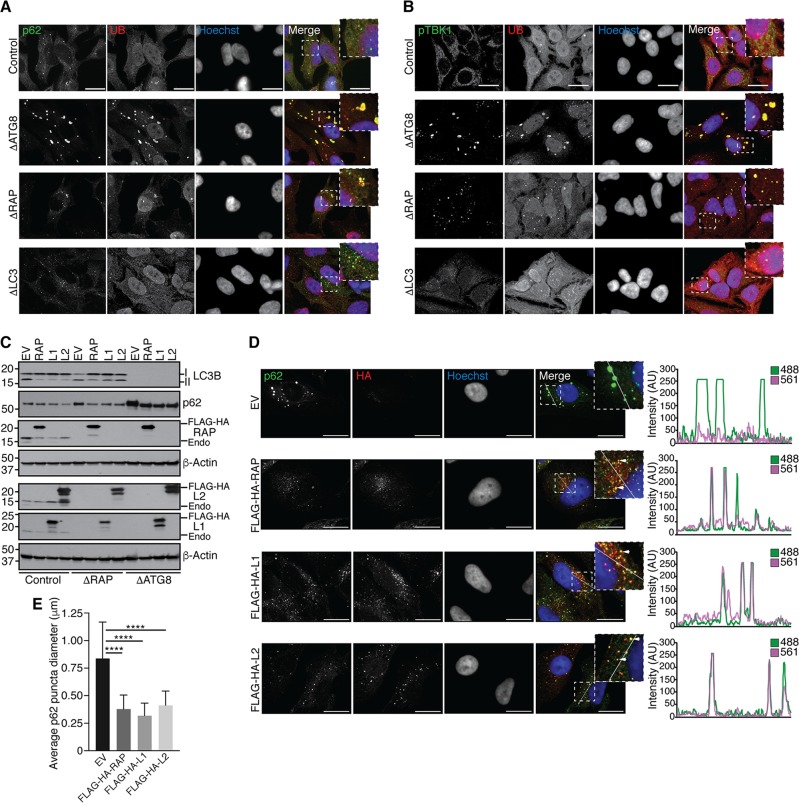
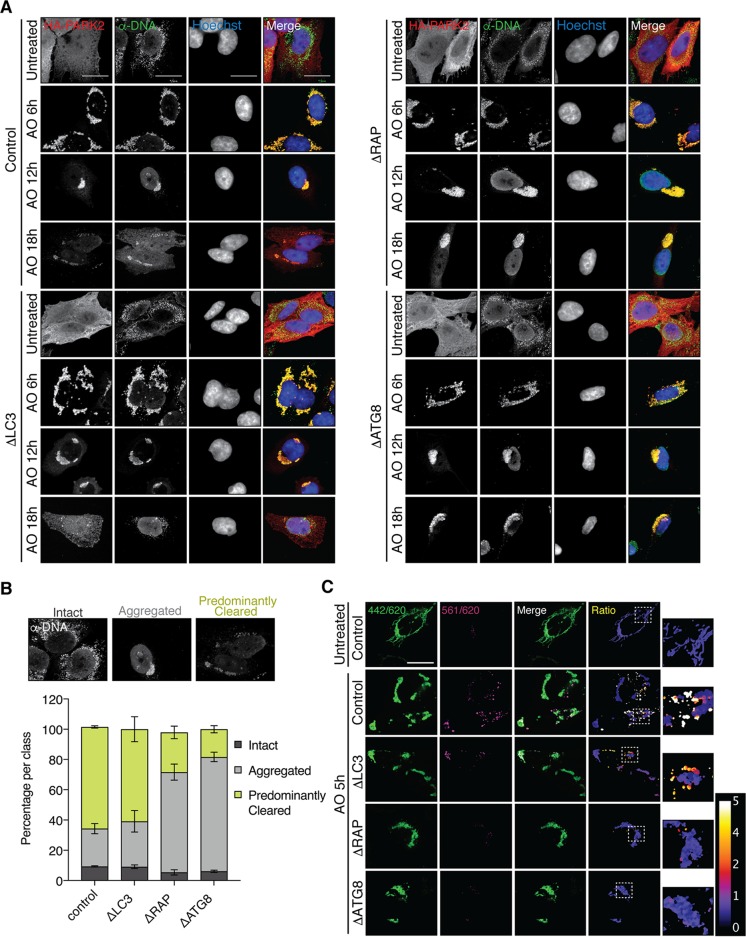
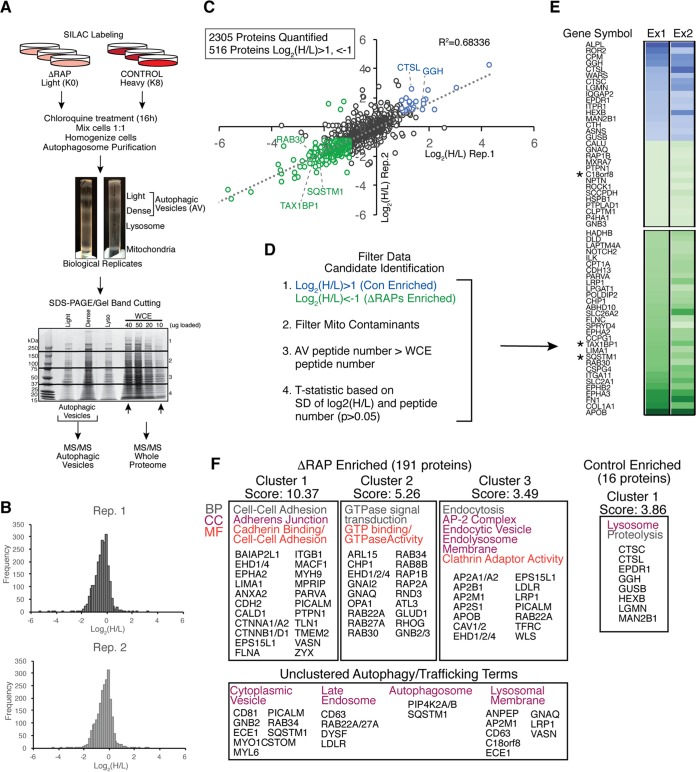
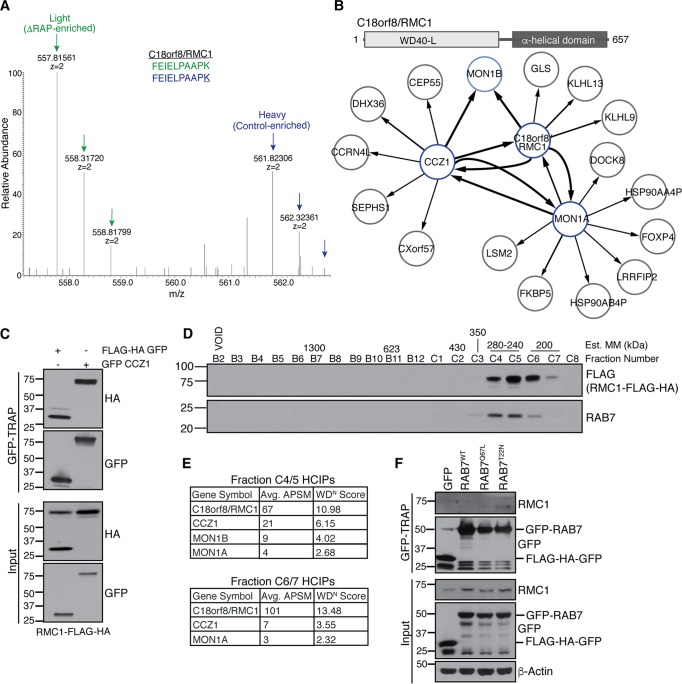
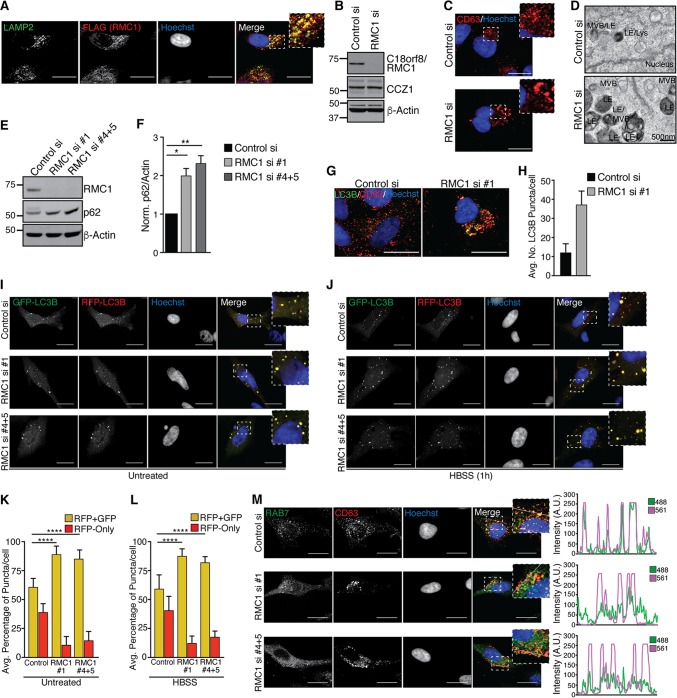
Selective autophagy and macroautophagy sequester specific organelles/substrates or bulk cytoplasm, respectively, inside autophagosomes as cargo for delivery to lysosomes. The mammalian ATG8 orthologues (MAP1LC3A/B/C and GABARAP/L1/L2) are ubiquitin (UB)-like proteins conjugated to the autophagosome membrane and are thought to facilitate cargo receptor recruitment, vesicle maturation, and lysosomal fusion. To elucidate the molecular functions of the ATG8 proteins, we engineered cells lacking genes for each subfamily as well as all six mammalian ATG8s. Loss of GABARAPs alone attenuates autophagic flux basally and in response to macroautophagic or selective autophagic stimuli, including parkin-dependent mitophagy, and cells lacking all ATG8 proteins accumulate cytoplasmic UB aggregates, which are resolved following ectopic expression of individual GABARAPs. Autophagosomes from cells lacking GABARAPs had reduced lysosomal content by quantitative proteomics, consistent with fusion defects, but accumulated regulators of late endosome (LE)/autophagosome maturation. Through interaction proteomics of proteins accumulating in GABARAP/L1/L2-deficient cells, we identified C18orf8/RMC1 as a new subunit of the CCZ1-MON1 RAB7 guanine exchange factor (GEF) that positively regulates RAB7 recruitment to LE/autophagosomes. This work defines unique roles for GABARAP and LC3 subfamilies in macroautophagy and selective autophagy and demonstrates how analysis of autophagic machinery in the absence of flux can identify new regulatory circuits.

Keywords: ATG8; autophagosome maturation; macroautophagy; mitophagy; selective autophagy.


Figures

FIG 1
FIG 1
Construction of a toolkit for analysis of ATG8 function. (A) Schematic for sequential CRISPR/Cas9-mediated genome editing to generate GABARAP family-deficient (ΔRAP), MAP1LC3 family-deficient (ΔLC3), or mammalian ATG8 family-deficient (ΔATG8) clonal cell lines. (B) Depletion of ATG8 proteins following gene editing. Denatured whole-cell extracts were subjected to SDS-PAGE and immunoblotted as indicated. (C) Phagophore formation remains intact in the absence of ATG8 proteins. Cells stably expressing GFP-WIPI1 were grown in nutrient-replete culture medium or HBSS as indicated, fixed, and imaged by spinning-disk confocal microscopy. Representative maximum-intensity projections of z-stacks are shown; scale bars represent 20 μm. (D) Elevated p62 expression in ΔRAP, ΔATG8, and ΔATG12 cells following starvation to induce autophagic flux. Cells were treated as indicated and subjected to immunoblot analysis as for panel B. (E) Plot of the ratio of p62 intensity to β-actin (loading) normalized to control cells for two independent biological experiments. Error bars represent standard deviation of the mean, and significance was determined by one-way analysis of variance (ANOVA) with post hoc testing (Dunnett's multiple-comparison test). *, P < 0.05; **, P < 0.001; n.s., not significant.
FIG 2
FIG 2
Impaired autophagic flux and accumulation of p62 in the absence of GABARAPs. (A and B) Confocal microscopy analysis of RFP-GFP-LC3B flux following starvation (HBSS) for 1.5 h. Note accumulation of red (RFP-only) puncta in control and ΔLC3 cell lines. Scale bars represent 20 μm. Panel B depicts quantification of autophagic flux as analyzed in panel A; the average percentage of RFP-GFP and RFP-only puncta per cell was calculated for two pooled biological replicate experiments. Error bars represent the standard deviation of the mean. (C) Representative accumulation of basal LC3B puncta in ΔRAP cells as visualized by endogenous LC3B staining and confocal microscopy; the scale bar represents 20 μm. (D) Basal LC3B puncta accumulation, as visualized in panel C, with cells lacking individual GABARAP proteins or all three GABARAP proteins; the scale bar represents 20 μm. (E) Quantification of panel D. The number of LC3B puncta per cell was counted for each genotype and plotted according to the indicated classifications. (F) Immunoblot analysis of LC3-II accumulation in the absence of GABARAPs. (G) Loss of GABARAPs mimics LC3-II accumulation observed with bafilomycin A (BafA) treatment. Immunoblot analysis of LC3-II accumulation in control cells treated as indicated compared to that in ATG conjugation-deficient cells (ΔATG12) and ΔRAP cells is shown. (H) Impaired lysosomal fusion in ΔRAP cells. Immunogold staining for FLAG-HA-LC3B was performed, followed by TEM to visualize LC3B-positive autophagosomal structures and electron-dense lysosomes. The scale bar represents 100 nm.
FIG 3
FIG 3
Accumulation of ubiquitinated aggregates in the absence of GABARAPs. (A) Cells of the indicated genotypes were cultured in complete medium on glass coverslips, followed by fixation and immunostaining for endogenous p62 and ubiquitin (UB). Cells were visualized by confocal microscopy, and representative images observed in biological replicate experiments are shown as summed intensity projections of z-stacks. Scale bars represent 20 μm. (B) Immunostaining and confocal microscopy as for panel A, visualizing endogenous phosphorylated TBK1 (pTBK1) and UB. (C) Ectopic expression of GABARAPs reduces p62 accumulation. Control, ΔRAP, and ΔATG8 cells were transduced with retrovirus encoding empty vector (EV) (control), FLAG-HA-GABARAP (RAP), FLAG-HA-GABARAPL1 (L1), or FLAG-HA-GABARAPL2 (L2), followed by puromycin selection to generate stable cell lines. Cells were harvested for immunoblot analysis with the indicated antibodies. (D) Left panel, cells reconstituted with ectopic GABARAPs as for panel C were grown on glass coverslips, fixed, and stained for p62 and anti-HA to visualize tagged GABARAPs. Note the redistribution of p62 signal from large aggregates to GABARAP-positive punctate structures. Representative summed intensity projections of z-stacks are shown; scale bars represent 20 μm. Right panel, intensity profiles of a 20-μm line segment drawn across an individual z-section for each channel. Overlap of 488 (p62) and 561 (anti-HA) fluorescence intensity profiles (arbitrary units [AU]) indicates colocalization of p62 with GABARAPs. (E) Quantification of p62 punctum diameter as shown in panel D. Error bars represent standard deviation of the mean, and significance was determined by one-way ANOVA with post hoc testing (Dunnett's multiple-comparison test). ****, P < 0.0001.
FIG 4
FIG 4
GABARAP proteins facilitate clearance of damaged mitochondria via the parkin pathway. (A) ΔATG8 cells exhibit delayed mitochondrial clearance. HeLa cells of each genotype stably expressing FLAG-HA-PARK2 were treated with antimycin A and oligomycin (AO) as indicated, followed by fixation and staining for anti-DNA to demarcate mitochondria and anti-HA to indicate PARK2 expression and analysis by confocal microscopy. Maximum-intensity projections of z-stacks are shown, and scale bars represent 20 μm. (B) Quantification of the 18-h time point as shown in panel A. PARK2-positive cells of each genotype were quantified by classification of mitochondria as intact, aggregated, or predominantly cleared. Error bars represent the standard deviation for two representative biological experiments; n > 30 cells per experiment analyzed. (C) Cells of the indicated genotypes stably expressing FLAG-HA-PARK2 and mtKeima were treated with AO for 5 h and analyzed for acidic (lysosomal) Keima signal using confocal microscopy. Representative ratiometric images were constructed by dividing the 561-nm excitation signal (acidic Keima) by the 442-nm excitation signal (neutral Keima). The color scale (arbitrary units [AU]) represents the pixel value for the 561 nm/442 nm ratio (orange/white; 4 to 5 AU indicates lysosomal mtKeima). The scale bar represents 20 μm.
FIG 5
FIG 5
Altered content of autophagic vesicles in ΔRAP cells revealed by quantitative proteomics. (A) Control and ΔRAP cells were SILAC labeled and treated as indicated, followed by mixing of heavy and light labeled cells based on equal cell number. Autophagic vesicles were enriched via density gradient centrifugation, and samples were separated by SDS-PAGE for gel band cutting and in-gel Lys-C digest prior to MS/MS analysis. (B) Log2 (H/L) frequency distribution for two independent biological experiments as described for panel A. (C) Correlation of log2 (H/L) ratios for biological replicate experiments shown in panel B. A total of 2,305 proteins were quantified in both experiments, and 516 proteins passed the log2 (H/L) ratio cutoff of 1, −1 (2-fold change). Proteins significantly enriched in control cells and ΔRAP cells are shown in blue and green, respectively. (D) Filters applied to the biological replicate AV data set to enrich for novel autophagosome candidate proteins (see Materials and Methods for filtering details). (E) Log2 (H/L) ratio heat map for biological replicate experiments after filtering as described in panel D; the top and bottom 30 proteins are shown (see Table S1 in the supplemental material for the full data list). Asterisks indicate known autophagy receptors, as well as the previously uncharacterized protein C18orf8. (F) DAVID gene ontology (GO) analysis of the data set shown in panel E. Note enrichment of RAB GTPase proteins and endocytic machinery in ΔRAP cells, while lysosomal proteins are significantly enriched in control cells.
FIG 6
FIG 6
Identification of C18orf8/RMC1 as a member of the CCZ1-MON1 GEF complex for RAB7. (A) SILAC mass spectra of heavy (control) and light (ΔRAP-enriched) C18orf8/RMC1 peptides identified in autophagosomal proteomics; K represents the heavy-labeled lysine residue. (B) Top panel, predicted domain structure of RMC1. Bottom panel, Map of high-confidence interacting proteins (HCIPs) identified in reciprocal affinity purification-mass spectrometry (AP-MS) experiments with RMC1-FLAG-HA, FLAG-HA-CCZ1, or MON1A-MYC-FLAG bait proteins expressed in 293T cells. The line thickness correlates with the number of peptides observed in each interaction. (C) GFP-CCZ1 associates with RMC1-FLAG-HA. 293T cells stably expressing RMC1-FLAG-HA were transiently transfected with FLAG-HA-GFP control or GFP-CCZ1, followed by GFP-TRAP affinity purification. Note that RMC1-FLAG-HA associates with GFP-CCZ1 but not the FLAG-HA-GFP control. (D and E) Size exclusion chromatography and AP-MS of RMC1-containing complexes. 293T extracts stably expressing RMC1-FLAG-HA were separated by size exclusion chromatography; estimated molecular mass (MM) standards corresponding to fraction number are shown. Fractions containing RMC1 and RAB7 signals were subjected to FLAG AP-MS to identify complex members. (F) GFP-RAB7 associates with endogenous RMC1. 293T cells were transiently transfected with FLAG-HA-GFP control, GFP-RAB7WT, GFP-RAB7Q67L (constitutively active), or GFP-RAB7T22N (dominant negative), followed by GFP-TRAP affinity purification and immunoblot analysis as indicated.
FIG 7
FIG 7
C18orf8/RMC1 is required for endolysosomal size control and autophagic flux. (A) HeLa cells stably expressing RMC1-FLAG-HA were grown on glass coverslips, fixed, and immunostained as indicated. (B) HeLa cells were transfected with control or RMC1 siRNA pools; at 72 h posttransfection, cells were harvested for immunoblot analysis with the indicated antibodies. (C) Cells treated with siRNAs as for panel B were grown on glass coverslips, fixed, and immunostained with the late endosomal marker anti-CD63; maximum-intensity projections of z-stacks are shown, and scale bars represent 20 μm. (D) Cells treated with siRNAs as for panel B were fixed and analyzed by TEM. (E) HeLa cells were treated with individual or combined siRNAs as indicated for 72 h, followed by immunoblot analysis to evaluate depletion of RMC1 and accumulation of p62 protein. (F) Quantification of p62 levels shown in panel E for two biological replicate experiments. Error bars represent standard deviation, and significance was determined by one-way ANOVA with post hoc testing (Dunnett's multiple-comparison test). *, P < 0.05; **, P < 0.01. (G) HeLa cells were grown on glass coverslips, fixed, and immunostained with anti-CD63 and LC3B; representative maximum-intensity projections are shown, and scale bars represent 20 μm. (H) Quantification of basal LC3B punctum number in cells stained as for panel G. Data represent two pooled biological experiments, and error bars represent standard deviation. (I and J) HeLa cells treated with control or RMC1 siRNAs (as for panel E) were treated with Cell Light RFP-GFP-LC3B for 16 h, followed by incubation in nutrient-replete DMEM (I) or starvation medium (HBSS) (J) for 1 h. Autophagic flux was monitored by confocal microscopy; single z-sections are shown for each channel, and scale bars represent 20 μm. (K and L) Quantification of average percentage of RFP-GFP-positive and RFP-only puncta per cell as shown in panels I and J. Data represent two pooled biological experiments, error bars represent standard deviation of the mean, and significance was determined by one-way ANOVA with post hoc testing (Dunnett's multiple-comparison test). ****, P < 0.0001. (M) Left panel, HeLa cells were grown on glass coverslips in nutrient-replete medium, fixed, and stained with endogenous antibodies against RAB7 and CD63. Individual representative z-sections for each channel are shown, and scale bars represent 20 μm. Right panel, intensity profiles of a 20-μm line segment drawn across the z-section shown for each channel. Overlap of 488 (RAB7) and 561 (CD63) fluorescence intensity profiles (arbitrary units [AU]) indicates colocalization of RAB7 with the late endosomal marker CD63.

Similar articles

Cited by

References

    1. Yang Z, Klionsky DJ. 2010. Eaten alive: a history of macroautophagy. Nat Cell Biol 12:814–822. doi:10.1038/ncb0910-814. - DOI - PMC - PubMed
    1. Kroemer G, Marino G, Levine B. 2010. Autophagy and the integrated stress response. Mol Cell 40:280–293. doi:10.1016/j.molcel.2010.09.023. - DOI - PMC - PubMed
    1. Ktistakis NT, Tooze SA. 2016. Digesting the expanding mechanisms of autophagy. Trends Cell Biol 26:624–635. doi:10.1016/j.tcb.2016.03.006. - DOI - PubMed
    1. Mizushima N, Yoshimori T, Ohsumi Y. 2011. The role of Atg proteins in autophagosome formation. Annu Rev Cell Dev Biol 27:107–132. doi:10.1146/annurev-cellbio-092910-154005. - DOI - PubMed
    1. Mizushima N, Noda T, Yoshimori T, Tanaka Y, Ishii T, George MD, Klionsky DJ, Ohsumi M, Ohsumi Y. 1998. A protein conjugation system essential for autophagy. Nature 395:395–398. doi:10.1038/26506. - DOI - PubMed

Publication types

MeSH terms

Substances