. 2017 Nov 15;130(22):3907-3917.
doi: 10.1242/jcs.207886. Epub 2017 Oct 16.

Constitutive activity of the Ghrelin receptor reduces surface expression of voltage-gated Ca2+ channels in a CaVβ-dependent manner

Affiliations

Constitutive activity of the Ghrelin receptor reduces surface expression of voltage-gated Ca2+ channels in a CaVβ-dependent manner

Emilio R Mustafá et al. J Cell Sci. .

Abstract

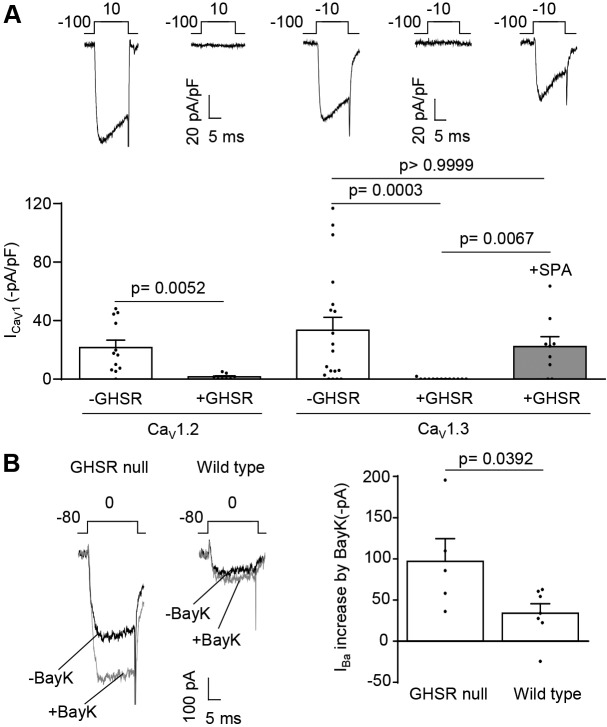
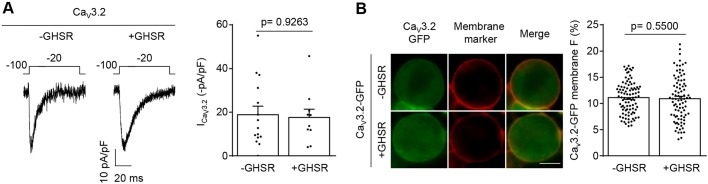
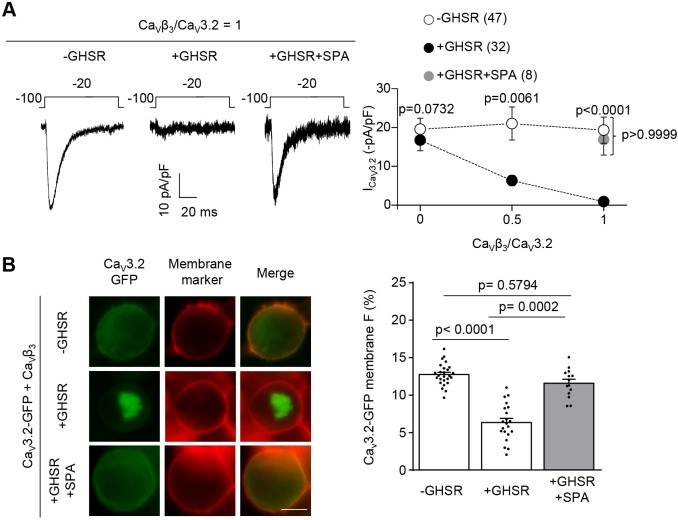
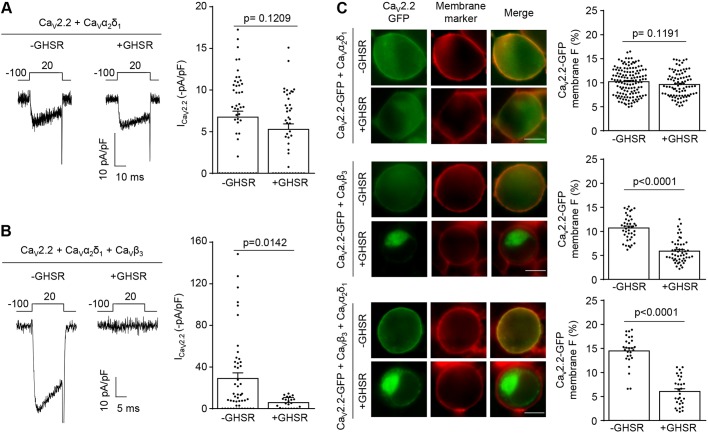
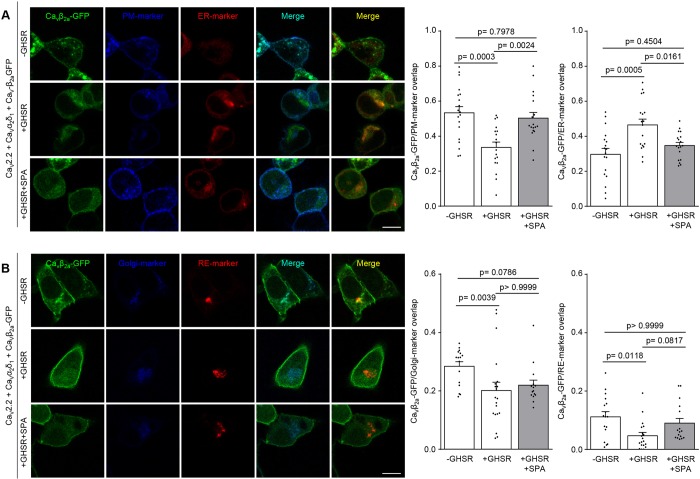
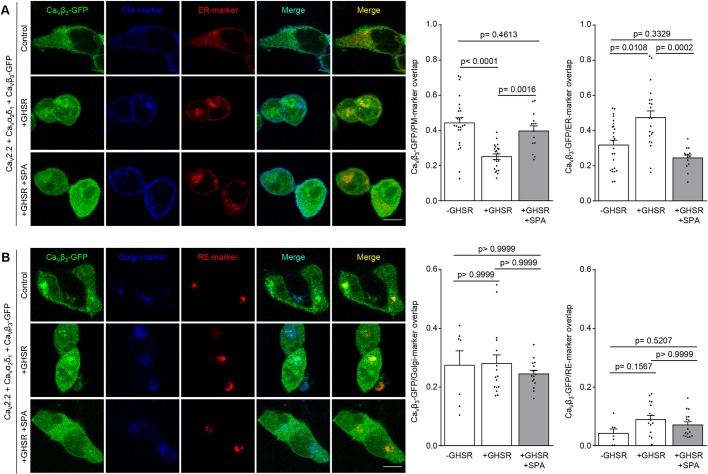
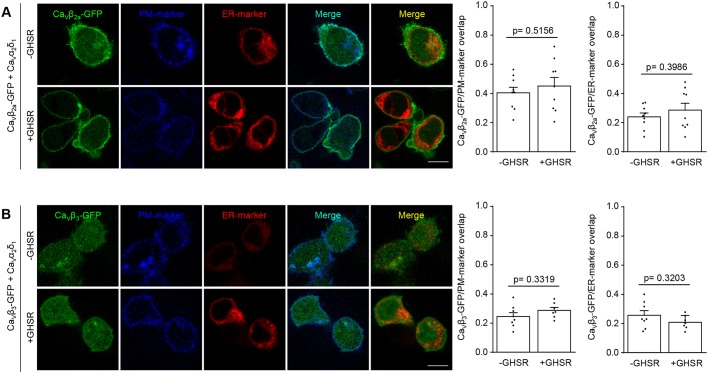
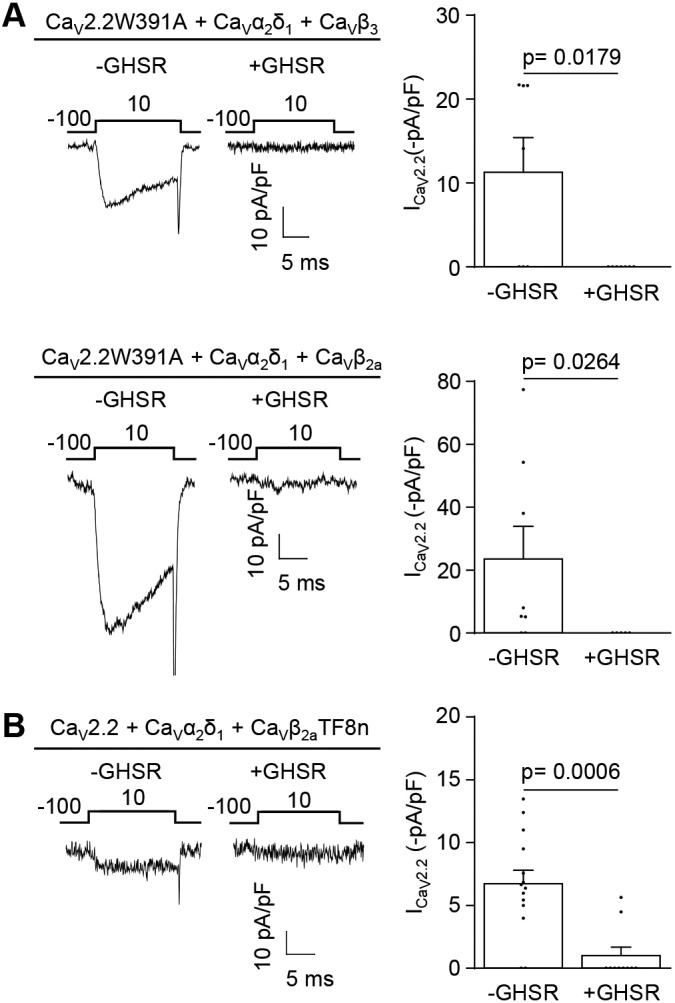
Voltage-gated Ca2+ (CaV) channels couple membrane depolarization to Ca2+ influx, triggering a range of Ca2+-dependent cellular processes. CaV channels are, therefore, crucial in shaping neuronal activity and function, depending on their individual temporal and spatial properties. Furthermore, many neurotransmitters and drugs that act through G protein coupled receptors (GPCRs), modulate neuronal activity by altering the expression, trafficking, or function of CaV channels. GPCR-dependent mechanisms that downregulate CaV channel expression levels are observed in many neurons but are, by comparison, less studied. Here we show that the growth hormone secretagogue receptor type 1a (GHSR), a GPCR, can inhibit the forwarding trafficking of several CaV subtypes, even in the absence of agonist. This constitutive form of GPCR inhibition of CaV channels depends on the presence of a CaVβ subunit. CaVβ subunits displace CaVα1 subunits from the endoplasmic reticulum. The actions of GHSR on CaV channels trafficking suggest a role for this signaling pathway in brain areas that control food intake, reward, and learning and memory.

Keywords: CaVβ; GPCR; Voltage-gated calcium (Ca2+) channels.


Conflict of interest statement

Competing interestsThe authors declare no competing or financial interests.

Figures

Fig. 1.
Fig. 1.
GHSR constitutive activity reduces CaV1.2 and CaV1.3 currents in tsA201 cells, and reduces native CaV1 currents in cultured hypothalamic neurons. (A) Representative CaV current traces from tsA201 cells co-transfected with CaV1.2, CaVα1δ2, CaVβ3 and GHSR (+GHSR, n=8) or from controls transfected with empty plasmid (-GHSR, n=12), and average ICa for each condition (left). Representative CaV current traces from tsA201 cells co-transfected with CaV1.3, CaVα1δ2, CaVβ3 and GHSR (+GHSR, n=13) pre-incubated or not with SPA 1 µM (+SPA, n=9) and from controls transfected with empty plasmid (-GHSR, n=19), and average ICa for each condition (right). (B) Representative traces of the Bay K 8644 (BayK) effect (5 µM) on the Ba2+ current from GHSR-deficient (GHSR null, n=5) and wild-type (Wild type, n=7) hypothalamic neurons (left), and average IBa increase (right). Error bars represent mean±s.e.m., individual points represents current registered (A) or current increase for each cell (B). Kruskal–Wallis with Dunn's post-test (CaV1.3), Mann–Whitney test (CaV1.2) (A), and Student's t-test (B).
Fig. 2.
Fig. 2.
GHSR constitutive activity fails to reduce CaV3.2 density on the plasma membrane. (A) Representative CaV current traces (left) from tsA201 cells co-transfected with CaV3.2 and GHSR (+GHSR, n=10) or empty plasmid (-GHSR, n=15), and average ICa for each condition (right). (B) Photomicrographs (left) and average of GFP plasma membrane signal (in percent) (right) of tsA201 cells co-transfected with CaV3.2-GFP and GHSR (+GHSR, n=88) and from controls transfected with empty plasmid (-GHSR, n=94). Green and red signals correspond to the eGFP tag on CaV3.2 and the CellMask membrane marker, respectively. Scale bar: 10 µm. Error bars represent mean±s.e.m., individual points represent each cell analyzed.
Fig. 3.
Fig. 3.
GHSR constitutive activity reduces CaV3.2 density on plasma membrane and, consequently, the CaV3.2 current in a CaVβ3-dependent manner. (A) Representative CaV current traces (left) from tsA201 cells co-transfected with CaV3.2, CaVβ3 and GHSR (+GHSR) pre-incubated or not with SPA 1 µM (+GHSR+SPA), and from controls transfected with empty plasmid (-GHSR) and average ICa in presence of increasing CaVβ3/CaV3.2 molar ratios (right). (B) Photomicrographs (left) and average of GFP plasma membrane signal (in percent) (right) of tsA201 cells co-transfected with CaV3.2-GFP, CaVβ3 and GHSR (+GHSR, n=21) pre-incubated or not with SPA 1 µM (+GHSR+SPA, n=14) and from controls transfected with empty plasmid (-GHSR, n=27). Green and red signals correspond to the eGFP tag on CaV3.2 and the membrane marker CellMask, respectively. Scale bar: 10 µm. Dots represent mean±s.e.m., numbers in brackets represent the number of analyzed cells in A. Error bars represent mean±s.e.m. and individual points represent each cell analyzed in B. Mann–Whitney test and Kruskal–Wallis with Dunn's post-test (A). Kruskal–Wallis with Dunn's post hoc test (B).
Fig. 4.
Fig. 4.
Presence of CaVβ3 but not that of CaVα2δ1 is required for GHSR constitutive activity to reduce CaV2.2 current by decreasing CaV2.2 density on plasma membrane. (A) Representative CaV currents from tsA201 cells co-transfected with CaV2.2, CaVα2δ1 and GHSR (+GHSR, n=44) or from controls transfected with empty plasmid (-GHSR, n=51) and average ICa for each condition. (B) Representative CaV currents from tsA201 cells co-transfected with CaV2.2, CaVβ3, CaVα2δ1 and GHSR (+GHSR, n=22) or empty plasmid (-GHSR, 48) and average ICa for each condition. (C) Photomicrographs and averaged GFP plasma membrane signal (in percent) of tsA201 cells co-transfected with CaV2.2-GFP, CaVα2δ1 and GHSR (+GHSR, n=87) and from controls transfected with empty plasmid (-GHSR, n=135) (top). Photomicrographs and average of GFP plasma membrane signal (in percent) of tsA201 cells co-transfected with CaV2.2-GFP, CaVβ3 and GHSR (+GHSR, n=51) or from controls transfected with empty plasmid (-GHSR, n=42) (middle). Photomicrographs and average of GFP plasma membrane signal (in percent) of tsA201 cells co-transfected with CaV2.2-GFP, CaVβ3, CaVα2δ1 and GHSR (+GHSR, n=29) or from controls transfected with empty plasmid (-GHSR, n=27) (bottom). Green and red signals correspond to the eGFP tag on CaV2.2 and the membrane marker CellMask, respectively. Scale bars: 10 µm. Error bars represent mean±s.e.m. and individual points represent each cell analyzed. Mann–Whitney test.
Fig. 5.
Fig. 5.
GHSR constitutive activity reduces CaVβ2a density on the plasma membrane while increasing it on the ER. (A) Confocal images of tsA201 cells co-transfected with CaV2.2, CaVβ2a-eGFP, CaVα2δ1, plasma membrane marker (PM-marker), endoplasmic reticulum-marker (ER-marker) and GHSR pre-incubated with SPA (1 µM) (+GHSR+SPA, n=18) or not (+GHSR, n=18) and controls expressing empty plasmid (-GHSR, n=19). (B) Confocal images of tsA201 cells co-transfected with CaV2.2, CaVβ2a-eGFP, CaVα2δ1, Golgi complex marker (Golgi-marker), recycling endosome marker (RE-marker) and GHSR pre-incubated with SPA (1 µM) (+GHSR+SPA, n=15) or not (+GHSR, n=20) and controls expressing empty plasmid (-GHSR, n=16). Bar graphs show the colocalization of green signal from CaVβ2a-eGFP with blue signal (from PM-marker or Golgi-marker) or with red signal (from ER-marker or RE-marker). Error bars represent mean±s.e.m. and individual points represent each quantified cell. Scale bars: 10 µm. One way-ANOVA with Tukey's post hoc test (F2, 52=10.28) (A) and Kruskal–Wallis with Dunn's post-test (B).
Fig. 6.
Fig. 6.
GHSR constitutive activity reduces CaVβ3 density on the plasma membrane while increasing it on the ER. (A) Confocal images of tsA201 cells co-transfected with CaV2.2, CaVβ3-eGFP, CaVα2δ1, plasma membrane marker (PM-marker), endoplasmic reticulum-marker (ER-marker) and GHSR pre-incubated with SPA (1 µM) (+GHSR+SPA, n=14) or not (+GHSR, n=21) and of controls transfected with empty plasmid (-GHSR, n=25). (B) Confocal images of tsA201 cells co-transfected with CaV2.2, CaVβ3-eGFP, CaVα2δ1, Golgi marker (Golgi-marker), recycling endosome marker (RE-marker) and GHSR pre-incubated with SPA (1 µM) (+GHSR+SPA, n=16) or not (+GHSR, n=16) and of controls transfected with empty plasmid (-GHSR, n=7). Bar graphs show the colocalization of green signal from CaVβ3-eGFP with blue signal (from PM-marker or Golgi-marker) or with red signal (from ER-marker or RE-marker). Scale bars:10 µm. Error bars represent mean±s.e.m., individual points represent each quantified cell. One way-ANOVA with Turkey's post-test (F2, 57=16.43) (CaVβ3-eGFP/PM-marker overlap) and Kruskal–Wallis with Dunn's post-test.
Fig. 7.
Fig. 7.
GHSR constitutive activity fails to reduce CaVβ density on plasma membrane in the absence of CaVα1. (A) Confocal images of tsA201 cells co-transfected with CaVβ2a-eGFP, CaVα2δ1, plasma membrane marker (PM-marker), endoplasmic reticulum-marker (ER-marker) and GHSR (+GHSR, n=9) or of controls transfected with empty plasmid (-GHSR, n=9). (B) Confocal images of tsA201 cells co-transfected with CaVβ3-eGFP, CaVα2δ1, plasma membrane marker (PM-marker), endoplasmic reticulum-marker (ER-marker) and GHSR (+GHSR, n=7) or of controls transfected with empty plasmid (-GHSR, n=8). Bar graphs show the colocalization of green signal from CaVβ3-eGFP or CaVβ2a-eGFP with blue signal (from PM-marker) or with red signal (from ER-marker). Scale bars: 10 µm. Error bars represent mean±s.e.m., individual points represent each quantified cell. Student's t-test (A) and Mann–Whitney test (B).
Fig. 8.
Fig. 8.
A W391A mutation of CaVα1 or truncation of CaVβ are not sufficient to block the inhibitory effect of GHSR on CaV2.2 activity. (A) Representative CaV current traces from tsA201 cells co-transfected with CaV2.2W391A, CaVα1δ2, CaVβ3 and GHSR (+GHSR, n=7) or from controls transfected with empty plasmid (-GHSR, n=7), and average ICa for each condition (top). Representative CaV current traces from tsA201 cells co-transfected with CaV2.2W391A, CaVα1δ2, CaVβ2a and GHSR (+GHSR, n=5) or from controls transfected with empty plasmid (-GHSR, n=8), and average ICa for each condition (bottom). Error bars represent mean±s.e.m., individual points represents current registered. Student's t-test (top) and Mann–Whitney test (bottom). (B) Representative CaV current traces from tsA201 cells co-transfected with CaV2.2, CaVα1δ2, CaVβ2aTF8n and GHSR (+GHSR, n=10) or from controls transfected with empty plasmid (-GHSR, n=14), and average ICa for each condition. Error bars represent mean±s.e.m., individual points represents current registered. Mann–Whitney test.

Similar articles

Cited by

References

    1. Altier C., Khosravani H., Evans R. M., Hameed S., Peloquin J. B., Vartian B. A., Chen L., Beedle A. M., Ferguson S. S., Mezghrani A. et al. (2006). ORL1 receptor-mediated internalization of N-type calcium channels. Nat. Neurosci. 9, 31-40. 10.1038/nn1605 - DOI - PubMed
    1. Altier C., Garcia-Caballero A., Simms B., You H., Chen L., Walcher J., Tedford H. W., Hermosilla T. and Zamponi G. W. (2011). The Cavbeta subunit prevents RFP2-mediated ubiquitination and proteasomal degradation of L-type channels. Nat. Neurosci. 14, 173-180. 10.1038/nn.2712 - DOI - PubMed
    1. Andrews Z. B., Erion D., Beiler R., Liu Z.-W., Abizaid A., Zigman J., Elsworth J. D., Savitt J. M., Dimarchi R., Tschoep M. et al. (2009). Ghrelin promotes and protects nigrostriatal dopamine function via a UCP2-dependent mitochondrial mechanism. J. Neurosci. 29, 14057-14065. 10.1523/JNEUROSCI.3890-09.2009 - DOI - PMC - PubMed
    1. Arias J. M., Murbartián J., Vitko I., Lee J.-H. and Perez-Reyes E. (2005). Transfer of beta subunit regulation from high to low voltage-gated Ca2+ channels. FEBS Lett. 579, 3907-3912. 10.1016/j.febslet.2005.06.008 - DOI - PubMed
    1. Bae J., Suh E. J. and Lee C. (2010). Interaction of T-type calcium channel Ca(V)3.3 with the beta-subunit. Mol. Cells 30, 185-191. 10.1007/s10059-010-0106-z - DOI - PubMed