. 2017 Nov 22;37(47):11298-11310.
doi: 10.1523/JNEUROSCI.2893-16.2017. Epub 2017 Oct 16.

Delayed Maturation of Fast-Spiking Interneurons Is Rectified by Activation of the TrkB Receptor in the Mouse Model of Fragile X Syndrome

Affiliations

Delayed Maturation of Fast-Spiking Interneurons Is Rectified by Activation of the TrkB Receptor in the Mouse Model of Fragile X Syndrome

Toshihiro Nomura et al. J Neurosci. .

Abstract

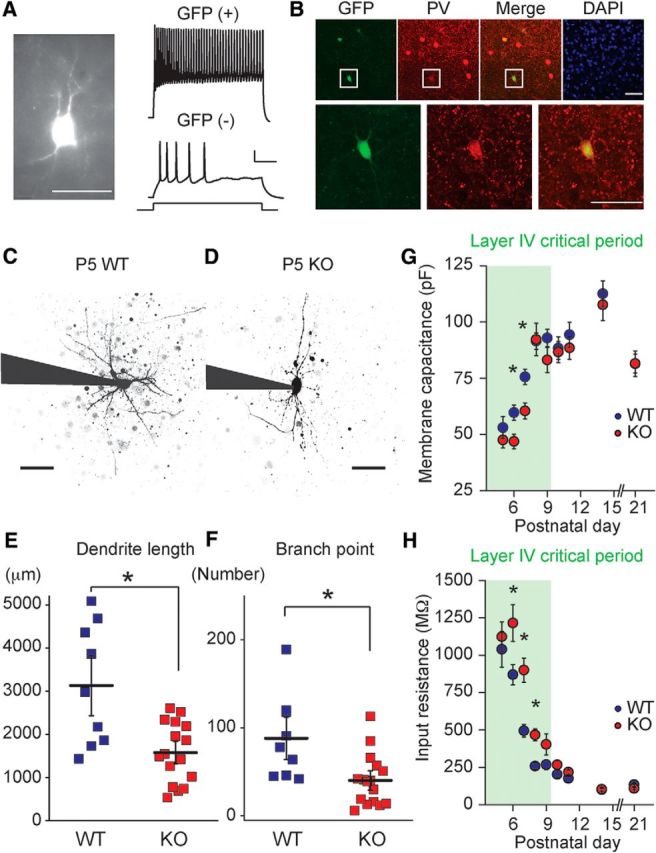
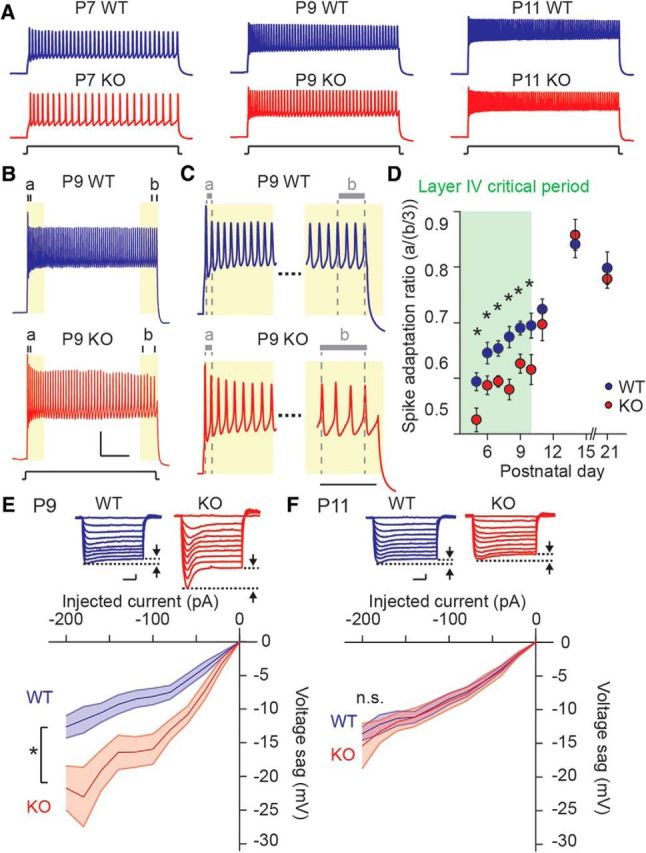
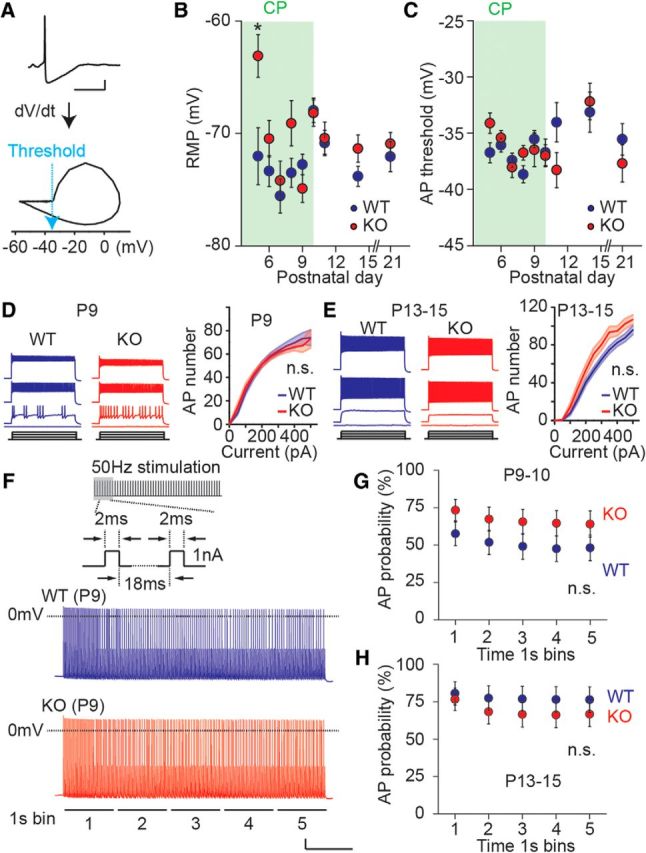
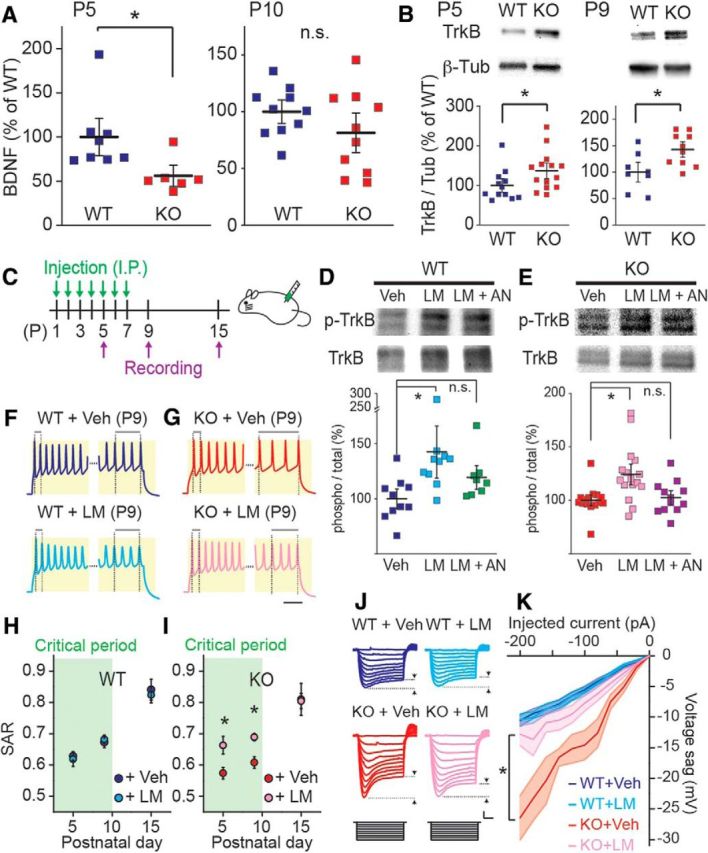
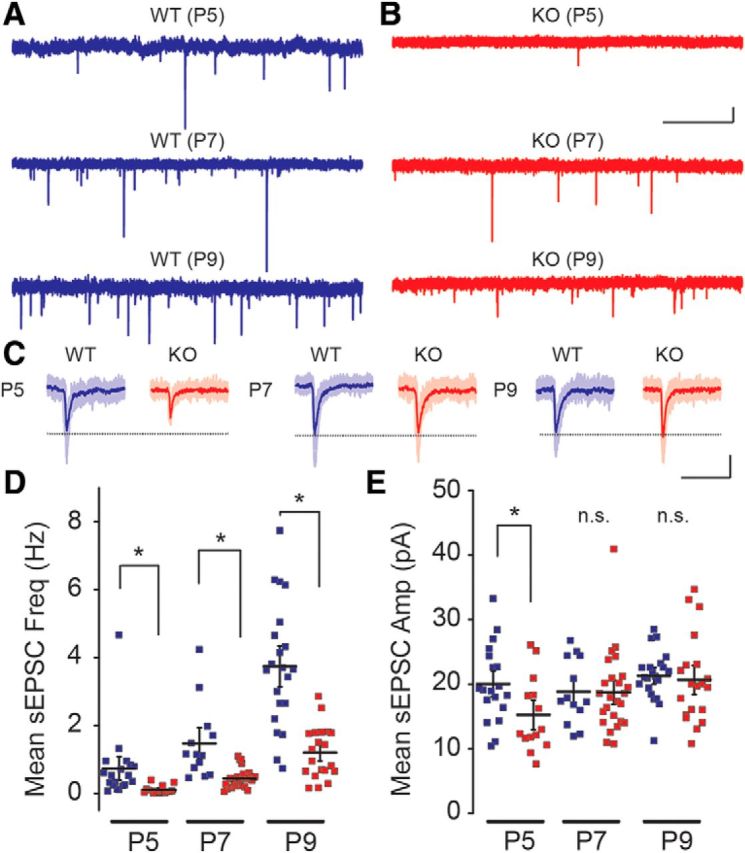
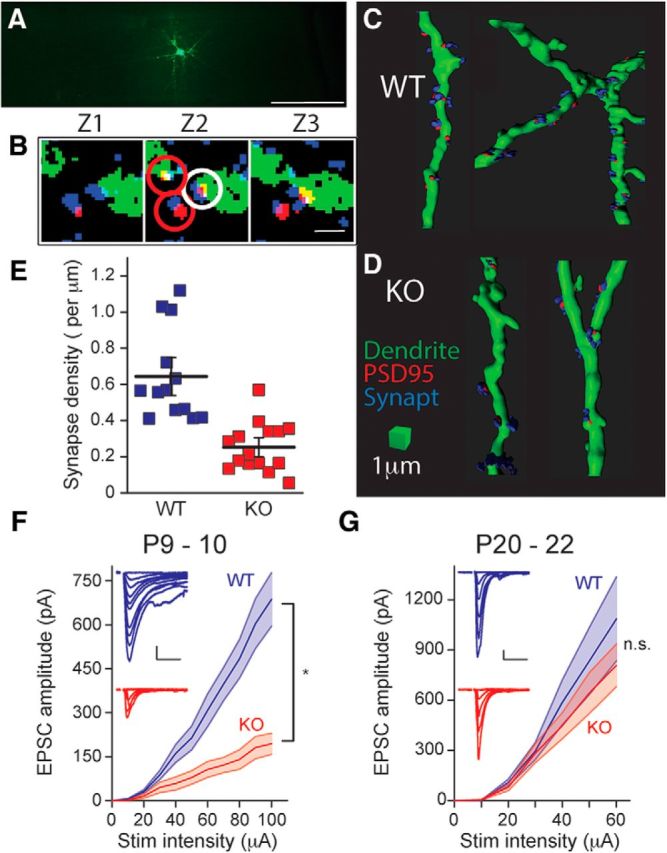
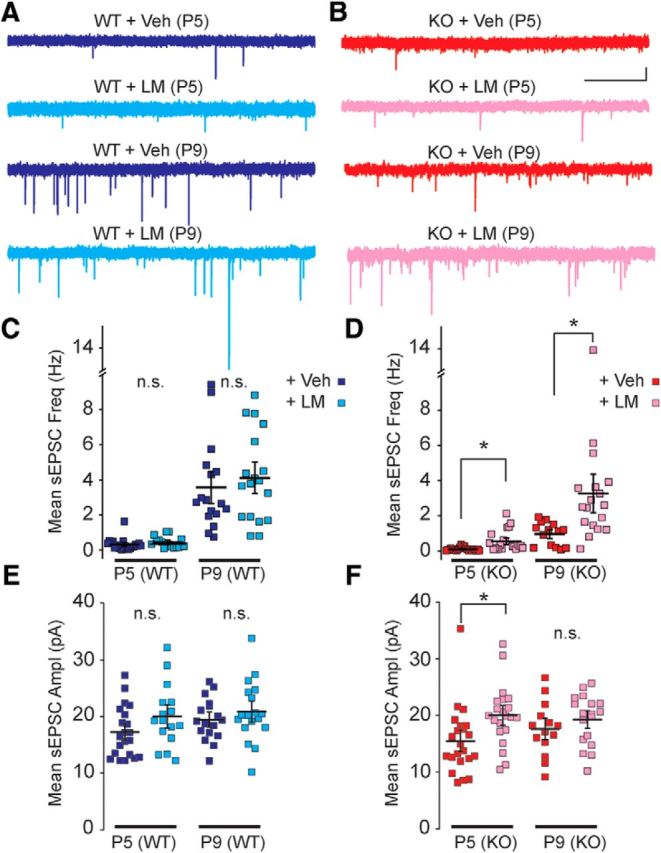
Fragile X syndrome (FXS) is a neurodevelopmental disorder that is a leading cause of inherited intellectual disability, and the most common known cause of autism spectrum disorder. FXS is broadly characterized by sensory hypersensitivity and several developmental alterations in synaptic and circuit function have been uncovered in the sensory cortex of the mouse model of FXS (Fmr1 KO). GABA-mediated neurotransmission and fast-spiking (FS) GABAergic interneurons are central to cortical circuit development in the neonate. Here we demonstrate that there is a delay in the maturation of the intrinsic properties of FS interneurons in the sensory cortex, and a deficit in the formation of excitatory synaptic inputs on to these neurons in neonatal Fmr1 KO mice. Both these delays in neuronal and synaptic maturation were rectified by chronic administration of a TrkB receptor agonist. These results demonstrate that the maturation of the GABAergic circuit in the sensory cortex is altered during a critical developmental period due in part to a perturbation in BDNF-TrkB signaling, and could contribute to the alterations in cortical development underlying the sensory pathophysiology of FXS.SIGNIFICANCE STATEMENT Fragile X (FXS) individuals have a range of sensory related phenotypes, and there is growing evidence of alterations in neuronal circuits in the sensory cortex of the mouse model of FXS (Fmr1 KO). GABAergic interneurons are central to the correct formation of circuits during cortical critical periods. Here we demonstrate a delay in the maturation of the properties and synaptic connectivity of interneurons in Fmr1 KO mice during a critical period of cortical development. The delays both in cellular and synaptic maturation were rectified by administration of a TrkB receptor agonist, suggesting reduced BDNF-TrkB signaling as a contributing factor. These results provide evidence that the function of fast-spiking interneurons is disrupted due to a deficiency in neurotrophin signaling during early development in FXS.

Keywords: TrkB; critical period; fast-spiking interneuron; fragile X syndrome; somatosensory cortex; synapse.


Figures

Figure 1.
Figure 1.
Immature dendritic morphology and delay in maturation of membrane properties in FS neurons of Fmr1 KO mice. A, Targeted recordings from GFP-expressing FS interneurons in P9 Fmr1; GAD67-EGFP mice. Representative GFP-positive cell (left) and AP trains recorded from GFP-positive (right, top) and GFP-negative (right, bottom) neurons in response to 100 pA (500 ms) current injection. Scale bars: Left, 50 μm; Right, 100 ms and 25 mV. B, Coimmunostaining for GFP (green) and PV (red) in layer IV of the primary somatosensory cortex. Magnified images of highlighted cell are shown in the bottom panels. GFP is expressed specifically in PV-positive large basket cells in Fmr1; GAD67-EGFP mice (P15). Scale bars: 50 μm. C, D, Representative 2PLSM images of FS neurons in P5 Fmr1 WT and KO mice. Recording electrodes are outlined in black. Scale bars, 100 μm. E, Grouped data for the total dendrite length and (F) the number of branch points. Dendrite length and branch point number are smaller in Fmr1 KO mice. *p < 0.05. G, Grouped data for Cm and (H) Rin recorded at each postnatal day starting at P5. Somatosensory layer IV critical period is highlighted. Cm is smaller at P6 and P7, whereas Rin remains higher from P6 to P8 in Fmr1 KO mice; n = 20–41 recordings from 3–8 mice. *p < 0.05.
Figure 2.
Figure 2.
Maturation in FS functional phenotype is delayed in Fmr1 KO mice. A, Representative AP responses evoked by 500 ms (200 pA) current injection recorded from FS neurons at P7 (left), P9 (middle), and P11 (right) in Fmr1 WT (top) and Fmr1 KO mice (bottom). The firing frequency becomes higher and the firing pattern becomes less adaptive during development. B, Representative voltage responses to 500 ms (300 pA) current injection in P9 Fmr1 WT (top) and Fmr1 KO mice (bottom). The first and last three ISIs are indicated as “a” and “b”, respectively. Scale bar: 100 ms and 25 mV. C, Magnified traces to highlight initial and final ISI. Scale bar, 50 ms. D, Grouped data for SAR calculated as [a/(b/3)] recorded at postnatal days starting at P5. SAR is smaller from P5 to P10 in Fmr1 KO mice, n = 20–37 (from 3–8 mice). *p < 0.05. E, F, Top, Representative voltage sag responses evoked by 500 ms hyperpolarizing current injection (0 to −200 pA with −20 pA increment) in Fmr1 WT (left) and KO (right) mice at P9 (E) and P11 (F). Voltage sag is indicated by arrowheads. Scale bars: 100 ms and 10 mV. E, F, Bottom, Collective data for voltage sag at P9 (E) and P11 (F). Voltage sag becomes smaller during development, but is larger in Fmr1 KO mice at P9; n = 10–18 recordings from 3–4 mice. *p < 0.05, n.s. at p ≥ 0.05.
Figure 3.
Figure 3.
Neuronal excitability is not altered in FS interneurons in Fmr1 KO mice. A, Representative AP trace (top) and derivative (dV/dt) of AP (bottom). AP threshold is defined as the voltage where dV/dt starts to rise up. Scale bar: 50 ms and 10 mV. B, C, Collective data for RMP (B) and AP threshold (C) in FS interneurons in Fmr1 WT and KO mice. There is no difference in these parameters except for a small depolarizing shift in RMP in Fmr1 KO mice at P5. Critical period (CP) of somatosensory cortex is highlighted as green; n = 17–37 (from 3–7 mice). *p < 0.05. D, E, Representative AP traces evoked by incremental depolarizing current injections (0–300 pA with 100 pA increments; left) and collective data for AP I/O curves (right) at P9 (D) and P13–P15 (E). There is no difference in AP numbers during development between genotypes (two-way ANOVA, F(1,42) = 0.19, p = 0.66 at P9; F(1,25) = 1.73, p = 0.20 at P13–P15; n = 9–29 from 3–7 mice). n.s. at p ≥ 0.05. F, Schematic trace of suprathreshold (1 nA) short latency (2 ms) high-frequency (50 Hz) depolarizing current injection (top). Representative AP traces evoked by 5 s current injection in P9 Fmr1 WT (middle) and KO (bottom) mice. Membrane voltage at 0 mV is indicated by dashed line. Scale bar: 1 s and 10 mV. G, H, Collective data for AP probability for each 1 s bin of the AP trains evoked by 50 Hz stimulation at P9–P10 (G) and P13–P15 (H). There is no difference in AP probability between genotypes at both time points (two-way ANOVA, F(1,39) = 1.94, p = 0.17 at P9; F(1,35) = 0.55, p = 0.49 at P13–P15; n = 17–21 from 3–5 mice). n.s. at p ≥ 0.05.
Figure 4.
Figure 4.
Delayed maturation in FS phenotype is rescued by LM22A-4. A, BDNF protein expression level in developing S1 cortex determined by ELISA. Protein levels were normalized and presented as percentage of WT mean. BDNF is lower in Fmr1 KO mice at P5, but is not at P10. *p < 0.05, n.s. at p ≥ 0.05. B, Representative immunoblot images (top) and calculated relative expression from all experiments (below) for TrkB protein level at P5 (left) and P9 (right). Protein levels were normalized by β-tubulin (β-Tub) and data are presented as percentage of WT mean. TrkB expression (TrkB/Tub) is higher in Fmr1 KO mice at P5 and P9. *p < 0.05. C, Experimental paradigm for drug administration and ex vivo recordings. Mice were randomized and treated with vehicle (Veh) or LM22A-4 (LM) 100 mg/kg daily intraperitoneally (I.P.) from P1 to P7. Saline was used as a vehicle control. Recordings were made at P5, P9, and P15. D, E, Evidence that LM22A-4 specifically activates TrkB. Representative immunoblot images (top) and relative protein levels (below) for total TrkB and phosphorylated (Y515) TrkB (p-TrkB) in Fmr1 WT (D) and KO (E) mice. p-TrkB level (phospho) were divided by total TrkB level (total) in each sample and data are presented as percentage of mean in Veh-treated group. LM increases p-TrkB level in both WT and KO samples, which is not observed in ANA 12 coadministrated group (LM + AN; WT: vehicle-treated: n = 10 from 10 mice; LM22A-4-treated: n = 10 from 10 mice; LM22A-4 and ANA 12-treated: n = 8 from 8 mice; one-way ANOVA, F(2,25) = 3.99, p = 0.028 for Veh vs LM, 0.71 for Veh vs LM + AN; KO: vehicle-treated: n = 15 from 15 mice; LM22A-4-treated: n = 16 from 16 mice; LM22A-4 and ANA 12-treated: n = 12 from 12 mice; one-way ANOVA, F(2,40) = 7.38, p < 0.01 for Veh vs LM, 1.0 for Veh vs LM + AN). *p < 0.05, n.s. at p ≥ 0.05. F, G, Representative voltage responses to 500 ms (300 pA) current injections recorded from vehicle- (top) and LM22A-4- (bottom) treated Fmr1 WT (F) and Fmr1 KO (G) mice at P9. Initial and final portion of the traces were enlarged to highlight initial and final ISIs. Scale bar, 25 ms. H, I, Grouped data for SAR after vehicle and LM22A-4 treatment in Fmr1 WT (H) and KO (I) mice. Calculated SARs are lower in vehicle-treated KO mice at P5 and P9, whereas SARs in LM22A-4-treated KO mice are similar level as WT mice; n = 13–39 recordings from 3–5 mice. *p < 0.05. LM22A-4 has no effect on SARs in WT mice. J, Representative voltage responses to 500 ms hyperpolarizing current injections (0 to −200 pA with −20 pA increment) recorded from vehicle- (left) and LM22A-4- (right) treated Fmr1 WT (top) and KO (bottom) mice at P9. Scale bar, 100 ms and 10 mV. K, Collective data for voltage sag after vehicle and LM22A-4 treatment in WT and KO mice. LM22A-4 treatment corrects exaggerated Ih in Fmr1 KO mice to similar level as WT mice; n = 15–25 (from 4–5 mice). *p < 0.05.
Figure 5.
Figure 5.
Development in excitatory synapses onto FS interneurons is delayed in Fmr1 KO mice. A, B, Representative sEPSC traces recorded in FS interneurons from Fmr1 WT (A) and Fmr1 KO (B) mice at P5 (top), P7 (middle), and P9 (bottom). Scale bar, 1 s and 10 pA. C, Individual sEPSC events recorded from Fmr1 WT and Fmr1 KO mice at P5 (left), P7 (middle), and P9 (right). Ten EPSC traces (opaque lines) were averaged in each group (solid line). Scale bar, 25 ms and 10 pA. D, Collective data for sEPSC frequency. sEPSC frequency increases during development (P5–P9), but remains lower in Fmr1 KO mice. E, Grouped data for sEPSC amplitude. sEPSC amplitude is not significantly changed during development (P5–P9), and are not different between genotypes except for at P5; n = 13–25 (from 3–5 mice). * p < 0.05. n.s at. p ≥ 0.05.
Figure 6.
Figure 6.
Synapse density and intracortical evoked EPSCs are reduced in Fmr1 KO mice. A, Layer IV interneurons filled with biocytin and tagged with streptavidin-conjugated AlexaFluor 488. Slice containing labeled cell was embedded in LR White resin and trimmed for ultrathin cutting of 70-nm-thick sections. Scale bar, 200 μm. B, Seventy-nanometer-thick serial sections through a segment of dendrite with example of inclusion and exclusion synaptic analysis. Interneuron dendrite (green), PSD-95 (red), and synaptophysin (blue). White and red circles indicate counted and excluded synapses, respectively. To be counted as a synapse, PSD-95 puncta (postsynaptic marker) must overlap with the dendrite on consecutive sections and lie within 100 nm of synaptophysin puncta (presynaptic). Scale bar, 1 μm. C, Three-dimensional renderings of dendritic segments showing synaptic puncta on dendrite from Fmr1 WT and (D) Fmr1 KO mice. PSD-95 is labeled red and synaptophysin blue. Scale bar, 1 μm. E, Grouped data for analysis of synapse density in FS interneurons from Fmr1 WT and Fmr1 KO mice. The density of labeled puncta was significantly lower in Fmr1 KO mice (WT: 0.64 ± 0.15 synapses per μm, n = 13 cells from 3 mice; KO: 0.25 ± 0.08 synapses per μm, n = 15 cells from 3 mice, p < 0.01). *p < 0.05. F, Grouped data of EPSC amplitude input-output curves recorded from Fmr1 WT and Fmr1 KO mice at P9–P10. Insets show representative EPSCs from a Fmr1 WT (top) and Fmr1 KO (bottom) mouse recorded from FS interneuron and evoked by intracortical stimulation. EPSCs are evoked with increasing stimulation intensity. Scale bar, 10 ms and 100 pA. *p < 0.05. G, EPSC I/O curve at P20–P22 (n = 11 and 9 in WT and KO, respectively). Insets show representative EPSCs. Scale bar, 10 ms and 100 pA. n.s. at p > 0.05 (two-way ANOVA, F(1,18) = 0.69, p = 0.42).
Figure 7.
Figure 7.
Delayed maturation in synaptic recruitment is rescued by LM22A-4. A, B, Representative sEPSC traces after vehicle (Veh) and LM22A-4 (LM) treatments in Fmr1 WT (A) and Fmr1 KO (B) mice at P5 (top) and P9 (bottom). Scale bar, 1 s and 10 pA. C, D, Grouped data for sEPSC frequency in Fmr1 WT (C) and Fmr1 KO (D) recordings. E, F, Measured sEPSC amplitude from Fmr1 WT (E) and Fmr1 KO (F) mice. In each case recordings from Veh- and LM-treated mice are shown. sEPSC frequency is not different between vehicle and LM22A-4-treated WT mice but lower sEPSC frequency in vehicle-treated KO mice is not seen in LM22A-4-treated Fmr1 KO mice. sEPSC amplitude is not different in any of the groups except at P5 in Fmr1 KO mice; n = 14–23 recordings from 3–5 mice. *p < 0.05, n.s. at p ≥ 0.05.

Similar articles

Cited by

References

    1. Agmon A, Connors BW (1991) Thalamocortical responses of mouse somatosensory (barrel) cortex in vitro. Neuroscience 41:365–379. 10.1016/0306-4522(91)90333-J - DOI - PubMed
    1. Arnett MT, Herman DH, McGee AW (2014) Deficits in tactile learning in a mouse model of fragile X syndrome. PLoS One 9:e109116. 10.1371/journal.pone.0109116 - DOI - PMC - PubMed
    1. Benda J, Herz AV (2003) A universal model for spike-frequency adaptation. Neural Comput 15:2523–2564. 10.1162/089976603322385063 - DOI - PubMed
    1. Benda J, Longtin A, Maler L (2005) Spike-frequency adaptation separates transient communication signals from background oscillations. J Neurosci 25:2312–2321. 10.1523/JNEUROSCI.4795-04.2005 - DOI - PMC - PubMed
    1. Castrén ML, Castrén E (2014) BDNF in fragile X syndrome. Neuropharmacology 76:729–736. 10.1016/j.neuropharm.2013.05.018 - DOI - PubMed

Publication types

Substances