. 2017 Nov 15;37(46):11192-11203.
doi: 10.1523/JNEUROSCI.2318-17.2017. Epub 2017 Oct 16.

Correlated Disruption of Resting-State fMRI, LFP, and Spike Connectivity between Area 3b and S2 following Spinal Cord Injury in Monkeys

Affiliations

Correlated Disruption of Resting-State fMRI, LFP, and Spike Connectivity between Area 3b and S2 following Spinal Cord Injury in Monkeys

Ruiqi Wu et al. J Neurosci. .

Abstract

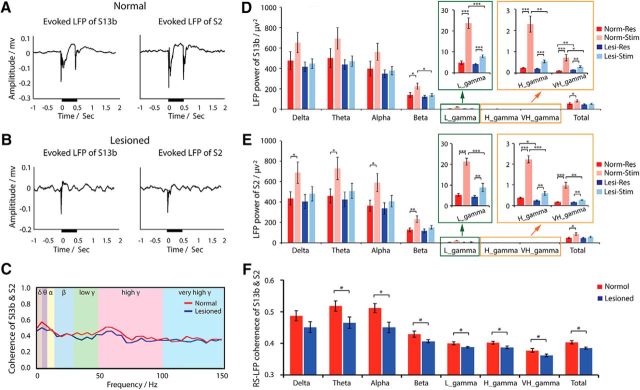
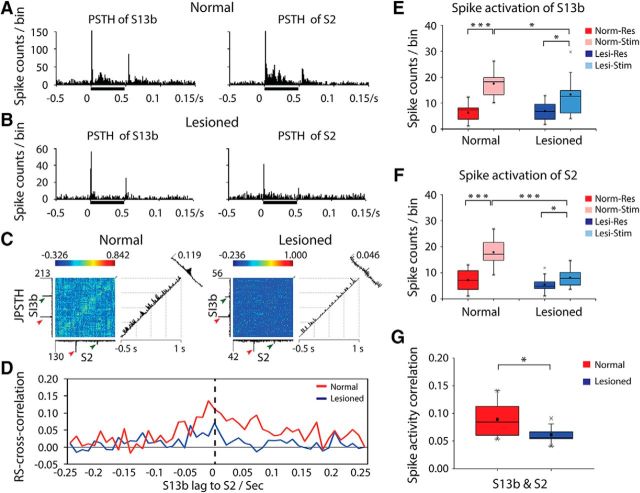
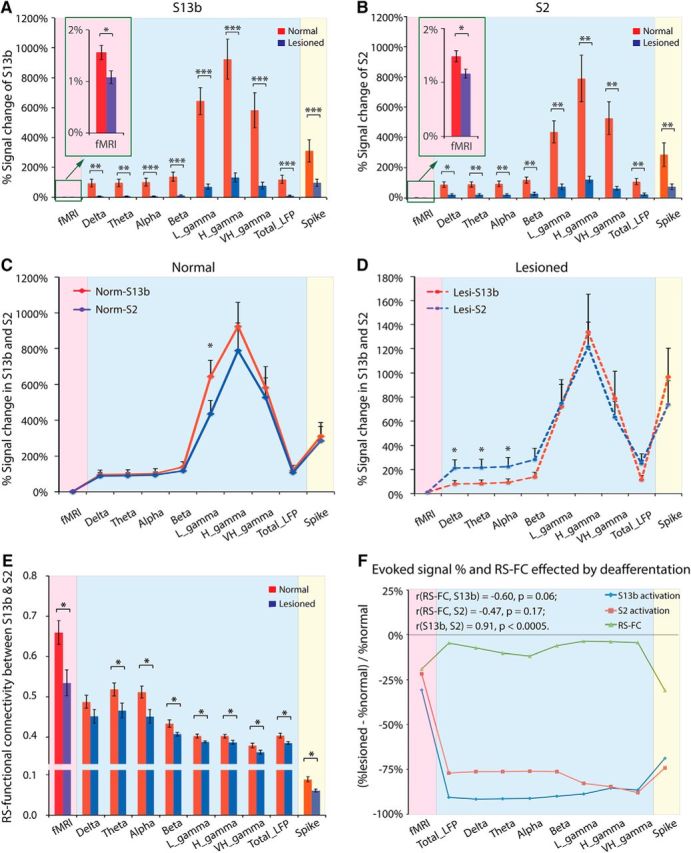
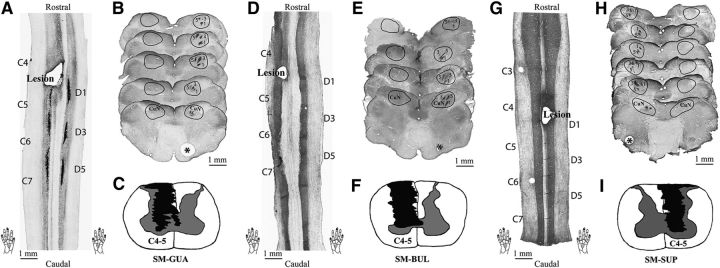
This study aims to understand how functional connectivity (FC) between areas 3b and S2 alters following input deprivation and the neuronal basis of disrupted FC of resting-state fMRI signals. We combined submillimeter fMRI with microelectrode recordings to localize the deafferented digit regions in areas 3b and S2 by mapping tactile stimulus-evoked fMRI activations before and after cervical dorsal column lesion in each male monkey. An average afferent disruption of 97% significantly reduced fMRI, local field potential (LFP), and spike responses to stimuli in both areas. Analysis of resting-state fMRI signal correlation, LFP coherence, and spike cross-correlation revealed significantly reduced functional connectivity between deafferented areas 3b and S2. The degrees of reductions in stimulus responsiveness and FC after deafferentation differed across fMRI, LFP, and spiking signals. The reduction of FC was much weaker than that of stimulus-evoked responses. Whereas the largest stimulus-evoked signal drop (∼80%) was observed in LFP signals, the greatest FC reduction was detected in the spiking activity (∼30%). fMRI signals showed mild reductions in stimulus responsiveness (∼25%) and FC (∼20%). The overall deafferentation-induced changes were quite similar in areas 3b and S2 across signals. Here we demonstrated that FC strength between areas 3b and S2 was much weakened by dorsal column lesion, and stimulus response reduction and FC disruption in fMRI covary with those of LFP and spiking signals in deafferented areas 3b and S2. These findings have important implications for fMRI studies aiming to probe FC alterations in pathological conditions involving deafferentation in humans.SIGNIFICANCE STATEMENT By directly comparing fMRI, local field potential, and spike signals in both tactile stimulation and resting states before and after severe disruption of dorsal column afferent, we demonstrated that reduction in fMRI responses to stimuli is accompanied by weakened resting-state fMRI functional connectivity (FC) in input-deprived and reorganized digit regions in area 3b of the S1 and S2. Concurrent reductions in local field potential and spike FC validated the use of resting-state fMRI signals for probing neural intrinsic FC alterations in pathological deafferented cortex, and indicated that disrupted FC between mesoscale functionally highly related regions may contribute to the behavioral impairments.

Keywords: electrophysiology; fMRI; functional connectivity; nonhuman primate; spinal cord injury.


Figures

Figure 1.
Figure 1.
Experimental setup and illustration of microelectrode mapping and recording sites in areas 3b and S2 in 3 normal animals (SM-CHA, SM-KEE, and SM-4043). A, The locations (blue patches) of area 3b and projected S2 on the brain surface. Purple and blue squares represent the FOV of MRI image and blood vessel image for electrophysiology, respectively. CS, Central sulci; LS, lateral sulci; A, anterior; L, lateral; M, medial; P, posterior. B, Coronal T2-weighted structural image shows the placements of oblique MRI slices. Solid and dotted purple rectangle outlines represent slices 1 and 3 covering area 3b and S2 regions, respectively. Blue patches represent the locations of tactile activation. D, Dorsal; V, ventral; L, left; R, right. C, Methods for identifying area 3b and S2 recording sites. Color-coded dots on the corresponding blood vessel map indicate the microelectrode penetration sites and receptive field properties. Black arrows indicate recording sites in areas 3b and S2. Green dots indicate D1 responsive sites. Cyan dots indicate D2 response sites. Purple dots indicate D3 sites. Orange dots indicate D4 response sites. Navy dots indicate D5 response sites. Black arrows indicate the chosen recording sites within each fMRI activation focus (blue patches). Recording sites were logged and illustrated on the corresponding blood vessel map in each animal. For SM-KEE (D), SM-CHA (E), and SM-4043 (F), tactile stimulus was presented on D2 or D3. Black arrows indicate the recording sites in area 3b (700–900 μm in depth) and area S2 (3500–5000 μm in depth). Electrode penetration sites (small colored dots) on each vessel map show the receptive field of different digits. Color-coded individual digit site is shown by the inset column in each animal. Green dots indicate D1. Cyan dots indicate D2. Purple dots indicate D3. Orange dots indicate D4. Navy dots indicate D5. A, Anterior; L, lateral; M, medial; P, posterior. Solid black lines indicate estimated interarea borders. Dotted black lines indicate estimated digit-face borders.
Figure 2.
Figure 2.
Comparison of the stimulus-evoked fMRI activation and voxelwise rsFC maps of areas 3b and S2 before and after DCL conditions in 3 animals: SM-BUL (A–E), SM-GUA (F–J), and SM-SUP (K–O). A, C, F, H, K, M, Probability activation maps to single digit tactile stimulation in pre-DCL (A, F, K) and post-DCL (C, H, M) conditions. In the imaging session shown in F, it was determined that S2 cortex was sampled on slice 2 based on anatomical landmarks. B, D, G, I, L, N, rsFC maps of area 3b seeds in pre-DCL (B, G, L) and post-DCL (D, I, N) conditions. E, J, O, Overlaid pre- and post-DCL activation maps of area 3b and projected pre- and post-DCL activation maps of S2 on the brain surface blood vessel maps with microelectrode maps of SM-BUL (E), SM-GUA (J), and SM-SUP (O). The paired area 3b-S2 recording sites, indicated by black arrows, are responsive to the same digit stimulation (i.e., sites share receptive fields). Small boxes represent resting-state seeds: blue boxes represent prelesion; green boxes represent postlesion. White squares on MRI images represent the FOV of the blood vessel maps. Blue and green outlines represent prelesion and postlesion activation patterns, respectively. Solid and dashed outlines indicate the area 3b and S2 activation maps. Colored dots indicate the microelectrode mapping sites, with different colors representing receptive fields of different digits (E, J, O, right, column insets) A, Anterior; L, lateral; M, medial; P, posterior.
Figure 3.
Figure 3.
Longitudinal evaluation of food-reaching and food-grasping behaviors following cervical DCL. A, B, Plots of success rates (A) and number of digit flexes (B) at different postoperational time points (weeks) for SM-SUP. Error bars indicate SE.
Figure 4.
Figure 4.
Effects of DCL on tactile stimulus-evoked fMRI response and rsFC between areas 3b and S2. A–C, The activation probability maps in S1 (left image) and S2 (right image) to tactile stimulation on D2/D3 in the prelesion normal (A) and postlesion deafferented (B) cortex. 5/5 indicates 5 of 5 runs. Small blue squares represent the seed voxels. C, Group mean percentage fMRI signal change to stimuli in area 3b (left columns) and S2 (right columns) pre-DCL (red columns) and post-DCL (blue columns) DCL. D–F, Corresponding rsFC maps of the area 3b (left) and S2 (right) seeds in prelesion normal (D) and postlesion deafferented (E) conditions. F, Group mean correlation coefficient values between areas 3b and S2 pre-DCL (red column) versus post-DCL (blue column). A total of 21 prelesion and 14 postlesion runs from 3 animals were acquired for fMRI response measurement (df = 33). A total of 23 prelesion and 13 postlesion runs from 3 animals were acquired for rsfMRI FC measurement (df = 34). *p < 0.05 (unpaired t test). Error bars indicate SE. The representative case is SM-BUL in A, B and D, E.
Figure 5.
Figure 5.
Effects of DCL on tactile stimulus-evoked LFP signal and resting-state LFP coherence between area 3b and S2 neurons. A, B, Examples of event-averaged LFP signal amplitude to stimuli in areas 3b (left) and S2 (right) in normal (A) and lesioned (B) conditions. Black lines near the x-axes indicate the stimulus duration. C, Example of LFP coherence spectrum between areas 3b and S2 at resting state in normal (red line) and lesioned (blue line) animals. Different background colors represent different frequency bands. D, E, Group comparison of LFP power of different frequency bands in areas 3b (D) and S2 (E) in stimulation and resting states in normal and lesioned animals. F, Group LFP coherence between areas 3b and S2 at resting state in normal (red columns) versus deafferented (blue columns) conditions. Paired simultaneous S2 and area 3b electrophysiological data from 20 runs from 3 normal animals, and 12 runs from 3 lesioned animals were included (df = 30). Unpaired t test between normal and deafferented groups, paired t test within each group: *p < 0.05; **p < 0.005; ***p < 0.0005. Error bars indicate SE.
Figure 6.
Figure 6.
Effects of DCL on tactile stimulus-evoked spike activity and cross-correlation of spontaneous resting-state spike activity between area 3b and S2 neurons. A, B, Examples of PSTHs in area 3b (left) and S2 (right) in normal (A) and deafferented (B) conditions. Black bars next to x-axes represent tactile stimulation duration. Time of bin = 10 ms. C, Examples of JPSTH of areas 3b and S2 in normal (left) and lesioned (right) monkeys. The main JPSTH matrix plot represents the correlation of bin (bin = 10 ms) counts of S2 and area 3b neurons around the vibrotactile stimulation event: red arrows indicate stimulus onset; green arrows indicate stimulus offset. Histograms to the left of (area 3b) and below (S2) the matrix are standard perievent histograms. The first (diagonal) histogram to the right of the matrix represents the correlations of near-coincident spikes around the stimulus events. The far-right (oblique) histogram represents the cross-correlations of firings of area 3b and S2 neurons. The peak firing counts and peak correlations are labeled. For example, in normal monkey (left), the peak firing counts of area 3b is 213 and the peak firing counts of S2 is 130, whereas the peak spike activity correlation of areas 3b and S2 is 0.119. D, Examples of cross-correlation of spike activities between area 3b and S2 neurons at resting state in normal (red line) and deafferented (blue line) cortex. E, F, Group comparison of spike rates in stimulation versus resting states in area 3b (E) and S2 (F) in normal versus deafferented cortex. Red columns represent resting state in normal animal. Pink columns represent stimulation in normal animal. Blue columns represent resting state in lesioned animal. Light blue columns represent stimulation in lesioned animal. G, Comparison of spike cross-correlation between area 3b and S2 neurons at resting state in normal (red columns) versus input-deprived (blue columns) animals. A total of 20 runs from 3 normal animals, and a total of 13 runs from 3 lesioned animals were acquired for spike measurement (df = 31). *p < 0.05 (unpaired t test). ***p value <0.0005 (unpaired t test). Error bars indicate SE.
Figure 7.
Figure 7.
Group comparisons of FC between areas 3b and S2, and those signal changes in normal and input-deprived monkeys used by fMRI, LFP, and spike activity. A, B, Signal changes of fMRI, LFP, and spike activity induced by tactile stimulus in areas 3b (A) and S2 (B) in normal versus input-deprived animals. Red columns represent normal condition. Blue columns represent lesioned condition. C, D, Signal changes of fMRI, LFP, and spike activity induced by tactile stimulus in area 3b versus S2 in normal (C) and lesioned animals (D). The y-axis scale bars in C and D are different. Red lines indicate area 3b. Blue lines indicate S2. E, Summary of rsFC between areas 3b and S2 in normal (red columns) versus lesioned (blue columns) animals derived from different signals. F, Relationship between evoked signal change in areas 3b and S2, and FC change between areas 3b and S2, induced by deafferentation. *p < 0.05 (unpaired t test between normal and lesioned group). **p < 0.005 (unpaired t test between normal and lesioned group). ***p < 0.0005 (unpaired t test between normal and lesioned group).
Figure 8.
Figure 8.
Histological evaluation of the level and extent of the lesion in the spinal cord, and CTB-labeled terminations in the cuneate nucleus (CuN) of the brainstem in 3 monkeys (A–C, SM-GUA; D–F, SM-BUL; and G–I, SM-SUP). A, D, G, One coronal section of the spinal cord showing the location and level of the lesion. Cervical segments 4–7 (C4–C7) and the CTB injections sites on digits 1, 3, and 5 (bottom two hand inserts) are marked. G, Two pin holes at C3 and D6 levels are visible. CTB stains are missing in coronal sections of cord (D, G). B, E, H, Examples of axial CTB-immunoreacted sections through cuneate nuclei of the brainstem. The CuN on each section is outlined. Numbers 1, 3, and 5 indicate the CTB label clusters resulting from injections on digits 1, 3, and 5, respectively. There are a few detectable CTB-labeled terminations on the lesioned side. *Normal sides. C, F, I, Reconstructed transverse sections of the spinal cord showing the extent of the lesion in black patches. The lesions were reconstructed from a series of horizontally cut sections.

Similar articles

Cited by

References

    1. Baranauskas G, Maggiolini E, Vato A, Angotzi G, Bonfanti A, Zambra G, Spinelli A, Fadiga L (2012) Origins of 1/f2 scaling in the power spectrum of intracortical local field potential. J Neurophysiol 107:984–994. 10.1152/jn.00470.2011 - DOI - PubMed
    1. Barbieri F, Mazzoni A, Logothetis NK, Panzeri S, Brunel N (2014) Stimulus dependence of local field potential spectra: experiment versus theory. J Neurosci 34:14589–14605. 10.1523/JNEUROSCI.5365-13.2014 - DOI - PMC - PubMed
    1. Berens P, Keliris GA, Ecker AS, Logothetis NK, Tolias AS (2008) Feature selectivity of the gamma-band of the local field potential in primate primary visual cortex. Front Neurosci 2:199–207. 10.3389/neuro.01.037.2008 - DOI - PMC - PubMed
    1. Biswal B, Yetkin FZ, Haughton VM, Hyde JS (1995) Functional connectivity in the motor cortex of resting human brain using echo-planar MRI. Magn Reson Med 34:537–541. 10.1002/mrm.1910340409 - DOI - PubMed
    1. Boynton GM. (2011) Spikes, BOLD, attention, and awareness: a comparison of electrophysiological and fMRI signals in V1. J Vis 11:12. 10.1167/11.5.12 - DOI - PMC - PubMed

Publication types

LinkOut - more resources