. 2017 Nov 22;37(47):11323-11334.
doi: 10.1523/JNEUROSCI.2113-17.2017. Epub 2017 Oct 16.

An αII Spectrin-Based Cytoskeleton Protects Large-Diameter Myelinated Axons from Degeneration

Affiliations

An αII Spectrin-Based Cytoskeleton Protects Large-Diameter Myelinated Axons from Degeneration

Claire Yu-Mei Huang et al. J Neurosci. .

Abstract

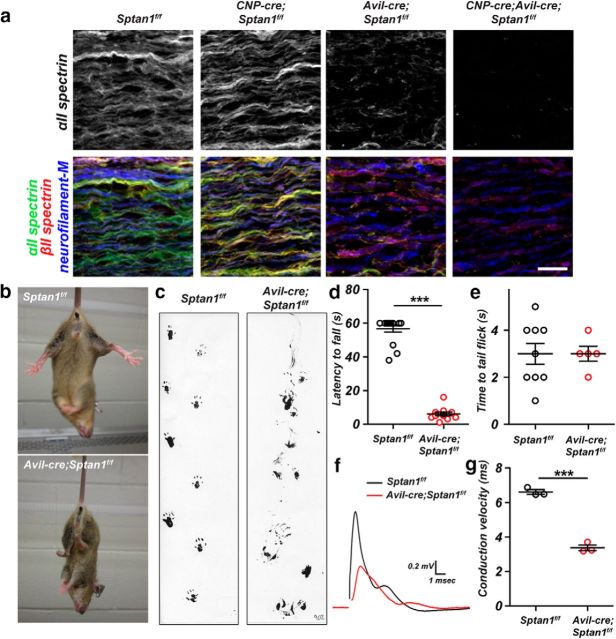
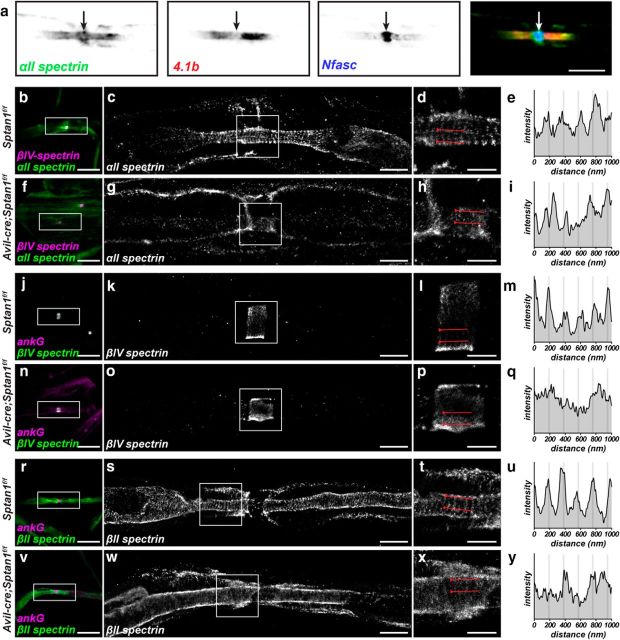
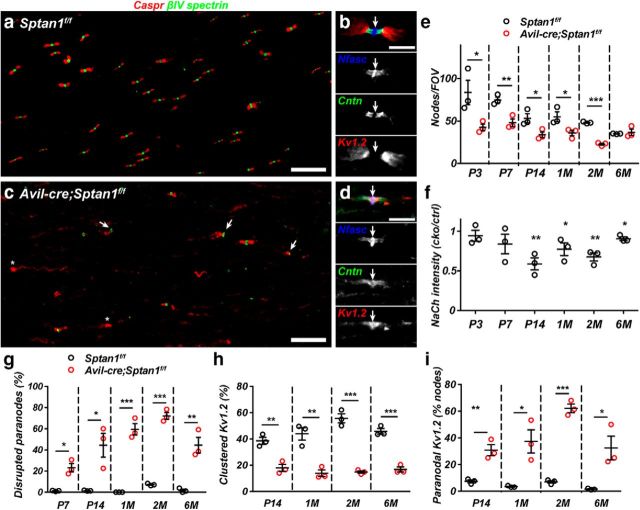
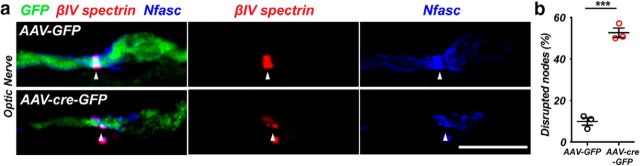
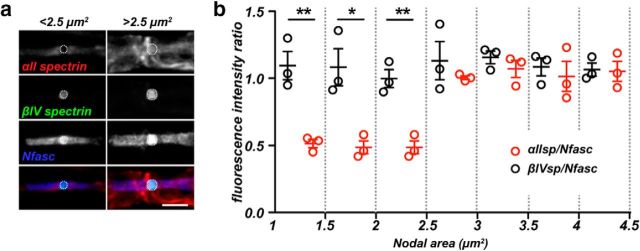
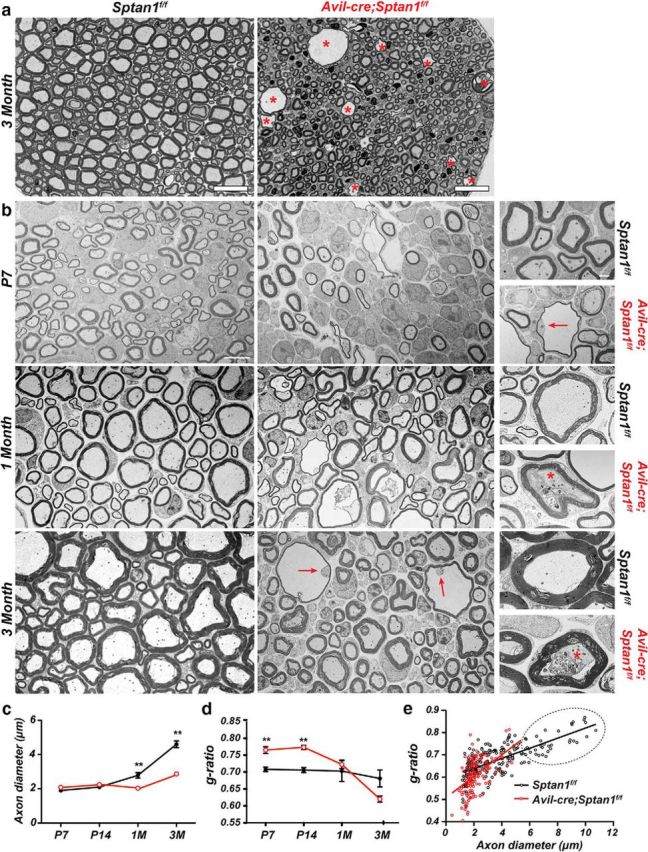
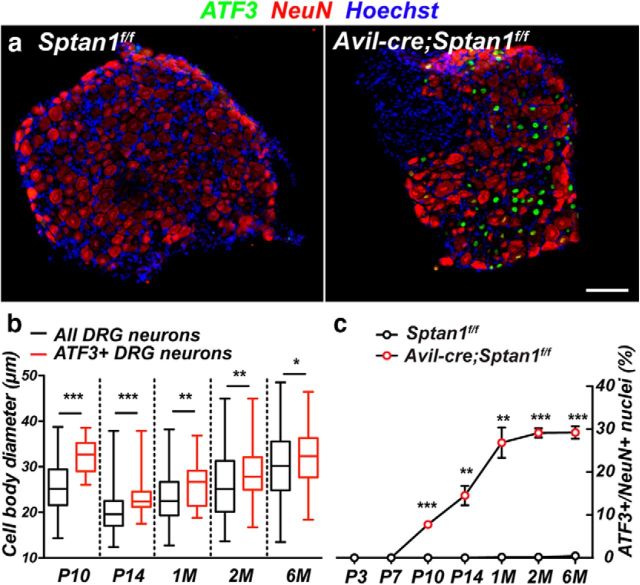
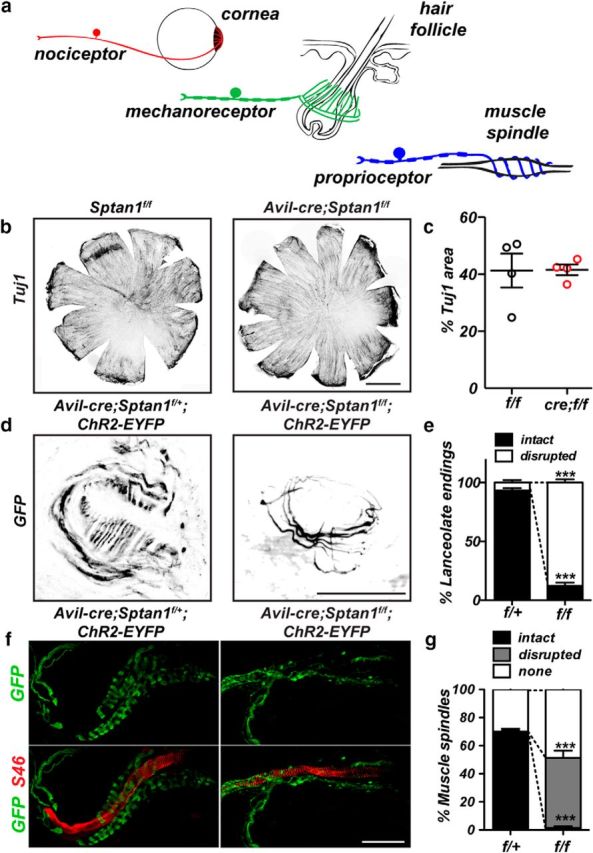
Axons must withstand mechanical forces, including tension, torsion, and compression. Spectrins and actin form a periodic cytoskeleton proposed to protect axons against these forces. However, because spectrins also participate in assembly of axon initial segments (AISs) and nodes of Ranvier, it is difficult to uncouple their roles in maintaining axon integrity from their functions at AIS and nodes. To overcome this problem and to determine the importance of spectrin cytoskeletons for axon integrity, we generated mice with αII spectrin-deficient peripheral sensory neurons. The axons of these neurons are very long and exposed to the mechanical forces associated with limb movement; most lack an AIS, and some are unmyelinated and have no nodes. We analyzed αII spectrin-deficient mice of both sexes and found that, in myelinated axons, αII spectrin forms a periodic cytoskeleton with βIV and βII spectrin at nodes of Ranvier and paranodes, respectively, but that loss of αII spectrin disrupts this organization. Avil-cre;Sptan1f/f mice have reduced numbers of nodes, disrupted paranodal junctions, and mislocalized Kv1 K+ channels. We show that the density of nodal βIV spectrin is constant among axons, but the density of nodal αII spectrin increases with axon diameter. Remarkably, Avil-cre;Sptan1f/f mice have intact nociception and small-diameter axons, but severe ataxia due to preferential degeneration of large-diameter myelinated axons. Our results suggest that nodal αII spectrin helps resist the mechanical forces experienced by large-diameter axons, and that αII spectrin-dependent cytoskeletons are also required for assembly of nodes of Ranvier.SIGNIFICANCE STATEMENT A periodic axonal cytoskeleton consisting of actin and spectrin has been proposed to help axons resist the mechanical forces to which they are exposed (e.g., compression, torsion, and stretch). However, until now, no vertebrate animal model has tested the requirement of the spectrin cytoskeleton in maintenance of axon integrity. We demonstrate the role of the periodic spectrin-dependent cytoskeleton in axons and show that loss of αII spectrin from PNS axons causes preferential degeneration of large-diameter myelinated axons. We show that nodal αII spectrin is found at greater densities in large-diameter myelinated axons, suggesting that nodes are particularly vulnerable domains requiring a specialized cytoskeleton to protect against axon degeneration.

Keywords: axon; cytoskeleton; degeneration; node of Ranvier; spectrin.


Figures

Figure 1.
Figure 1.
Sensory neuron-specific deletion of αII spectrin. a, Teased dorsal roots of P14 Sptan1f/f, CNP-cre;Sptan1f/f, Avil-cre; Sptan1f/f, and CNP-cre;Avil-cre;Sptan1f/f mice immunostained with antibodies against αII spectrin (green), βII spectrin (red), and neurofilament-M (blue). Scale bar, 20 μm. b, Avil-cre; Sptan1f/f mice show a hind-limb clasping reflex. c, Footprint assay for 1-month-old Sptan1f/f and Avil-cre; Sptan1f/f mice. d, Wirehang test performed on 1-month-old mice. Sptan1f/f, N = 16; Avil-cre; Sptan1f/f, N = 12. Data are mean ± SEM. ***p = 2.808E-18, t(26) = 21.90. e, Tail immersion test performed on 1-month-old mice. Sptan1f/f: N = 9; Avil-cre; Sptan1f/f: N = 5. Data are mean ± SEM. f, Representative CAPs recorded from 1-month-old Sptan1f/f (black) and Avil-cre; Sptan1f/f (red) dorsal roots. g, Conduction velocities recorded from dorsal roots of 1-month-old mice. Sptan1f/f, N = 3 mice, 14 dorsal roots; Avil-cre; Sptan1f/f: N = 3 mice, 15 dorsal roots. Data are mean ± SEM. ***p = 0.0001, t(4) = 15.33.
Figure 2.
Figure 2.
αII spectrin is enriched at nodes of Ranvier in large-diameter axons. a, Detergent-extracted adult sciatic nerve node of Ranvier labeled for αII spectrin (green), protein 4.1b (red), and Nfasc (blue). Arrow indicates the position of the node. Scale bar, 5 μm. b–y, Teased dorsal root axons from 5-month-old Sptan1f/f and Avil-cre;Sptan1f/f mice. b–i, Conventional immunofluorescence (magenta represents βIV spectrin; green represents αII spectrin; b, f) and STORM imaging (αII spectrin; c, d, g, h) of control Sptan1f/f (b–d) and αII spectrin-deficient Avil-cre; Sptan1f/f (f–h) mouse dorsal roots. c, g, Boxes surround nodes and correspond to the STORM images shown in d and h, respectively. The regions between the lines in d and h were used to generate an αII spectrin intensity profile (e, i). Scale bars: b, f, 10 μm; c, g, 2 μm; d, h, 1 μm. j–q, Conventional immunofluorescence (magenta represents ankG; green represents βIV spectrin; j, n) and STORM imaging (βIV spectrin; k, l, o, p) of control Sptan1f/f (j–l) and αII spectrin-deficient Avil-cre; Sptan1f/f (n–p) mouse dorsal roots. k, o, Boxes surround nodes and correspond to the STORM images shown in l and p, respectively. l, p, The regions between the lines were used to generate a βIV spectrin intensity profile (m, q). Scale bars: j, n, 10 μm; k, o, 2 μm; l, p, 1 μm. r–y, Conventional immunofluorescence (magenta represents ankG; green represents βII spectrin; r, v) and STORM imaging (βII spectrin; s, t, w, x) of control Sptan1f/f (r–t) and αII spectrin-deficient Avil-cre; Sptan1f/f (v–x) mouse dorsal roots. s, w, Boxes are located in paranodal regions and correspond to the STORM images shown in t and x, respectively. t, x, The regions between the lines were used to generate a βII spectrin intensity profile (u, y). Scale bars: r, v, 10 μm; s, w, 2 μm; t, x, 1 μm.
Figure 3.
Figure 3.
Nodes of Ranvier are disrupted in αII spectrin-deficient axons. a, Sections of dorsal roots from a 2-month-old Sptan1f/f mouse were immunostained for Caspr (red) and βIV spectrin (green). Scale bar, 20 μm. b, A dorsal root node of Ranvier from a 2-month-old Sptan1f/f mouse immunostained for Nfasc (blue), contactin (Cntn) (green), and kv1.2 (red). Arrow indicates the node. Scale bar, 5 μm. c, Sections of dorsal roots from a 2-month-old Avil-cre;Sptan1f/f mouse were immunostained for Caspr (red) and βIV spectrin (green). Scale bar, 20 μm. d, A dorsal root node of Ranvier from a 2-month-old Avil-cre;Sptan1f/f mouse immunostained for Nfasc (blue), contactin (Cntn) (green), and kv1.2 (red). Arrow indicates the node. Scale bar, 5 μm. e, The number of nodes per FOV, determined by βIV spectrin immunostaining in dorsal roots from Sptan1f/f and Avil-cre; Sptan1f/f mice. P3: *p = 0.0498, t(4) = 2.781; P7: **p = 0.0090, t(4) = 4.750; P14: *p = 0.0394, t(4) = 3.015; 1 month: *p = 0.0451, t(4) = 2.878; 2 months: ***p = 3.6123E-05, t(4) = 20.11; 6 months: p = 0.6720, t(4) = 0.4560. f, The intensity of Na+ channel (NaCh) immunostaining in dorsal roots from Sptan1f/f and Avil-cre; Sptan1f/f mice. The intensity was calculated as a ratio of the average nodal Na+ channel immunoreactivity in the Avil-cre; Sptan1f/f mouse divided by the average nodal Na+ channel immunoreactivity in Sptan1f/f mice. Each data point indicates a pair of matched Sptan1f/f and Avil-cre; Sptan1f/f mice that were immunostained and analyzed at the same time. P3: p = 0.5311, t(4) = 0.6848; P7: p = 0.2051, t(4) = 1.512; P14: **p = 0.0059, t(4) = 5.345; 1 month: *p = 0.0121, t(4) = 4.352; 2 months: **p = 0.0053, t(4) = 5.496; 6 months: *p = 0.0162, t(4) = 3.995. g, The percentage of disrupted paranodes indicated by aberrant Caspr immunostaining as a function of age. P7: *p = 0.0049, t(4) = 5.622; P14: *p = 0.0187, t(4) = 3.822; 1 month: ***p = 0.0004, t(4) = 10.91; 2 months: ***p = 4.10125E-05, t(4) = 19.47; 6 months: **p = 0.0046, t(4) = 5.725. h, The percentage of dorsal root nodes of Ranvier with flanking clustered juxtaparanodal kv1.2-containing K+ channels as a function of age. P14: **p = 0.0054, t(4) = 5.491; 1 month: **p = 0.0049, t(4) = 5.628; 2 months: ***p = 0.0003, t(4) = 11.33; 6 months: ***p = 0.0005, t(4) = 10.33. i, The percentage of paranodes that also show Kv1.2 immunoreactivity. P14: **p = 0.0055, t(4) = 5.447; 1 month: *p = 0.0174, t(4) = 3.913; 2 months: ***p = 7.61026E-05, t(4) = 16.66; 6 months: *p = 0.0252, t(4) = 3.489. e–i, N = 3 mice per genotype at each time point indicated.
Figure 4.
Figure 4.
a, Sptan1f/f mice were intravitreally injected with AAV-GFP (control) or AAV-cre-GFP (KO). One month later, optic nerves were immunostained for GFP (green), βIV spectrin (red), and Nfasc (blue). Arrowheads indicate the node. Scale bar, 5 μm. b, The percentage of disrupted nodes in GFP+ axons. N = 3 mice for each indicated virus. ***p = 0.0001, t(4) = 14.71.
Figure 5.
Figure 5.
a, Immunolabeling of small (<2.5 μm2) and large (>2.5 μm2) nodes of Ranvier for αII spectrin (red), βIV spectrin (green), and Nfasc (blue). Fluorescence intensities were measured inside of the dotted circles and used to calculate the fluorescence intensity ratios shown in b. Scale bar, 10 μm. b, The fluorescence intensity ratio of αII spectrin/Nfasc (red) and βIV spectrin/Nfasc (black) as a function of nodal area. N = 3 mice. Data are mean ± SEM. 1–1.5: **p = 0.0061, t(4) = 5.285; 1.5–2: *p = 0.0152, t(4) = 4.071; 2–2.5: **p = 0.0034, t(4) = 6.212; 2.5–3: p = 0.4245, t(4) = 0.8884; 3–3.5: p = 0.3394, t(4) = 1.084; 3.5–4: p = 0.6175, t(4) = 0.5406; 4–4.5: p = 0.8959, t(4) = 0.1394.
Figure 6.
Figure 6.
Large-diameter axons lacking αII spectrin degenerate. a, Toluidine blue-stained dorsal root cross sections from 3-month-old Sptan1f/f and Avil-cre; Sptan1f/f mice. Asterisks indicate degenerating axons. Scale bar, 20 μm. b, TEM images of dorsal root cross sections from Sptan1f/f and Avil-cre; Sptan1f/f mice at P7, 1 month, and 3 months of age. Scale bar, 4 μm. Right panels, Higher-magnification images of individual axons. Arrows indicate the degenerating axons. Asterisks indicate degenerating axons filled with vesicles and debris. Scale bar, 1 μm. c, Axon diameters at the different ages shown for Sptan1f/f and Avil-cre; Sptan1f/f mice. N = 3 mice per genotype at each time point indicated. Data are mean ± SEM. P7: p = 0.0563, t(4) = 2.662; P14: p = 0.2798, t(4) = 1.249; 1 month: **p = 0.0093, t(4) = 4.708; 3 month: **p = 0.0014, t(4) = 7.947. d, g-ratios at each time point indicated for Sptan1f/f and Avil-cre; Sptan1f/f mice. N = 3 mice per genotype at each time point indicated. Data are mean ± SEM. P7: **p = 0.0058, t(4) = 5.376; P14: **p = 0.0010, t(4) = 8.573; 1 month: p = 0.6481, t(4) = 0.4927; 3 month: p = 0.0856, t(4) = 2.271. e, Scatterplot of g-ratio versus axon diameter from dorsal roots of 3-month-old Sptan1f/f and Avil-cre; Sptan1f/f mice. Dotted area represents Avil-cre; Sptan1f/f mice devoid of large-diameter axons. Sptan1f/f, n = 188 axons; Avil-cre; Sptan1f/f, n = 164 axons.
Figure 7.
Figure 7.
Large-diameter neurons lacking αII spectrin are labeled with injury markers. a, DRGs from 1-month-old control Sptan1f/f and αII spectrin-deficient Avil-cre; Sptan1f/f mice were immunostained using antibodies against ATF3 (green), NeuN (red), and Hoechst (blue). ATF3 was used as an injury marker. Scale bar, 50 μm. b, DRG neuron diameter at the indicated time points. N = 9, 12, 18, 11, and 16 DRGs at P10, P14, 1 month, 2 months, and 6 months, respectively. Data are presented as box-and-whisker plots. P10: ***p = 0.0005, t(145) = 3.559; P14: ***p = 0.0006, t(145) = 3.494; 1 month: **p = 0.0018, t(242) = 3.159; 2 months: **p = 0.0086, t(200) = 2.653; 6 months: *p = 0.0320, t(284) = 2.155. c, Quantification of ATF3+ neurons in DRGs across different stages. For Sptan1f/f mice: N = 11, 10, 9, 8, 14, 10, and 17 DRGs at P3, P7, P10, P14, 1 month, 2 months, and 6 months, respectively. For Avil-cre; Sptan1f/f mice: N = 11, 9, 9, 12, 18, 11, and 16 DRGs at P3, P7, P10, P14, 1 month, 2 months, and 6 months, respectively. P7: p = 0.3739, t(4) = 1; P10: ***p = 0.0002, t(4) = 12.8552; P14: **p = 0.0029, t(4) = 6.4514; 1 month: **p = 0.0016, t(4) = 7.558; 2 months: ***p = 1.08206E-05, t(4) = 27.23; 6 months: ***p = 3.76902E-05, t(4) = 19.89.
Figure 8.
Figure 8.
a, Diagram illustrating (1) innervation of cornea by small-diameter axon nociceptors, (2) the lanceolate endings and large-diameter axons of mechanoreceptors surrounding hair cells, and (3) the stretch-sensitive large-diameter axons of proprioceptors that form a muscle spindle as the axon spirals around intrafusal muscle fibers. b, Corneas from 6-week-old control Sptan1f/f and αII spectrin-deficient Avil-cre; Sptan1f/f mice immunostained against Tuj1. Scale bar, 1 mm. c, The percentage of cornea that is Tuj1+. N = 4 corneas. Data are mean ± SEM. d, Hair follicles in skin from 2-month-old control Avil-cre; Sptan1f/+;ChR2-EYFP and sensory neuron-specific αII spectrin-deficient Avil-cre; Sptan1f/f;ChR2-EYFP mice were immunostained against GFP. Scale bar, 20 μm. e, The percentage of hair follicles with intact lanceolate endings in Avil-cre; Sptan1f/+;ChR2-EYFP (f/+) and Avil-cre; Sptan1f/f;ChR2-EYFP (f/f) mice. N = 3, 2-month-old animals. Data are mean ± SEM. Intact: ***p = 1.83392E-05, t(4) = 23.85; disrupted: ***p = 1.94369E-05, t(4) = 23.50. f, Gastrocnemius muscles from 2-month-old control Avil-cre; Sptan1f/+;ChR2-EYFP and sensory neuron-specific αII spectrin-deficient Avil-cre; Sptan1f/f;ChR2-EYFP mice were immunostained using antibodies against GFP and S46. Muscle spindles coil around S46-labeled intrafusal muscle fibers. Scale bar, 50 μm. g, The percentage of intact and disrupted muscle spindles in Avil-cre; Sptan1f/+;ChR2-EYFP (f/+) and Avil-cre; Sptan1f/f;ChR2-EYFP (f/f) mice. N = 3, 2-month-old animals. Intact: ***p = 5.2687E-05, t(4) = 18.28; disrupted: ***p = 0.0007, t(4) = 9.353; none: p = 0.0544, t(4) = 2.678.

Similar articles

Cited by

References

    1. Amor V, Zhang C, Vainshtein A, Zhang A, Zollinger DR, Eshed-Eisenbach Y, Brophy PJ, Rasband MN, Peles E (2017) The paranodal cytoskeleton clusters Na+ channels at nodes of Ranvier. eLife 6:e21392. 10.7554/eLife.21392 - DOI - PMC - PubMed
    1. Bennett V, Lorenzo DN (2013) Spectrin- and ankyrin-based membrane domains and the evolution of vertebrates. Curr Top Membr 72:1–37. 10.1016/B978-0-12-417027-8.00001-5 - DOI - PubMed
    1. Berghs S, Aggujaro D, Dirkx R Jr, Maksimova E, Stabach P, Hermel JM, Zhang JP, Philbrick W, Slepnev V, Ort T, Solimena M (2000) betaIV spectrin, a new spectrin localized at axon initial segments and nodes of Ranvier in the central and peripheral nervous system. J Cell Biol 151:985–1002. 10.1083/jcb.151.5.985 - DOI - PMC - PubMed
    1. Berglund EO, Murai KK, Fredette B, Sekerková G, Marturano B, Weber L, Mugnaini E, Ranscht B (1999) Ataxia and abnormal cerebellar microorganization in mice with ablated contactin gene expression. Neuron 24:739–750. 10.1016/S0896-6273(00)81126-5 - DOI - PubMed
    1. Bhat MA, Rios JC, Lu Y, Garcia-Fresco GP, Ching W, St Martin M, Li J, Einheber S, Chesler M, Rosenbluth J, Salzer JL, Bellen HJ (2001) Axon-glia interactions and the domain organization of myelinated axons requires neurexin IV/Caspr/Paranodin. Neuron 30:369–383. 10.1016/S0896-6273(01)00294-X - DOI - PubMed

Publication types

LinkOut - more resources