

Constitutive Activation of Integrin α9 Augments Self-Directed Hyperplastic and Proinflammatory Properties of Fibroblast-like Synoviocytes of Rheumatoid Arthritis
- PMID: 29038247
- PMCID: PMC5672818
- DOI: 10.4049/jimmunol.1700941
Constitutive Activation of Integrin α9 Augments Self-Directed Hyperplastic and Proinflammatory Properties of Fibroblast-like Synoviocytes of Rheumatoid Arthritis
Abstract
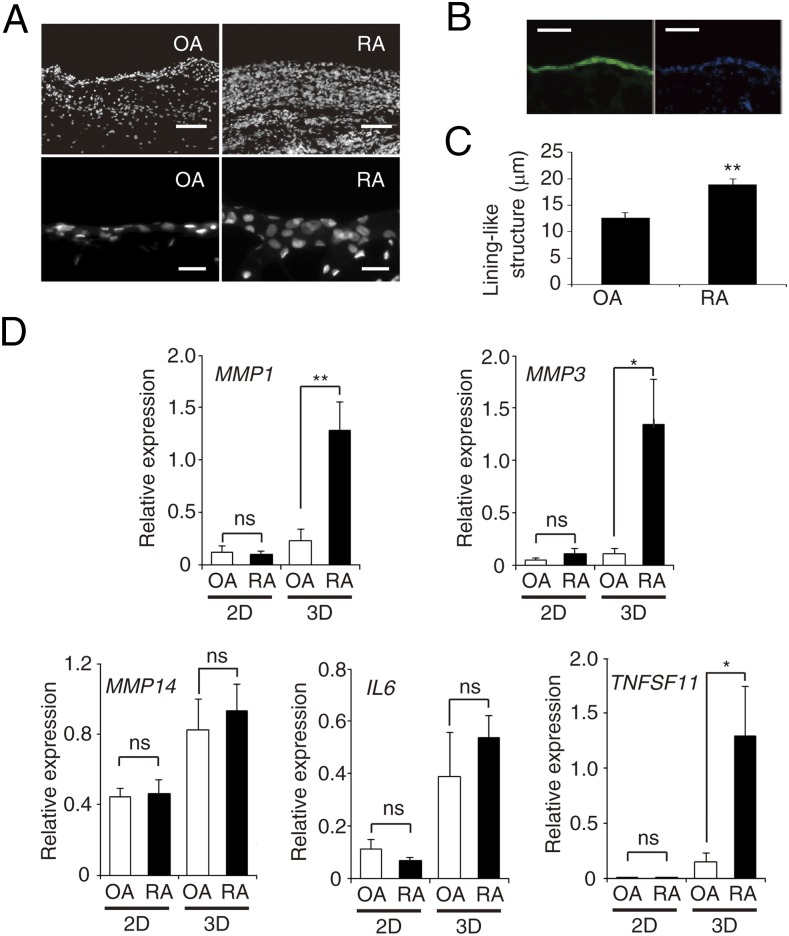
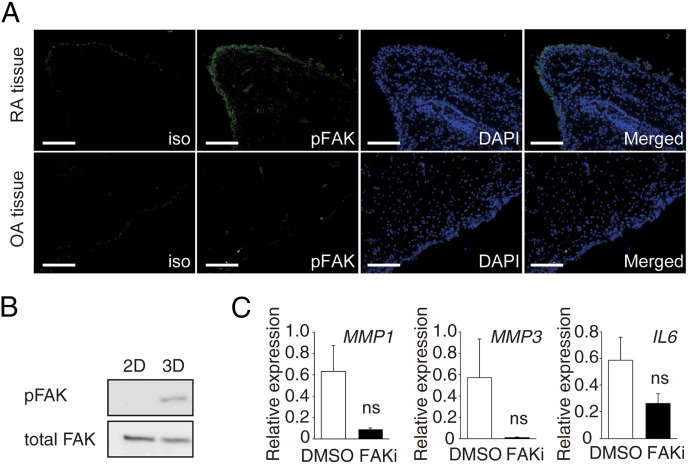
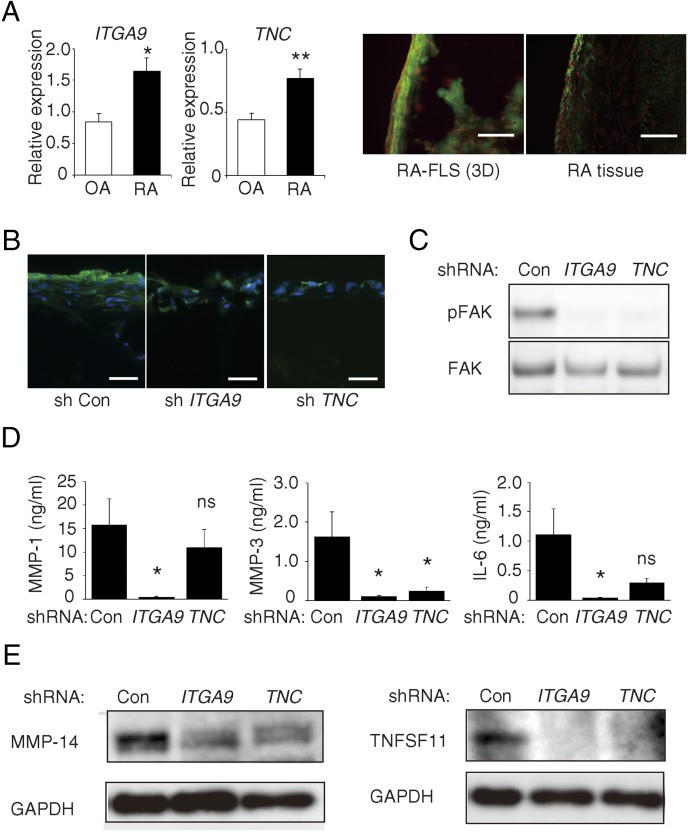
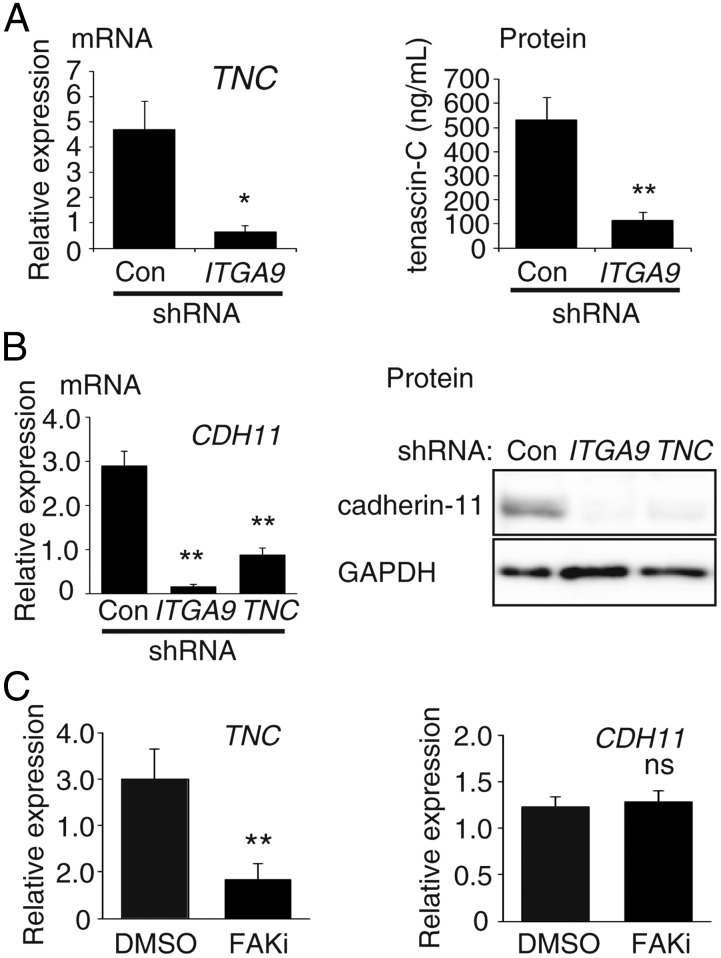
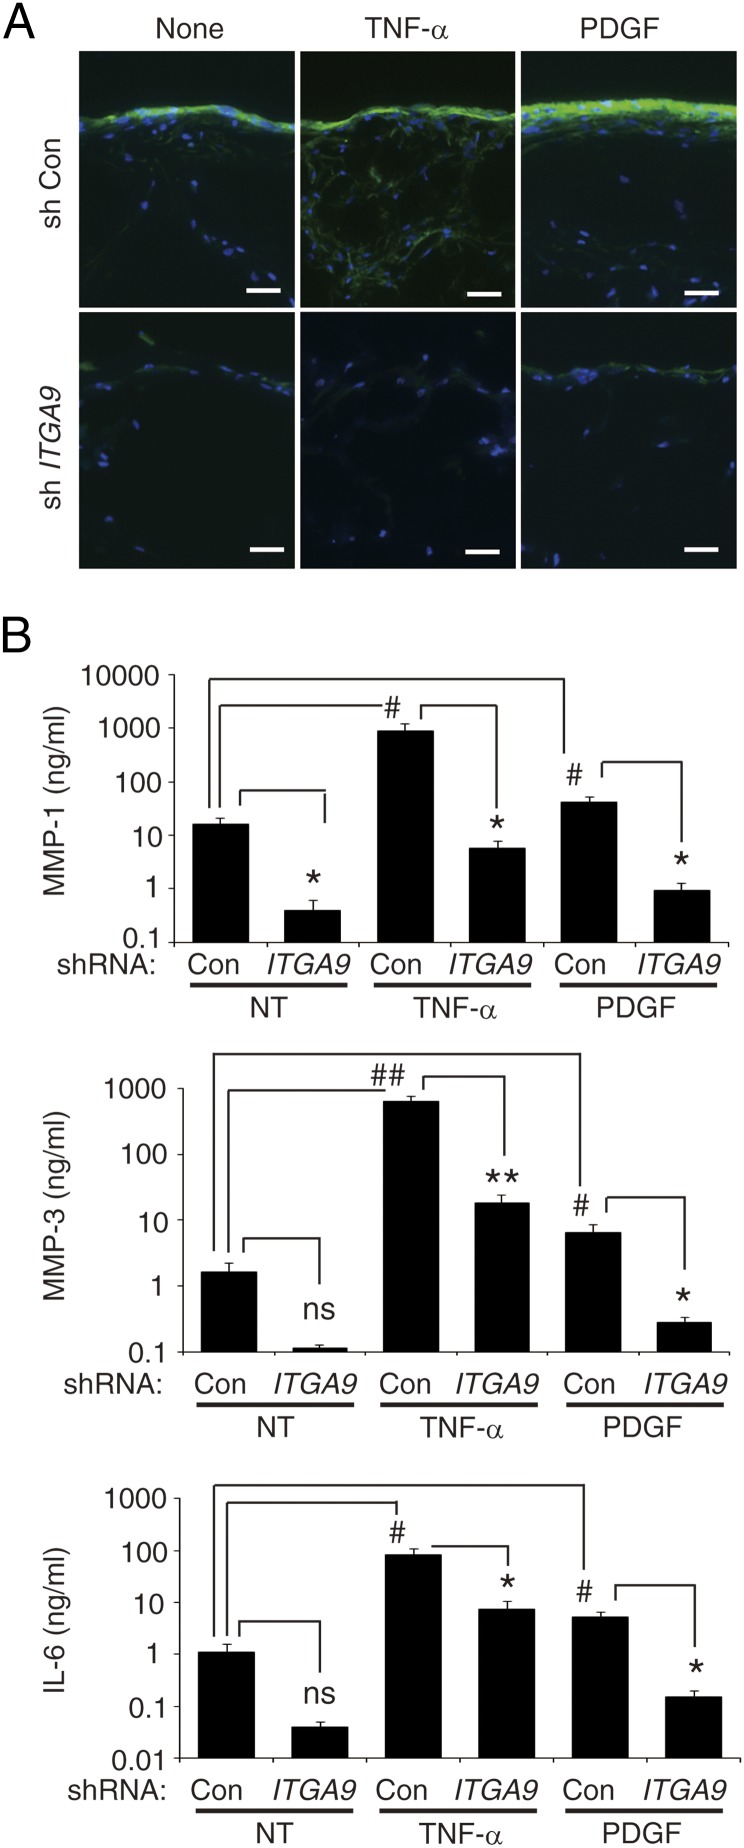
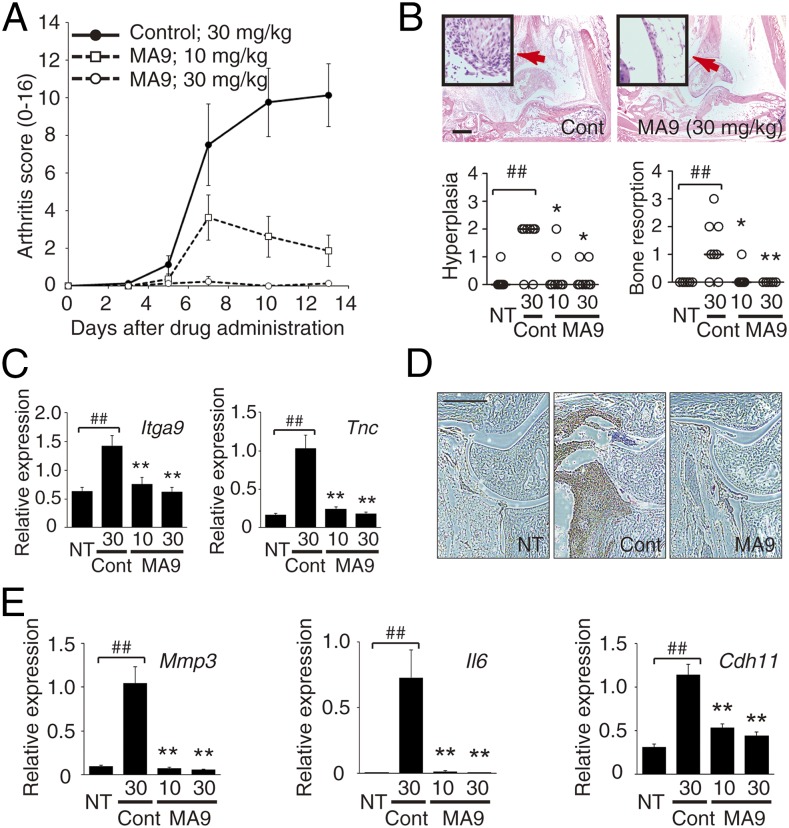
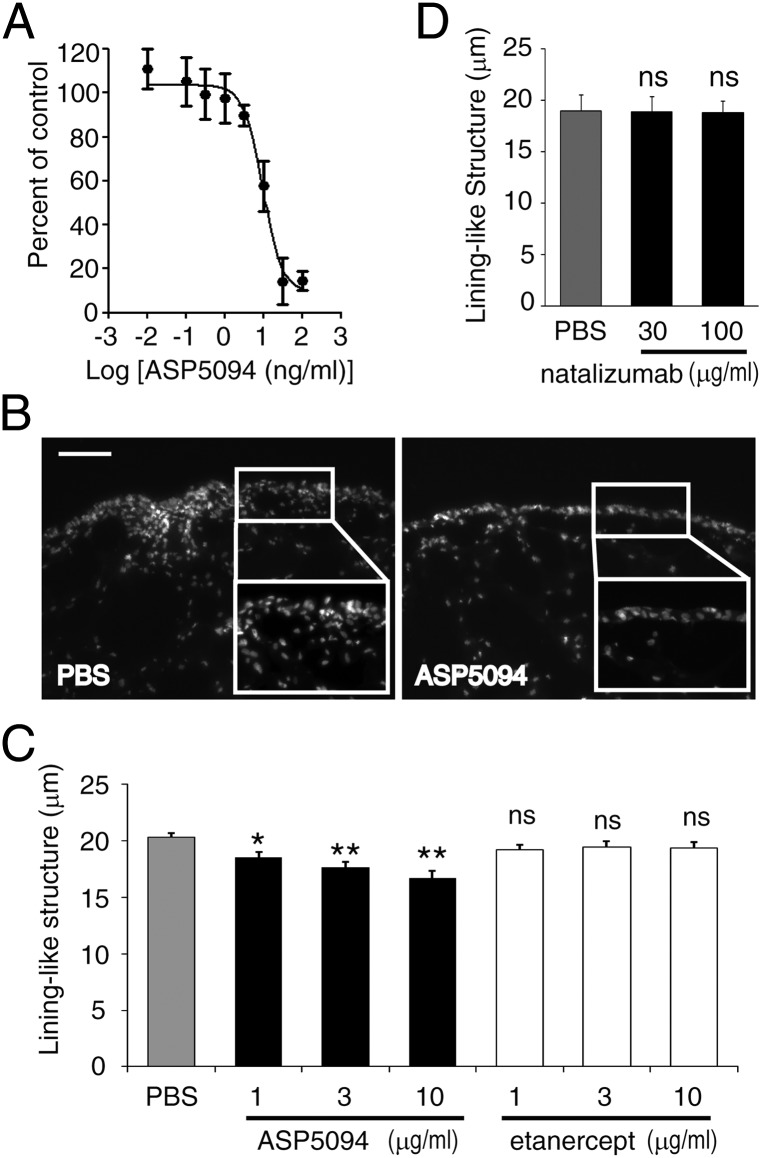
Despite advances in the treatment of rheumatoid arthritis (RA), currently approved medications can have significant side effects due to their direct immunosuppressive activities. Additionally, current therapies do not address residual synovial inflammation. In this study, we evaluated the role of integrin α9 and its ligand, tenascin-C (Tn-C), on the proliferative and inflammatory response of fibroblast-like synoviocytes (FLSs) from RA patients grown in three-dimensional (3D)-micromass culture. FLSs from osteoarthritis patients, when grown in the 3D-culture system, formed self-directed lining-like structures, whereas FLSs from RA tissues (RA-FLSs) developed an abnormal structure of condensed cellular accumulation reflective of the pathogenic features of RA synovial tissues. Additionally, RA-FLSs grown in 3D culture showed autonomous production of proinflammatory mediators. Predominant expression of α9 and Tn-C was observed in the condensed lining, and knockdown of these molecules abrogated the abnormal lining-like structure formation and suppressed the spontaneous expression of matrix metalloproteinases, IL-6, TNFSF11/RANKL, and cadherin-11. Disruption of α9 also inhibited expression of Tn-C, suggesting existence of a positive feedback loop in which the engagement of α9 with Tn-C self-amplifies its own signaling and promotes progression of synovial hyperplasia. Depletion of α9 also suppressed the platelet-derived growth factor-induced hyperplastic response of RA-FLSs and blunted the TNF-α-induced expression of matrix metalloproteinases and IL-6. Finally, α9-blocking Ab also suppressed the formation of the condensed cellular lining by RA-FLSs in 3D cultures in a concentration-related manner. This study demonstrates the central role of α9 in pathogenic behaviors of RA-FLSs and highlights the potential of α9-blocking agents as a nonimmunosuppressive treatment for RA-associated synovitis.
Copyright © 2017 by The American Association of Immunologists, Inc.
Figures
Similar articles
-
Activation of dickkopf-1 and focal adhesion kinase pathway by tumour necrosis factor α induces enhanced migration of fibroblast-like synoviocytes in rheumatoid arthritis.Rheumatology (Oxford). 2016 May;55(5):928-38. doi: 10.1093/rheumatology/kev422. Epub 2015 Dec 29. Rheumatology (Oxford). 2016. PMID: 26715774
-
Citrullinated fibronectin inhibits apoptosis and promotes the secretion of pro-inflammatory cytokines in fibroblast-like synoviocytes in rheumatoid arthritis.Arthritis Res Ther. 2012 Dec 10;14(6):R266. doi: 10.1186/ar4112. Arthritis Res Ther. 2012. PMID: 23217276 Free PMC article.
-
PIM-1 kinase is a novel regulator of proinflammatory cytokine-mediated responses in rheumatoid arthritis fibroblast-like synoviocytes.Rheumatology (Oxford). 2019 Jan 1;58(1):154-164. doi: 10.1093/rheumatology/key261. Rheumatology (Oxford). 2019. PMID: 30204915
-
The p53 status in rheumatoid arthritis with focus on fibroblast-like synoviocytes.Immunol Res. 2021 Jun;69(3):225-238. doi: 10.1007/s12026-021-09202-7. Epub 2021 May 13. Immunol Res. 2021. PMID: 33983569 Review.
-
T-cells interact with B cells, dendritic cells, and fibroblast-like synoviocytes as hub-like key cells in rheumatoid arthritis.Int Immunopharmacol. 2019 May;70:428-434. doi: 10.1016/j.intimp.2019.03.008. Epub 2019 Mar 8. Int Immunopharmacol. 2019. PMID: 30856393 Review.
Cited by
-
Integrin-α9β1 as a Novel Therapeutic Target for Refractory Diseases: Recent Progress and Insights.Front Immunol. 2021 Mar 15;12:638400. doi: 10.3389/fimmu.2021.638400. eCollection 2021. Front Immunol. 2021. PMID: 33790909 Free PMC article. Review.
-
ASP5094, a humanized monoclonal antibody against integrin alpha-9, did not show efficacy in patients with rheumatoid arthritis refractory to methotrexate: results from a phase 2a, randomized, double-blind, placebo-controlled trial.Arthritis Res Ther. 2020 Oct 21;22(1):252. doi: 10.1186/s13075-020-02336-3. Arthritis Res Ther. 2020. PMID: 33087159 Free PMC article. Clinical Trial.
-
Targeting fibroblast-like synoviocytes in rheumatoid arthritis.Curr Opin Pharmacol. 2022 Dec;67:102304. doi: 10.1016/j.coph.2022.102304. Epub 2022 Oct 10. Curr Opin Pharmacol. 2022. PMID: 36228471 Free PMC article. Review.
-
Cytohesin-2/ARNO: A Novel Bridge Between Cell Migration and Immunoregulation in Synovial Fibroblasts.Front Immunol. 2022 Jan 12;12:809896. doi: 10.3389/fimmu.2021.809896. eCollection 2021. Front Immunol. 2022. PMID: 35095899 Free PMC article.
-
Regulation of Immune Responses and Chronic Inflammation by Fibroblast-Like Synoviocytes.Front Immunol. 2019 Jun 19;10:1395. doi: 10.3389/fimmu.2019.01395. eCollection 2019. Front Immunol. 2019. PMID: 31275325 Free PMC article. Review.
References
-
- Bellis E., Scirè C. A., Carrara G., Adinolfi A., Batticciotto A., Bortoluzzi A., Cagnotto G., Caprioli M., Canzoni M., Cavatorta F. P., et al. 2016. Ultrasound-detected tenosynovitis independently associates with patient-reported flare in patients with rheumatoid arthritis in clinical remission: results from the observational study STARTER of the Italian society for rheumatology. Rheumatology 55: 1826–1836. - PubMed
-
- Lisbona M. P., Solano A., Ares J., Almirall M., Salman-Monte T. C., Maymó J. 2016. ACR/EULAR definitions of remission are associated with lower residual inflammatory activity compared with DAS28 remission on hand MRI in rheumatoid arthritis. J. Rheumatol. 43: 1631–1636. - PubMed
-
- Vreju F. A., Filippucci E., Gutierrez M., Di Geso L., Ciapetti A., Ciurea M. E., Salaffi F., Grassi W. 2016. Subclinical ultrasound synovitis in a particular joint is associated with ultrasound evidence of bone erosions in that same joint in rheumatoid patients in clinical remission. Clin. Exp. Rheumatol. 34: 673–678. - PubMed
Publication types
MeSH terms
Substances
LinkOut - more resources
Full Text Sources
Other Literature Sources
Medical
Miscellaneous
