Lipopolysaccharide Potentiates Insulin-Driven Hypoglycemic Shock
- PMID: 29038248
- PMCID: PMC5685187
- DOI: 10.4049/jimmunol.1700820
Lipopolysaccharide Potentiates Insulin-Driven Hypoglycemic Shock
Abstract
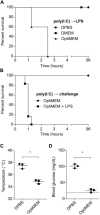
Critically ill patients typically present with hyperglycemia. Treatment with conventional insulin therapy (targeting 144-180 mg/dl) improves patient survival; however, intensive insulin therapy (IIT) targeting normal blood glucose levels (81-108 mg/dl) increases the incidence of moderate and severe hypoglycemia, and increases mortality. Septic patients are especially prone to IIT-induced hypoglycemia, but the mechanism remains unknown. Here, we show that codelivery of insulin with otherwise sublethal doses of LPS induced hypoglycemic shock in mice within 1-2 h. LPS impaired clearance of insulin, which amplified insulin receptor signaling. These effects were mediated by caspase-11, TLR4, and complement, each of which trigger eicosanoid production that potentiates insulin signaling. Finally, in an animal model of sepsis, we observed that Salmonella typhimurium-infected mice exhibited simultaneous impaired insulin clearance coexisting with insulin resistance. Our results raise the possibility that septic patients have impaired insulin clearance, which could increase their susceptibility to hypoglycemia during IIT, contraindicating its use.
Copyright © 2017 by The American Association of Immunologists, Inc.
Figures


Similar articles
-
Innate immunity mediated by MyD88 signal is not essential for induction of lipopolysaccharide-specific B cell responses but is indispensable for protection against Salmonella enterica serovar Typhimurium infection.J Immunol. 2009 Feb 15;182(4):2305-12. doi: 10.4049/jimmunol.0801980. J Immunol. 2009. PMID: 19201885 Free PMC article.
-
TRIM8 Negatively Regulates TLR3/4-Mediated Innate Immune Response by Blocking TRIF-TBK1 Interaction.J Immunol. 2017 Sep 1;199(5):1856-1864. doi: 10.4049/jimmunol.1601647. Epub 2017 Jul 26. J Immunol. 2017. PMID: 28747347
-
[Glycemic control in sepsis and septic shock: friend or foe?].Anaesthesist. 2008 Jan;57(1):43-8. doi: 10.1007/s00101-007-1285-7. Anaesthesist. 2008. PMID: 18034219 Review. German.
-
Cytoplasmic LPS activates caspase-11: implications in TLR4-independent endotoxic shock.Science. 2013 Sep 13;341(6151):1250-3. doi: 10.1126/science.1240988. Science. 2013. PMID: 24031018 Free PMC article.
-
Intensive insulin therapy in septic shock.Crit Care Resusc. 2006 Sep;8(3):230-4. Crit Care Resusc. 2006. PMID: 16930111 Review.
Cited by
-
NAD+ prevents septic shock-induced death by non-canonical inflammasome blockade and IL-10 cytokine production in macrophages.Elife. 2024 Feb 19;12:RP88686. doi: 10.7554/eLife.88686. Elife. 2024. PMID: 38372712 Free PMC article.
-
Gingival-Derived Mesenchymal Stem Cells Protect Against Sepsis and Its Complications.Infect Drug Resist. 2021 Aug 22;14:3341-3355. doi: 10.2147/IDR.S318304. eCollection 2021. Infect Drug Resist. 2021. Retraction in: Infect Drug Resist. 2022 Mar 08;15:913-914. doi: 10.2147/IDR.S364551. PMID: 34456576 Free PMC article. Retracted.
-
Severe hyperglycemia and insulin resistance in patients with SARS-CoV-2 infection: a report of two cases.Clin Diabetes Endocrinol. 2021 May 15;7(1):8. doi: 10.1186/s40842-021-00121-y. Clin Diabetes Endocrinol. 2021. PMID: 33992101 Free PMC article.
-
Association Between Hypoglycemia and the Occurrence of Early Onset Sepsis in Premature Infants.J Pediatric Infect Dis Soc. 2023 Dec 26;12(Supplement_2):S28-S36. doi: 10.1093/jpids/piad067. J Pediatric Infect Dis Soc. 2023. PMID: 38146863 Free PMC article.
-
An overview of the non-canonical inflammasome.Mol Aspects Med. 2020 Dec;76:100924. doi: 10.1016/j.mam.2020.100924. Epub 2020 Nov 11. Mol Aspects Med. 2020. PMID: 33187725 Free PMC article. Review.
References
-
- Medzhitov R, Preston-Hurlburt P, Janeway CA. A human homologue of the Drosophila Toll protein signals activation of adaptive immunity. Nature. 1997;388:394–397. - PubMed
-
- Poltorak A, He X, Smirnova I, Liu MY, Van Huffel C, Du X, Birdwell D, Alejos E, Silva M, Galanos C, Freudenberg M, Ricciardi-Castagnoli P, Layton B, Beutler B. Defective LPS signaling in C3H/HeJ and C57BL/10ScCr mice: mutations in Tlr4 gene. Science. 1998;282:2085–2088. - PubMed
-
- Hoshino K, Takeuchi O, Kawai T, Sanjo H, Ogawa T, Takeda Y, Takeda K, Akira S. Cutting edge: Toll-like receptor 4 (TLR4)-deficient mice are hyporesponsive to lipopolysaccharide: evidence for TLR4 as the Lps gene product. J Immunol. 1999;162:3749–3752. - PubMed
-
- Zhao L, Ohtaki Y, Yamaguchi K, Matsushita M, Fujita T, Yokochi T, Takada H, Endo Y. LPS-induced platelet response and rapid shock in mice: contribution of O-antigen region of LPS and involvement of the lectin pathway of the complement system. Blood. 2002;100:3233–3239. - PubMed
MeSH terms
Substances
Grants and funding
LinkOut - more resources
Full Text Sources
Other Literature Sources
Medical
Molecular Biology Databases

