

A Single-Cell View of the BtsSR/YpdAB Pyruvate Sensing Network in Escherichia coli and Its Biological Relevance
- PMID: 29038258
- PMCID: PMC5717152
- DOI: 10.1128/JB.00536-17
A Single-Cell View of the BtsSR/YpdAB Pyruvate Sensing Network in Escherichia coli and Its Biological Relevance
Abstract
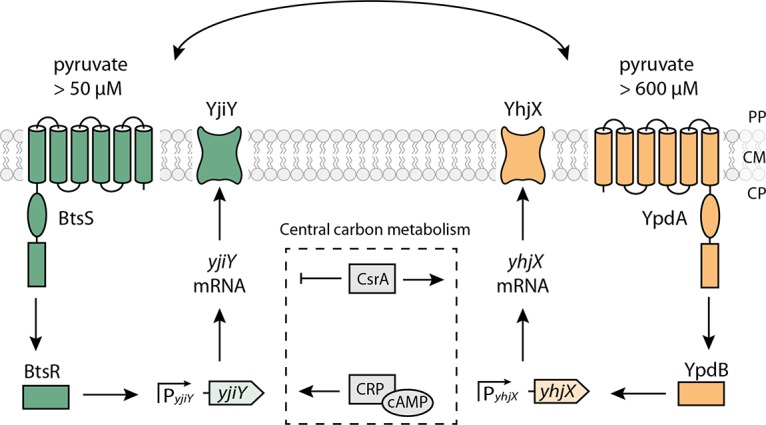
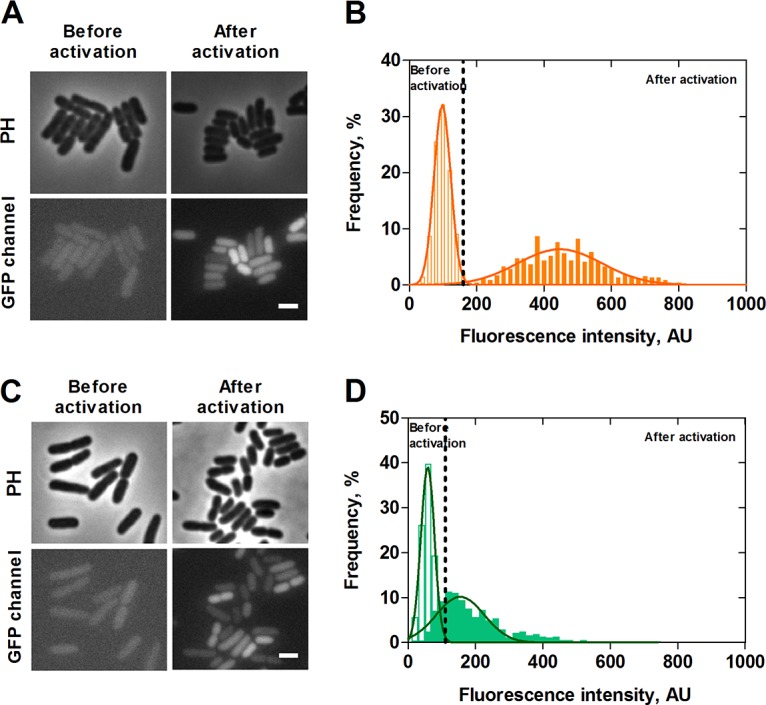
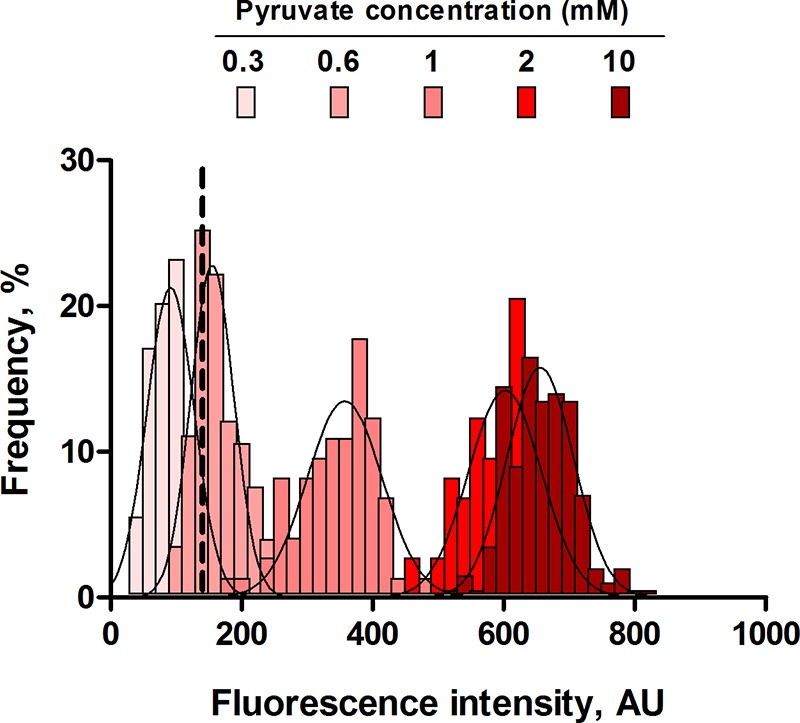
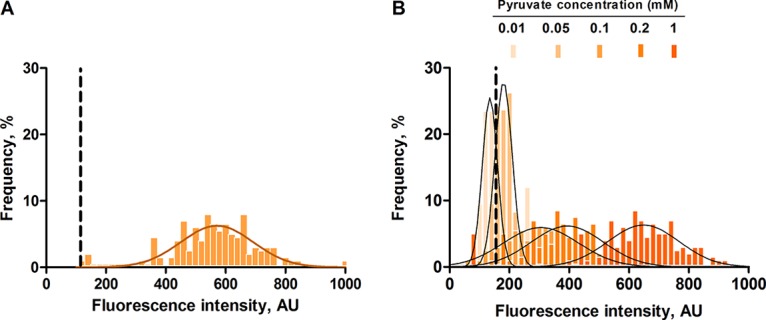
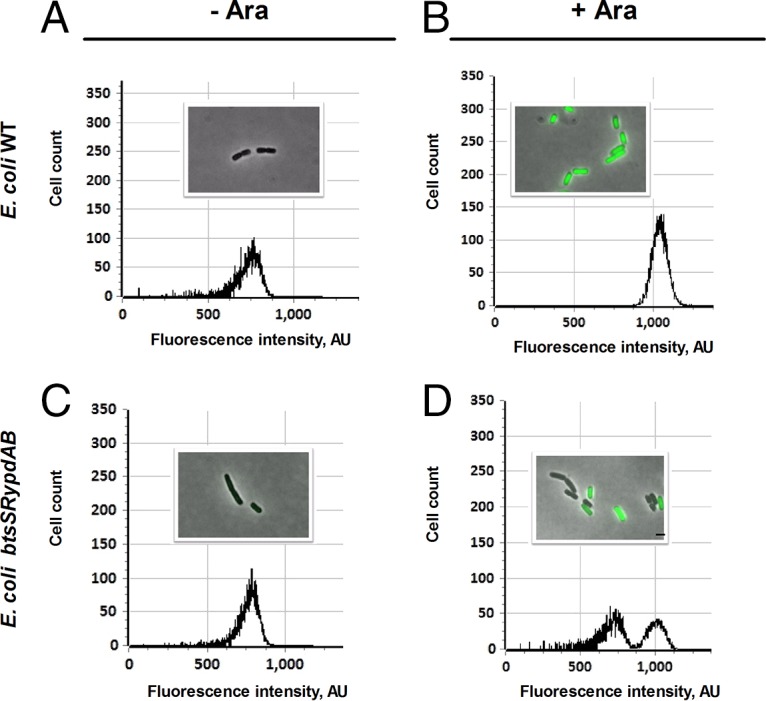
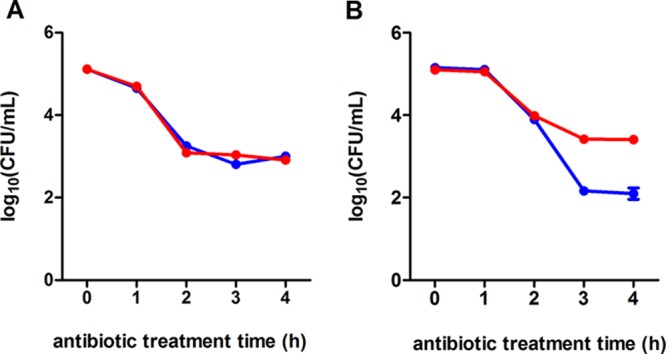
Fluctuating environments and individual physiological diversity force bacteria to constantly adapt and optimize the uptake of substrates. We focus here on two very similar two-component systems (TCSs) of Escherichia coli belonging to the LytS/LytTR family: BtsS/BtsR (formerly YehU/YehT) and YpdA/YpdB. Both TCSs respond to extracellular pyruvate, albeit with different affinities, typically during postexponential growth, and each system regulates expression of a single transporter gene, yjiY and yhjX, respectively. To obtain insights into the biological significance of these TCSs, we analyzed the activation of the target promoters at the single-cell level. We found unimodal cell-to-cell variability; however, the degree of variance was strongly influenced by the available nutrients and differed between the two TCSs. We hypothesized that activation of either of the TCSs helps individual cells to replenish carbon resources. To test this hypothesis, we compared wild-type cells with the btsSR ypdAB mutant under two metabolically modulated conditions: protein overproduction and persister formation. Although all wild-type cells were able to overproduce green fluorescent protein (GFP), about half of the btsSR ypdAB population was unable to overexpress GFP. Moreover, the percentage of persister cells, which tolerate antibiotic stress, was significantly lower in the wild-type cells than in the btsSR ypdAB population. Hence, we suggest that the BtsS/BtsR and YpdA/YpdB network contributes to a balancing of the physiological state of all cells within a population.IMPORTANCE Histidine kinase/response regulator (HK/RR) systems enable bacteria to respond to environmental and physiological fluctuations. Escherichia coli and other members of the Enterobacteriaceae possess two similar LytS/LytTR-type HK/RRs, BtsS/BtsR (formerly YehU/YehT) and YpdA/YpdB, which form a functional network. Both systems are activated in response to external pyruvate, typically when cells face overflow metabolism during post-exponential growth. Single-cell analysis of the activation of their respective target genes yjiY and yhjX revealed cell-to-cell variability, and the range of variation was strongly influenced by externally available nutrients. Based on the phenotypic characterization of a btsSR ypdAB mutant compared to the parental strain, we suggest that this TCS network supports an optimization of the physiological state of the individuals within the population.
Keywords: histidine kinase; nutrient limitation; overflow metabolism; persister cells.
Copyright © 2017 American Society for Microbiology.
Figures
Similar articles
-
Importance of Pyruvate Sensing and Transport for the Resuscitation of Viable but Nonculturable Escherichia coli K-12.J Bacteriol. 2019 Jan 11;201(3):e00610-18. doi: 10.1128/JB.00610-18. Print 2019 Feb 1. J Bacteriol. 2019. PMID: 30420452 Free PMC article.
-
Evidence of Cross-Regulation in Two Closely Related Pyruvate-Sensing Systems in Uropathogenic Escherichia coli.J Membr Biol. 2018 Feb;251(1):65-74. doi: 10.1007/s00232-018-0014-2. Epub 2018 Jan 27. J Membr Biol. 2018. PMID: 29374286 Free PMC article.
-
Comparative analysis of LytS/LytTR-type histidine kinase/response regulator systems in γ-proteobacteria.PLoS One. 2017 Aug 10;12(8):e0182993. doi: 10.1371/journal.pone.0182993. eCollection 2017. PLoS One. 2017. PMID: 28796832 Free PMC article.
-
Signal transduction and adaptive regulation through bacterial two-component systems: the Escherichia coli AtoSC paradigm.Amino Acids. 2009 Sep;37(3):443-58. doi: 10.1007/s00726-009-0241-z. Epub 2009 Feb 8. Amino Acids. 2009. PMID: 19198978 Review.
-
Phenotypic Heterogeneity Generated by Histidine Kinase-Based Signaling Networks.J Mol Biol. 2019 Nov 22;431(23):4547-4558. doi: 10.1016/j.jmb.2019.03.032. Epub 2019 Apr 7. J Mol Biol. 2019. PMID: 30970234 Review.
Cited by
-
Importance of Pyruvate Sensing and Transport for the Resuscitation of Viable but Nonculturable Escherichia coli K-12.J Bacteriol. 2019 Jan 11;201(3):e00610-18. doi: 10.1128/JB.00610-18. Print 2019 Feb 1. J Bacteriol. 2019. PMID: 30420452 Free PMC article.
-
Glyoxylate Shunt and Pyruvate-to-Acetoin Shift Are Specific Stress Responses Induced by Colistin and Ceragenin CSA-13 in Enterobacter hormaechei ST89.Microbiol Spectr. 2023 Aug 17;11(4):e0121523. doi: 10.1128/spectrum.01215-23. Epub 2023 Jun 20. Microbiol Spectr. 2023. PMID: 37338344 Free PMC article.
-
Bacterial metabolic heterogeneity: origins and applications in engineering and infectious disease.Curr Opin Biotechnol. 2020 Aug;64:183-189. doi: 10.1016/j.copbio.2020.04.007. Epub 2020 Jun 20. Curr Opin Biotechnol. 2020. PMID: 32574927 Free PMC article. Review.
-
Mapping niche-specific two-component system requirements in uropathogenic Escherichia coli.Microbiol Spectr. 2024 Apr 2;12(4):e0223623. doi: 10.1128/spectrum.02236-23. Epub 2024 Feb 22. Microbiol Spectr. 2024. PMID: 38385738 Free PMC article.
-
Expanded roles of pyruvate-sensing PdhR in transcription regulation of the Escherichia coli K-12 genome: fatty acid catabolism and cell motility.Microb Genom. 2020 Oct;6(10):mgen000442. doi: 10.1099/mgen.0.000442. Microb Genom. 2020. PMID: 32975502 Free PMC article.
References
MeSH terms
Substances
Grants and funding
LinkOut - more resources
Full Text Sources
Other Literature Sources
Molecular Biology Databases
