

In Vivo Bioluminescent Monitoring of Therapeutic Efficacy and Pharmacodynamic Target Assessment of Antofloxacin against Escherichia coli in a Neutropenic Murine Thigh Infection Model
- PMID: 29038275
- PMCID: PMC5740385
- DOI: 10.1128/AAC.01281-17
In Vivo Bioluminescent Monitoring of Therapeutic Efficacy and Pharmacodynamic Target Assessment of Antofloxacin against Escherichia coli in a Neutropenic Murine Thigh Infection Model
Abstract
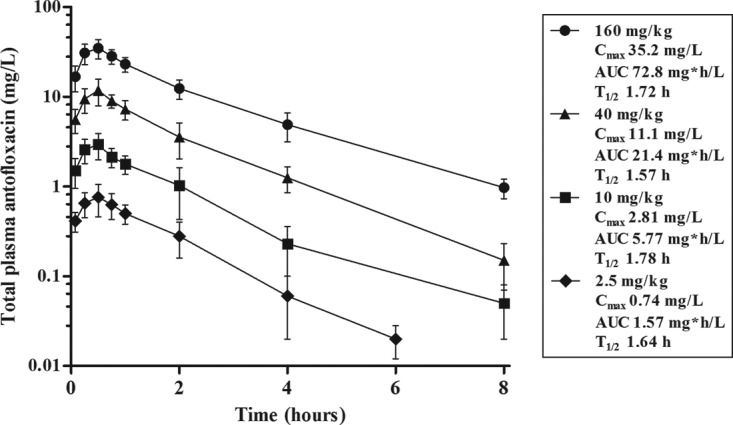
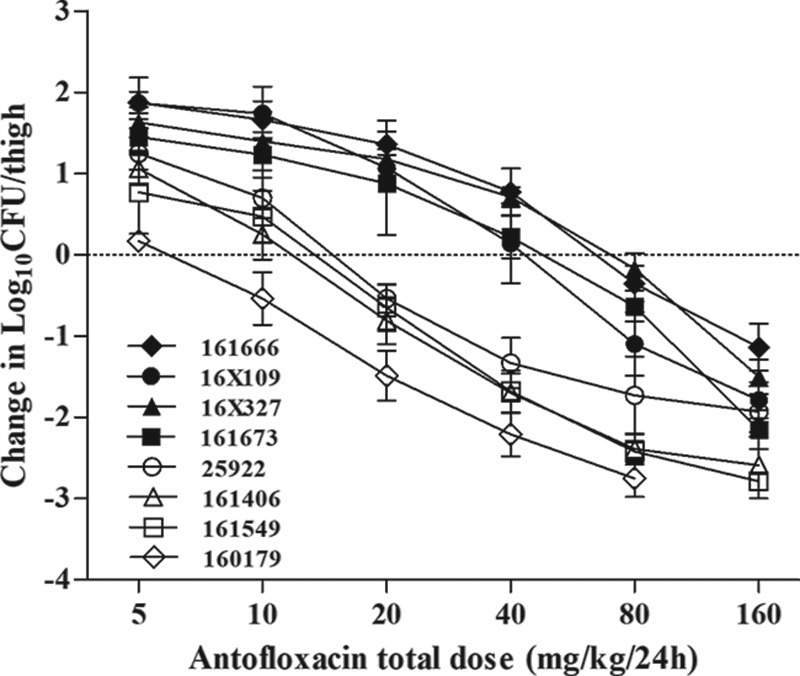
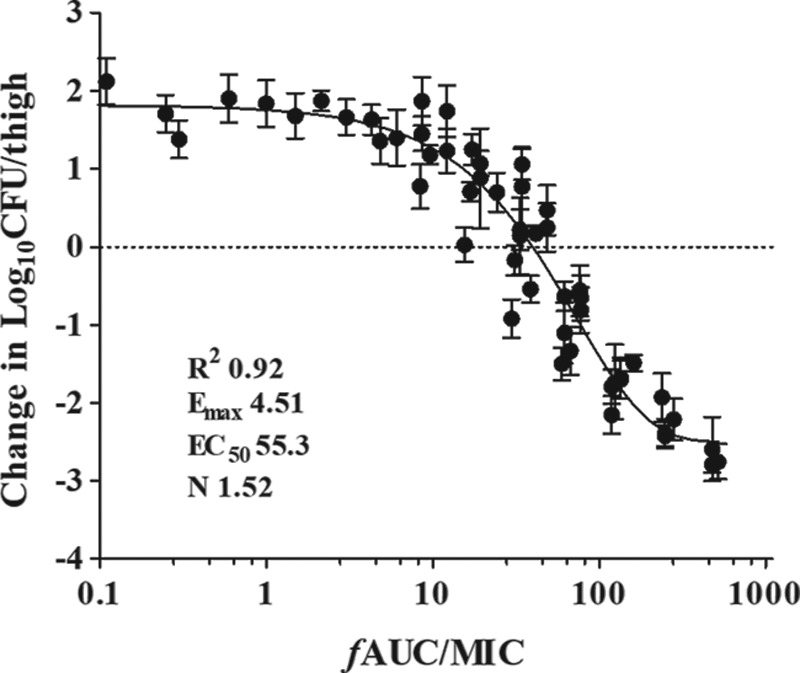
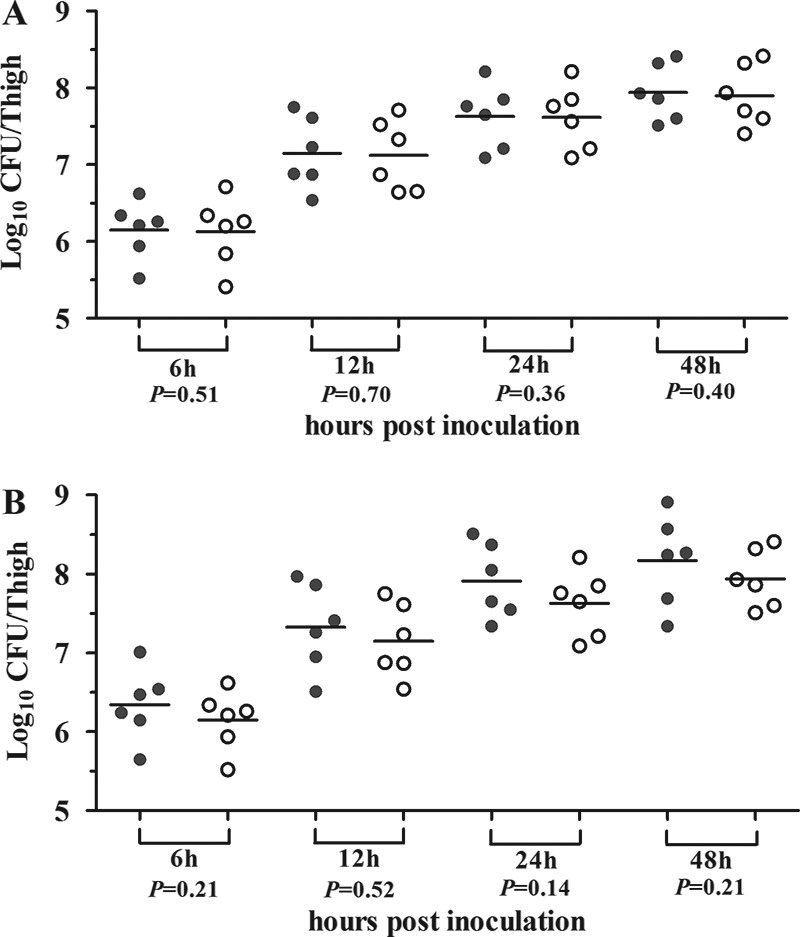
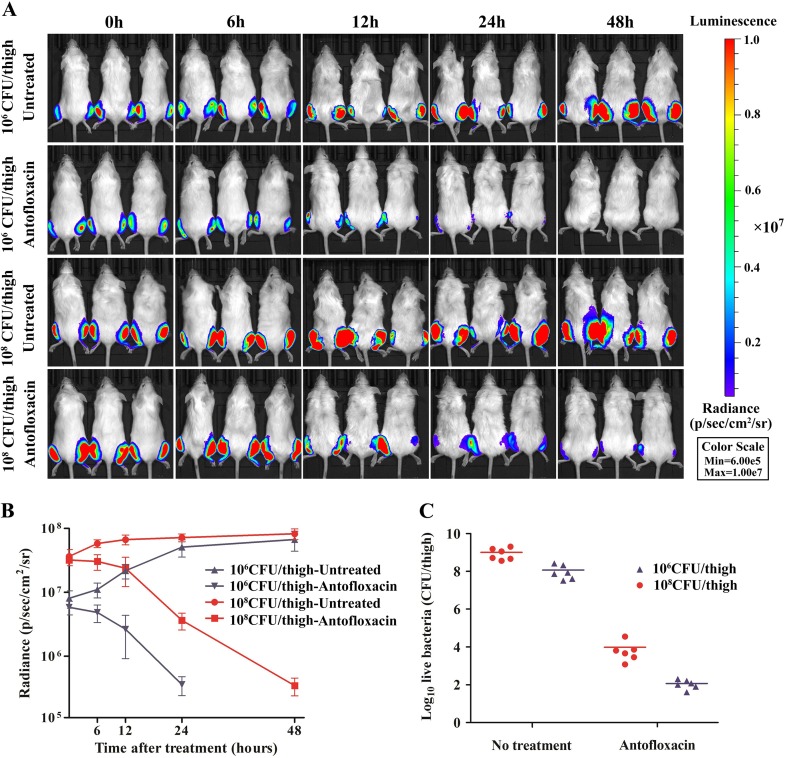
Antimicrobial resistance among uropathogens has increased the rates of infection-related morbidity and mortality. Antofloxacin is a novel fluoroquinolone with broad-spectrum antibacterial activity against urinary Gram-negative bacilli, such as Escherichia coli This study monitored the in vivo efficacy of antofloxacin using bioluminescent imaging and determined pharmacokinetic (PK)/pharmacodynamic (PD) targets against E. coli isolates in a neutropenic murine thigh infection model. The PK properties were determined after subcutaneous administration of antofloxacin at 2.5, 10, 40, and 160 mg/kg of body weight. Following thigh infection, the mice were treated with 2-fold-increasing doses of antofloxacin from 2.5 to 80 mg/kg administered every 12 h. Efficacy was assessed by quantitative determination of the bacterial burdens in thigh homogenates and was compared with the bioluminescent density. Antofloxacin demonstrated both static and killing endpoints in relation to the initial burden against all study strains. The PK/PD index area under the concentration-time curve (AUC)/MIC correlated well with efficacy (R2 = 0.92), and the dose-response relationship was relatively steep, as observed with escalating doses of antofloxacin. The mean free drug AUC/MIC targets necessary to produce net bacterial stasis and 1-log10 and 2-log10 kill for each isolate were 38.7, 66.1, and 147.0 h, respectively. In vivo bioluminescent imaging showed a rapid decrease in the bioluminescent density at free drug AUC/MIC exposures that exceeded the stasis targets. The integration of these PD targets combined with the results of PK studies with humans will be useful in setting optimal dosing regimens for the treatment of urinary tract infections due to E. coli.
Keywords: Escherichia coli; PK/PD; antofloxacin; bioluminescence; murine thigh infection.
Copyright © 2017 American Society for Microbiology.
Figures
Similar articles
-
Pharmacokinetics/pharmacodynamics of antofloxacin hydrochloride in a neutropenic murine thigh model of Staphylococcus aureus infection.Acta Pharmacol Sin. 2008 Oct;29(10):1253-60. doi: 10.1111/j.1745-7254.2008.00872.x. Acta Pharmacol Sin. 2008. PMID: 18817632
-
In Vivo Pharmacokinetic and Pharmacodynamic Profiles of Antofloxacin against Klebsiella pneumoniae in a Neutropenic Murine Lung Infection Model.Antimicrob Agents Chemother. 2017 Apr 24;61(5):e02691-16. doi: 10.1128/AAC.02691-16. Print 2017 May. Antimicrob Agents Chemother. 2017. PMID: 28264844 Free PMC article.
-
In Vivo Pharmacodynamic Target Investigation of Two Bacterial Topoisomerase Inhibitors, ACT-387042 and ACT-292706, in the Neutropenic Murine Thigh Model against Streptococcus pneumoniae and Staphylococcus aureus.Antimicrob Agents Chemother. 2016 May 23;60(6):3626-32. doi: 10.1128/AAC.00363-16. Print 2016 Jun. Antimicrob Agents Chemother. 2016. PMID: 27044547 Free PMC article.
-
Reappraisal of Contemporary Pharmacokinetic and Pharmacodynamic Principles for Informing Aminoglycoside Dosing.Pharmacotherapy. 2018 Dec;38(12):1229-1238. doi: 10.1002/phar.2193. Pharmacotherapy. 2018. PMID: 30403305 Review.
-
Pharmacokinetic and Pharmacodynamic Principles of Anti-infective Dosing.Clin Ther. 2016 Sep;38(9):1930-47. doi: 10.1016/j.clinthera.2016.06.015. Epub 2016 Jul 20. Clin Ther. 2016. PMID: 27449411 Free PMC article. Review.
Cited by
-
Concentration-Dependent Activity of Pazufloxacin against Pseudomonas aeruginosa: An In Vivo Pharmacokinetic/Pharmacodynamic Study.Antibiotics (Basel). 2022 Jul 21;11(7):982. doi: 10.3390/antibiotics11070982. Antibiotics (Basel). 2022. PMID: 35884236 Free PMC article.
-
Coix Seed Extract Enhances the Anti-Pancreatic Cancer Efficacy of Gemcitabine through Regulating ABCB1- and ABCG2-Mediated Drug Efflux: A Bioluminescent Pharmacokinetic and Pharmacodynamic Study.Int J Mol Sci. 2019 Oct 23;20(21):5250. doi: 10.3390/ijms20215250. Int J Mol Sci. 2019. PMID: 31652737 Free PMC article.
-
Factors affecting free vancomycin concentration and target attainment of free area under the concentration-time curve.J Pharm Health Care Sci. 2025 Feb 18;11(1):13. doi: 10.1186/s40780-025-00419-4. J Pharm Health Care Sci. 2025. PMID: 39966898 Free PMC article.
-
Antibiotic Resistance Patterns and Molecular Characterization of Streptococcus suis Isolates from Swine and Humans in China.Microbiol Spectr. 2023 Jun 15;11(3):e0030923. doi: 10.1128/spectrum.00309-23. Epub 2023 May 8. Microbiol Spectr. 2023. PMID: 37154736 Free PMC article.
-
Cinnamaldehyde targets SarA to enhance β-lactam antibiotic activity against methicillin-resistant Staphylococcus aureus.mLife. 2024 Jun 14;3(2):291-306. doi: 10.1002/mlf2.12121. eCollection 2024 Jun. mLife. 2024. PMID: 38948140 Free PMC article.
References
-
- Fihn SD. 2003. Clinical practice. Acute uncomplicated urinary tract infection in women. N Engl J Med 349:259–266. - PubMed
Publication types
MeSH terms
Substances
LinkOut - more resources
Full Text Sources
Other Literature Sources
Medical
Research Materials
