. 2017 Dec 8;292(49):20305-20312.
doi: 10.1074/jbc.M117.817387. Epub 2017 Oct 16.

The NSAID allosteric site of human cytosolic sulfotransferases

Affiliations

The NSAID allosteric site of human cytosolic sulfotransferases

Ting Wang et al. J Biol Chem. .

Abstract

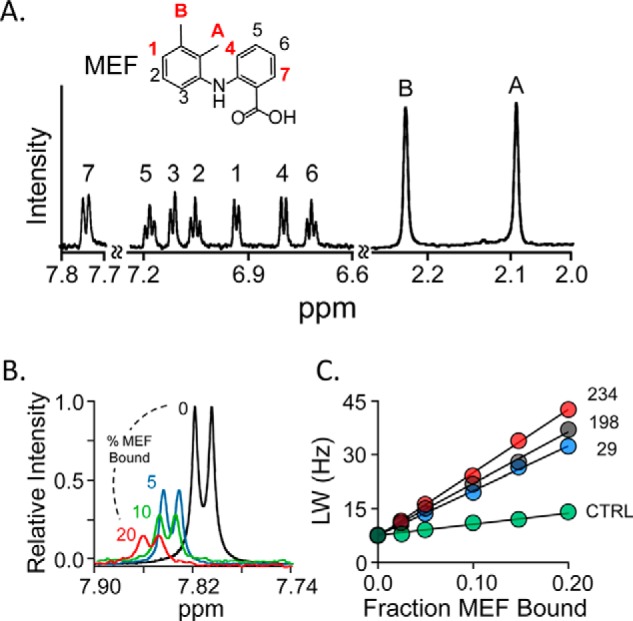
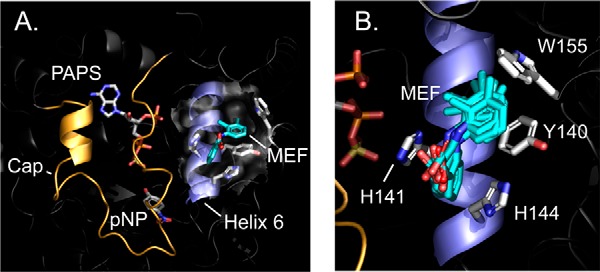
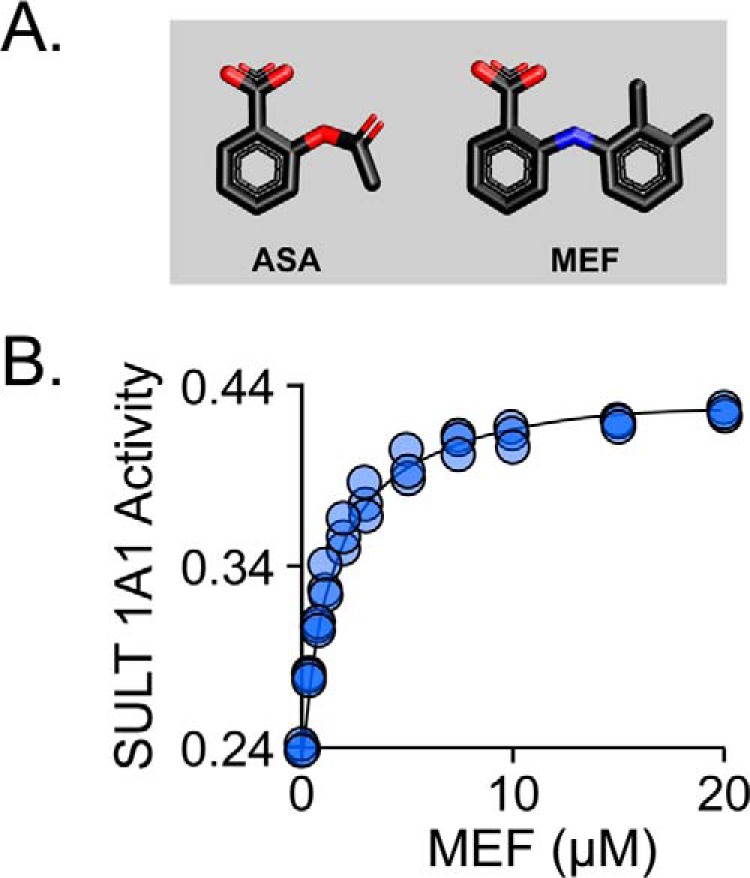
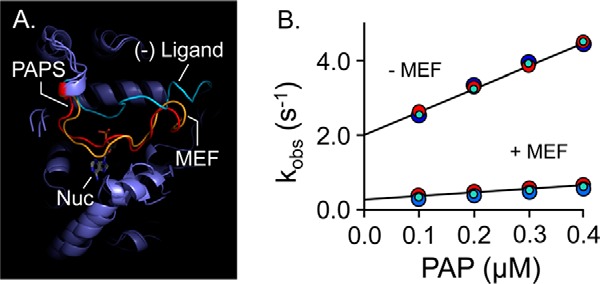
Non-steroidal anti-inflammatory drugs (NSAIDs) are among the most commonly prescribed drugs worldwide-more than 111 million prescriptions were written in the United States in 2014. NSAIDs allosterically inhibit cytosolic sulfotransferases (SULTs) with high specificity and therapeutically relevant affinities. This study focuses on the interactions of SULT1A1 and mefenamic acid (MEF)-a potent, highly specific NSAID inhibitor of 1A1. Here, the first structure of an NSAID allosteric site-the MEF-binding site of SULT1A1-is determined using spin-label triangulation NMR. The structure is confirmed by site-directed mutagenesis and provides a molecular framework for understanding NSAID binding and isoform specificity. The mechanism of NSAID inhibition is explored using molecular dynamics and equilibrium and pre-steady-state ligand-binding studies. MEF inhibits SULT1A1 turnover through an indirect (helix-mediated) stabilization of the closed form of the active-site cap of the enzyme, which traps the nucleotide and slows its release. Using the NSAID-binding site structure of SULT1A1 as a comparative model, it appears that 11 of the 13 human SULT isoforms harbor an NSAID-binding site. We hypothesize that these sites evolved to enable SULT isoforms to respond to metabolites that lie within their metabolic domains. Finally, the NSAID-binding site structure offers a template for developing isozyme-specific allosteric inhibitors that can be used to regulate specific areas of sulfuryl-transfer metabolism.

Keywords: NSAID; acetylsalicylic; allosteric regulation; kinetics; mefenamic; nuclear magnetic resonance (NMR); spin label; structural model; sulfotransferase.


Conflict of interest statement

The authors declare that they have no conflicts of interest with the contents of this article

Figures

Figure 1.
Figure 1.
NMR measurements. A, the structure and 600-MHz 1H NMR spectrum of MEF. MEF protons are labeled in the spectrum and structure. Red labels identify the proton positions used in NMR distance measurements. Conditions: MEF (100 μm), KPO4 (50 mm), pD 7.4, D2O (>98%), 25 ± 1 °C. B, spin-label effects on the H7-proton peak. The solution 1H NMR spectrum (600 MHz) of the MEF H7 peak is shown as a function of percent MEF bound to spin-labeled Cys-234-SULT1A1. Conditions: MEF (100 μm), spin-labeled Cys-234-SULT1A1 (0 μm (black), 20 μm (red), 10 μm (green), and 5 μm (blue)), PAP (500 μm, 17 × Kd), KPO4 (50 mm), pD 7.4, 25 ± 1 °C. The enzyme is saturated at all MEF concentrations (Kd MEF = 20 nm). Peak amplitudes are normalized to MEF concentration. C, line-width versus fraction-MEF-bound plot. The effects of paramagnetic spin labels (4-maleimido-PROXYL attached at Cys-234 (red), Cys-198 (black), or Cys-29 (blue) and diamagnetic control (N-cyclohexylmaleimide attached at Cys-234 (green)) on the line width of the H7-proton peak are plotted as a function of the fraction of enzyme-bound MEF. Each dot represents the average of two independent measurements. The straight line through the data represent the least-squares best-fit to the full (not averaged) dataset. Conditions are given in B of this legend.
Figure 2.
Figure 2.
SULT1A1·MEF·PAPS·pNP structure. A, the complex. MEF (teal) is shown docked into helix 6 (blue). The active-site cap (gold) is shown in its closed position over the nucleotide (PAPS) and acceptor (para-nitrophenol (pNP)). B, putative near-interactions. An ensemble of MD-predicted MEF structures is shown interacting with the four direct-contact residues. A and B structures are the result of proton/spin-label triangulation measurements followed by NMR distance–constrained MD-docking experiments (see “Results and discussion”).
Figure 3.
Figure 3.
Mutagenic confirmation of structure and the aspirin (ASA)-binding site. A, the structures of ASA and MEF. B, MEF and ASA bind competitively. Reaction progress was monitored via sulfonation-induced changes in 1-HP fluorescence (λex = 325 nm and λem = 370 nm). Rates were normalized to the rate in the absence of all inhibitors. Reaction conditions: SULT1A1 Y140L (25 nm, dimer), ASA (15.0 μm, 33 × Ki), MEF (concentration indicated), PAPS (0.50 mm, 17 × Km), 1-HP (2.0 μm, 100 × Km), MgCl2 (5.0 mm), KPO4 (50 mm), pH 7.5, 25 ± 2 °C. Less than 5% of the 1-HP converted at the reaction end point was consumed during the rate measurements. The line through the data points represents the behavior predicted by the constants compiled in Table 3.
Figure 4.
Figure 4.
Mechanism of MEF inhibition. A, simulated MEF-induced SULT1A1 cap closure. All-atom MD was performed with SULT1A1, SULT1A1·PAPS, and SULT1A1·MEF. The predicted structures are superposed, and the active-site caps of the structures are highlighted as follows: SULT1A1 (cyan); SULT1A1·PAPS (red); SULT1A1·MEF (gold). B, MEF affects nucleotide-binding rate constants. Binding-reaction progress curves were monitored using a stopped-flow fluorimeter (λex = 290 nm and λem ≥ 330 nm (cutoff filter)). Reactions were initiated by mixing (1:1 v/v) a solution containing SULT1A1 (50 nm, dimer), MEF (0, or 1.0 μm (37 × Kd)), MgCl2 (5.0 mm), KPO4 (50 mm), pH 7.5, 25 ± 2 °C, with a solution that was identical except that it lacked SULT1A1 and contained PAP at twice the indicated concentrations. kobs values were obtained by fitting five averaged progress curves using Pro-K analysis software. Each kobs value is the average of three independent determinations. kon and koff were obtained from the slopes and intercepts predicted by linear least-squares analysis and are compiled in Table 5.

Similar articles

Cited by

References

    1. Campbell C. L., Smyth S., Montalescot G., and Steinhubl S. R. (2007) Aspirin dose for the prevention of cardiovascular disease: a systematic review. JAMA 297, 2018–2024 - PubMed
    1. Strauch K. A. (2011) Invisible pollution: the impact of pharmaceuticals in the water supply. AAOHN J. 59, 525–532 - PubMed
    1. Fuster V., and Sweeny J. M. (2011) Aspirin: a historical and contemporary therapeutic overview. Circulation 123, 768–778 - PubMed
    1. Mitchell J. A., and Warner T. D. (2006) COX isoforms in the cardiovascular system: understanding the activities of non-steroidal anti-inflammatory drugs. Nat. Rev. Drug Discov. 5, 75–86 - PubMed
    1. Mora S., and Manson J. E. (2016) Aspirin for primary prevention of atherosclerotic cardiovascular disease: advances in diagnosis and treatment. JAMA Intern. Med. 176, 1195–1204 - PubMed

Publication types

MeSH terms

Associated data