

Dynamic stroma reorganization drives blood vessel dysmorphia during glioma growth
- PMID: 29038312
- PMCID: PMC5709745
- DOI: 10.15252/emmm.201607445
Dynamic stroma reorganization drives blood vessel dysmorphia during glioma growth
Abstract
Glioma growth and progression are characterized by abundant development of blood vessels that are highly aberrant and poorly functional, with detrimental consequences for drug delivery efficacy. The mechanisms driving this vessel dysmorphia during tumor progression are poorly understood. Using longitudinal intravital imaging in a mouse glioma model, we identify that dynamic sprouting and functional morphogenesis of a highly branched vessel network characterize the initial tumor growth, dramatically changing to vessel expansion, leakage, and loss of branching complexity in the later stages. This vascular phenotype transition was accompanied by recruitment of predominantly pro-inflammatory M1-like macrophages in the early stages, followed by in situ repolarization to M2-like macrophages, which produced VEGF-A and relocate to perivascular areas. A similar enrichment and perivascular accumulation of M2 versus M1 macrophages correlated with vessel dilation and malignancy in human glioma samples of different WHO malignancy grade. Targeting macrophages using anti-CSF1 treatment restored normal blood vessel patterning and function. Combination treatment with chemotherapy showed survival benefit, suggesting that targeting macrophages as the key driver of blood vessel dysmorphia in glioma progression presents opportunities to improve efficacy of chemotherapeutic agents. We propose that vessel dysfunction is not simply a general feature of tumor vessel formation, but rather an emergent property resulting from a dynamic and functional reorganization of the tumor stroma and its angiogenic influences.
Keywords: VEGF; glioma; live imaging; myeloid cells; vessel dysmorphia.
© 2017 The Authors. Published under the terms of the CC BY 4.0 license.
Figures
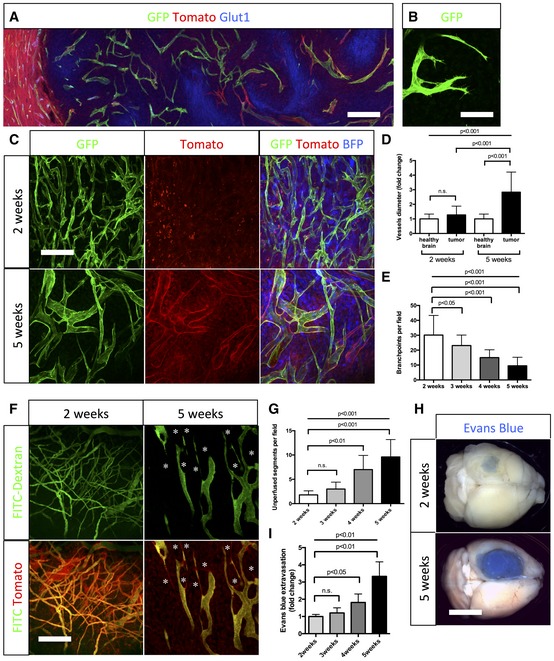
Glucose transporter1 (Glut1) immunohistochemistry on sections of 5‐week growth glioma in ROSAmT/mG ::Pdgfb‐iCre mouse (50‐μm depth stack). Hypoxic tumor cells upregulate Glut1.
Still image of two‐photon live imaging on 2‐week growth glioma implanted in ROSAmT/mG ::Pdgfb‐iCre mouse demonstrating tip cell filopodia extension indicative of sprouting. See Movie EV1.
Representative images of two‐photon live imaging of the same glioma area of the same mouse on 2‐ and 5‐week growth glioma (BFP positive) implanted in ROSAmT/mG ::Pdgfb‐iCre mouse (350‐μm depth stack). Note differences in network complexity and vessel diameter.
Blood vessel diameter quantification: sprouting blood vessels at 2‐week growth present caliber comparable to vessels in the healthy brain (hb). At 5‐week growth, tortuous blood vessels in the tumor are significantly more dilated than in the healthy brain (n = 8 mice).
Branchpoint quantification during glioma growth (n = 8 mice).
Two‐photon live imaging of vessel perfusion using FITC‐dextran IV injection in ROSAmT/mG mice (asterisks correspond to unperfused vessel segment) (300‐μm depth stack).
Quantification of unperfused vessel segments (asterisks in F) shows increase during glioma growth (n = 5 mice).
Tumor‐bearing brain overview images after Miles assay.
Late‐stage glioma growth vessels are leaky compared to early tumor growth (n = 5 mice per group).
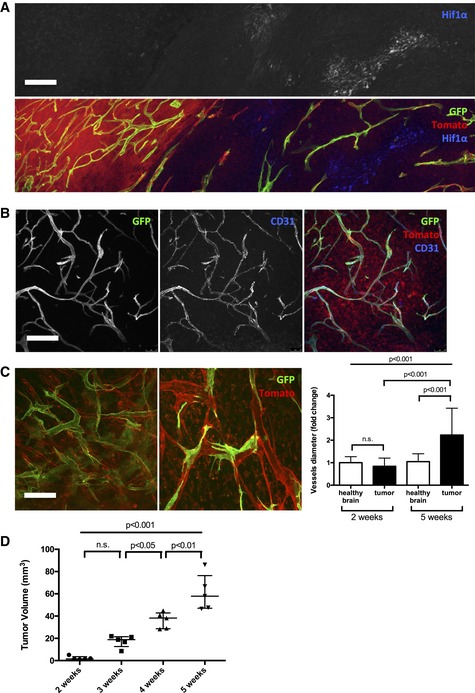
HIF1α immunohistochemistry on 5‐week growth glioma in ROSAmTmG ::Pdgfb‐iCre mouse (50‐μm depth stack).
CD31 immunohistochemistry on 5‐week growth glioma in ROSAmTmG ::Pdgfb‐iCre mouse revealing the endothelial cell specificity of the Pdgfb‐iCre induced recombination (50‐μm depth stack).
Representative images of two‐photon live imaging on 2‐ and 5‐week growth glioma implanted in ROSAmT/mG ::Cdh5‐iCre mouse (350‐μm depth stack). Note differences in network complexity and the quantified vessel diameter increase (n = 6 mice per group).
Tumor volume quantification during glioma growth (n = 5 mice per group).
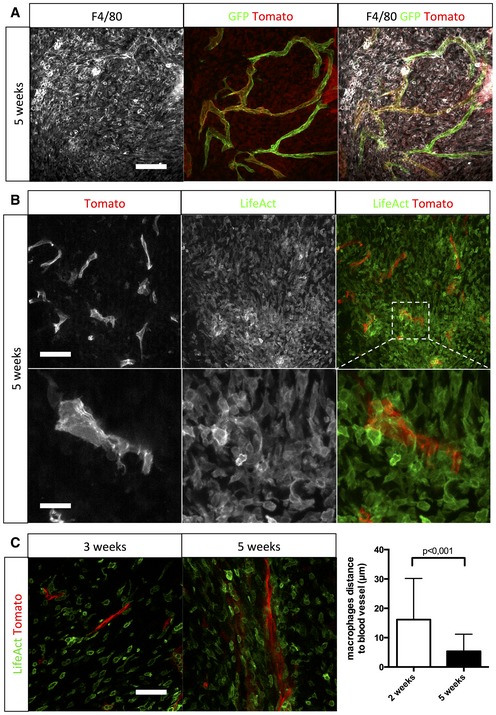
F4/80 immunohistochemistry on a section of 5‐week growth glioma implanted in ROSAmT/mG ::Pdgfb‐iCre mouse (50‐μm depth stack).
Two‐photon live imaging of LifeAct‐GFP bone marrow transplantation in 5‐week implanted glioma in ROSAmT/mG mice (100‐μm depth stack).
Two‐photon live imaging of LifeAct‐GFP bone marrow transplantation in 3‐ and 5‐week implanted glioma in ROSAmT/mG. Macrophages relocate close to blood vessels during glioma growth (50‐μm depth stack; n = 4 mice).
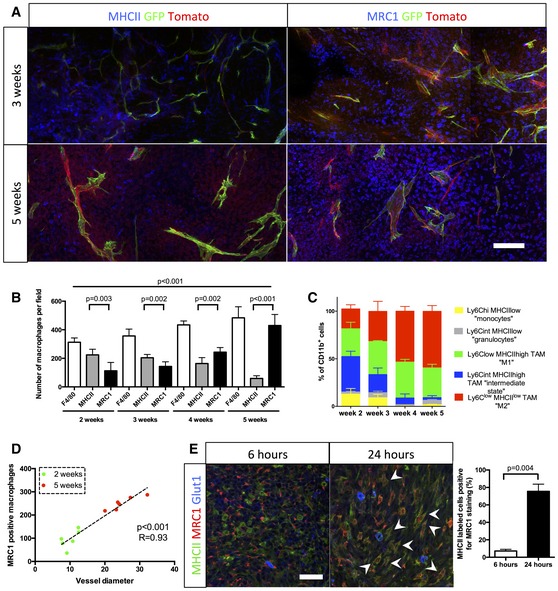
MHCII and MRC1 immunohistochemistry on a section of 3‐ to 5‐week growth glioma implanted in ROSAmT/mG ::Pdgfb‐iCre mouse. M1 macrophages, preferentially located in hypoxic area, are abundant at 3 weeks and their number decreases at 5 weeks. M2 macrophages, preferentially located around blood vessels, are present at a low level at 3 weeks and their number increases at 5 weeks.
Macrophage quantification during glioma growth (n = 5 mice per group).
MHCII and MRC1 macrophage population FACs analysis in 2‐, 3‐, 4‐, and 5‐week glioma (subsets in gated CD11b+ cells; n = 3 mice per group).
Correlation analysis of M2‐like macrophages accumulation (MRC1 positive) with vessel dysmorphia over glioma growth (n = 12 mice).
MRC1 immunohistochemistry on 3‐week growth glioma in ROSAmTmG ::Pdgfb‐iCre mouse following MHCII‐FITC labeled IV injection at 6 or 24 h (5‐μm depth stack). Note the segregation of MRC1 and MHCII cell labeling at 6 h and the overlapping (examples pointed with arrow heads) of these two markers at 24 h (n = 5 mice per group).
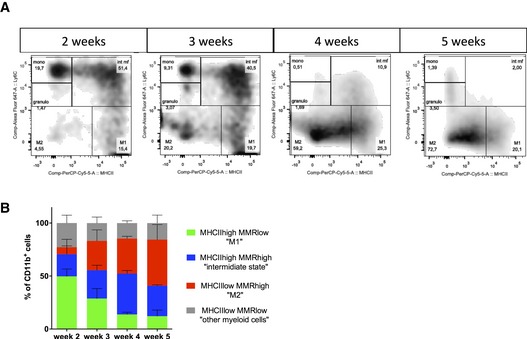
Identification of distinct myeloid subsets in single‐cell suspensions of 2‐, 3‐, 4‐, and 5‐week glioma (subsets in gated CD11b+ cells).
Flow cytometry analysis confirming a switch in macrophages polarization over glioma growth (n = 3 mice per group). Error bars: mean ± SD.
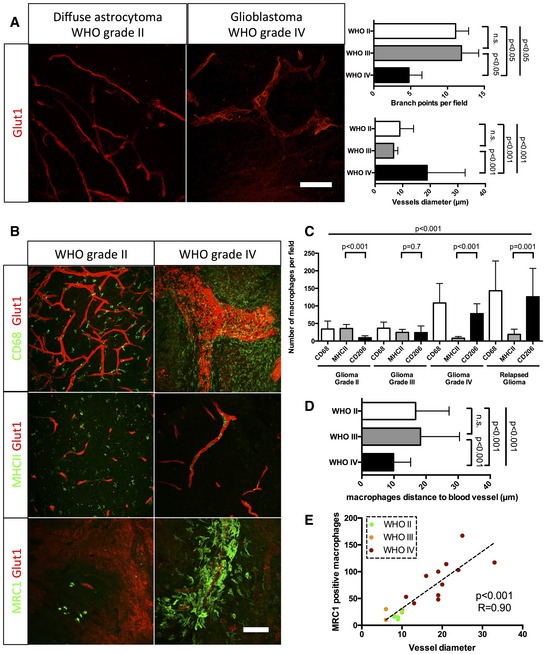
Glut1 immunohistochemistry on human grade II and grade IV glioma samples (50‐μm depth stack). Blood vessel diameter increases and network complexity decreases with increasing grade.
CD68, MHCII, and MRC1 immunohistochemistry on human grade II and grade IV glioma samples (50‐μm depth stack).
Macrophage polarization quantification. Low‐grade glioma is characterized by high number of M1 polarized macrophages. High‐grade glioma is characterized by high number of M2 polarized macrophages.
Correlation analysis of M2‐like macrophages accumulation (MRC1 positive) with vessel dysmorphia depending on the tumor grade.
Quantification of macrophage distance to the nearest blood vessel. Macrophages relocate close to blood vessels in late‐stage gliomas. For number of patients per group, refer to Table EV1.
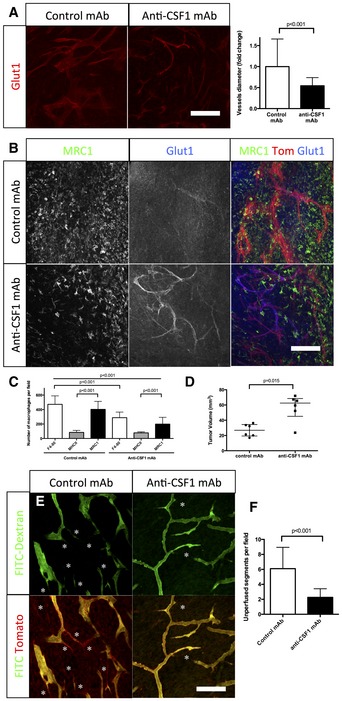
Glut1 immunohistochemistry on sections of 4‐week growth glioma in ROSAmT/mG mice treated with anti‐CSF1 or control antibodies. Anti‐CSF1 antibody treatment induces a twofold decrease in vessel caliber compared to control antibody (n = 6 mice per group) (50‐μm depth stack).
Glut1 and MRC1 immunohistochemistry on 4‐week growth glioma in ROSAmT/mG mice treated with anti‐CSF1 or control antibodies. Anti‐CSF1 antibody induces a decrease in macrophage recruitment in the tumor microenvironment associated with an improved blood brain barrier functionality assessed by a better Glut1 blood vessel coverage compared to control antibody‐treated mice (50‐μm depth stack).
Macrophage quantification in response to anti‐CSF1 or control antibody treatment (n = 6 mice per group).
Tumor volume quantification in response to anti‐CSF1 or control antibodies (n = 6 mice per group).
Two‐photon live imaging of vessel perfusion in 4‐week implanted glioma growth using FITC‐dextran IV injection in ROSAmT/mG mice treated with anti‐CSF1 or control antibodies (asterisks correspond to unperfused vessel segments).
Quantification of unperfused vessel segments. Anti‐CSF1 antibody treatment induces a reduction in the number of unperfused vessel segments (asterisks in E). (n = 5 mice per group) (300‐μm depth stack).
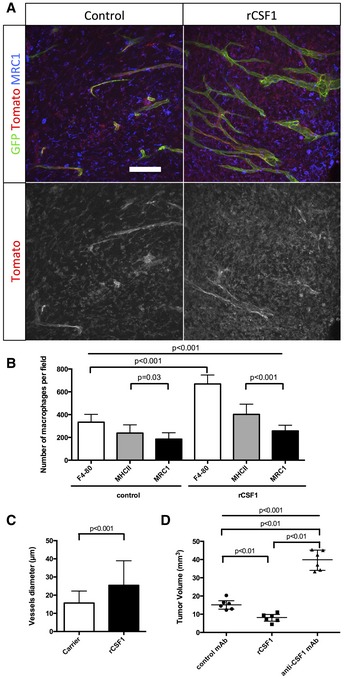
MRC1 immunohistochemistry on sections of 3‐week growth glioma in ROSAmT/mG mice treated with recombinant CSF1 or carrier. Recombinant CSF1 treatment induces blood vessel enlargement in early tumors (50‐μm depth stack).
Quantification of Tomato‐positive macrophages. Recombinant CSF1 treatment induces increased macrophage recruitment compared to control (n = 6 mice per group).
Vessel diameter quantification. Recombinant CSF1 treatment drives blood vessel diameter increase compared to control (n = 6 mice per group).
Tumor volume quantification in 3‐week glioma implanted mice treated with recombinant CSF1, anti‐CSF1 antibody, or control antibody. Recombinant CSF1 treatment reduces tumor growth compared to control (n = 6 mice per group).
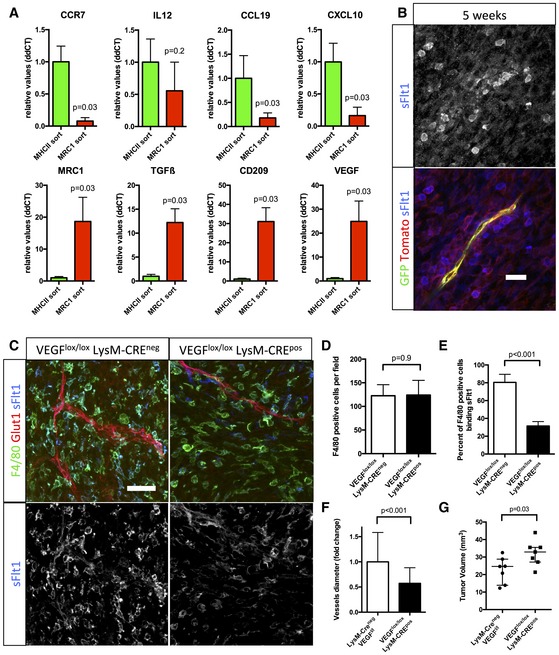
qPCR analysis of CCR7, IL12, CCL19, CXCL10, MRC1, TGFβ, CD209, and VEGF on RNA samples from MHCII or MRC1 tumor extracted macrophages (n = 5 isolation per group).
sFlt1 binding assay on 5‐week growth glioma section implanted in ROSAmT/mG ::Pdgfb‐iCre mouse. At late‐stage tumor growth, M2 macrophages surrounding blood vessels present very high amount of VEGF (binding sFlt1) to the neighboring endothelial cells (5‐μm depth stack).
F4/80 immunohistochemistry and sFlt1 binding on sections of 4‐week growth glioma in Vegfa fl/fl::LysMCre + or Vegfa fl/fl :: LysMCre − mice (50‐μm depth stack).
Quantification of F4/80‐positive macrophages. VEGF depletionin myeloid cells does not alter macrophages recruitment (n = 7 mice per group).
Quantification of F4/80‐positive macrophages binding sFlt1. VEGF depletion is effective in 61% of the macrophages invading the tumor (n = 7 mice per group).
Vessel diameter quantification. Myeloid cell‐derived VEGF depletion induces blood vessel “normalization” compared to control (n = 7 mice per group).
Tumor volume quantification in 4‐week growth glioma in Vegfa fl/fl ::LysMCre + or Vegfa fl/fl ::LysMCre − mice (n = 7 mice per group).
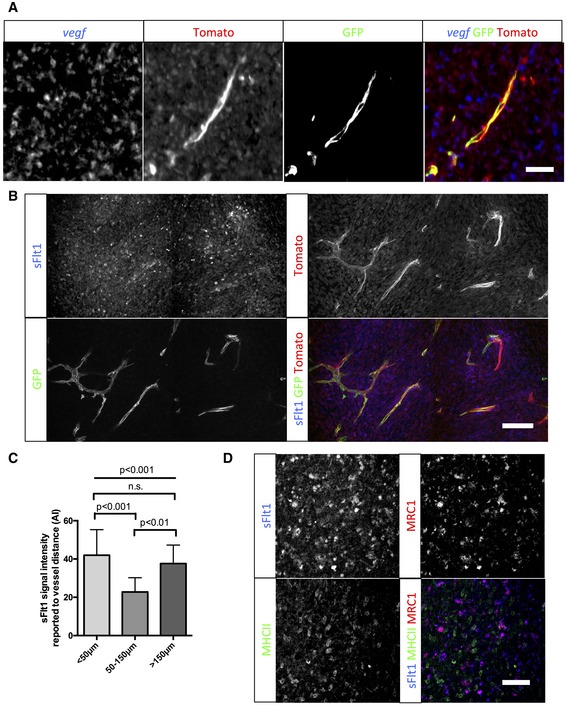
vegf in situ hybridization on sections of 5‐week growth glioma in ROSAmTmG ::Pdgfb‐iCre mouse. Tomato‐positive macrophages surrounding blood vessels are positive for the vegf‐specific RNA probe (5‐μm depth stack).
sFlt1 binding assay on section of 5‐week growth glioma in ROSAmTmG ::Pdgfb‐iCre mouse. At late‐stage tumor growth, M2 macrophages surrounding blood vessels present very high amounts of VEGF (binding sFlt1) to the neighboring endothelial cells (50‐μm depth stack).
Quantification of sFlt1 binding accordingly to vessel distance (n = 5 mice).
sFlt1 binding assay together with MHCII and MRC1 immunohistochemistry on section of 3‐week growth glioma in wild‐type mice. sFlt1 binds to MRC1‐positive macrophages, but not MHCII‐positive macrophages (n = 5 mice per group).
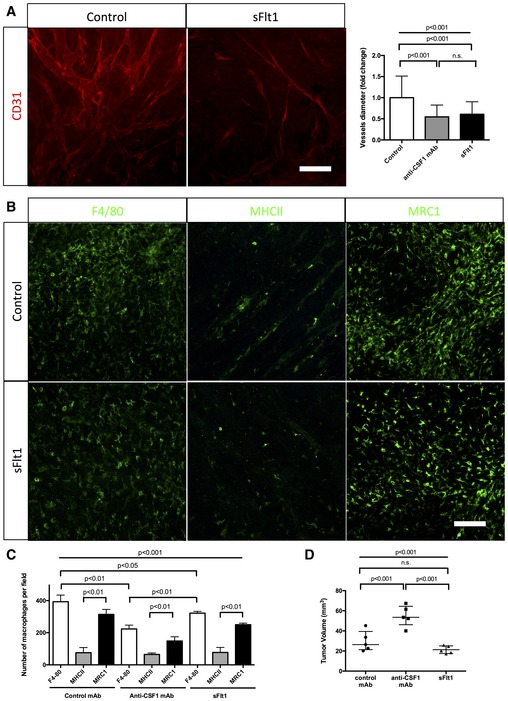
CD31 immunohistochemistry on sections of 4‐week growth glioma from mice treated with sFlt1. As for anti‐CSF1 antibody treatment, sFlt1 treatment induces a twofold decrease in vessel caliber compared to control antibody (n = 5 mice per group) (50‐μm depth stack). Blood vessels significantly dilate over tumor growth.
F4/80, MHCII, and MRC1 immunohistochemistry on early‐ and late‐stage growth melanoma sections implanted in wild‐type bl6 mouse. M1 macrophages are as abundant as M2 macrophages at early stage and their number decreases at late stage. M2 macrophages accumulate over tumor progression
Macrophages quantification in response to sFlt1 and anti‐CSF1 mAb treatments. anti‐CSF1 mAb and sFlt1 treatments decrease macrophages population in melanoma tumor model, but do not seem to affect macrophages polarity (n = 5 mice per group).
Tumor volume analysis in response to sFlt1 and anti‐CSF1 mAb treatments (n = 5 mice per group).
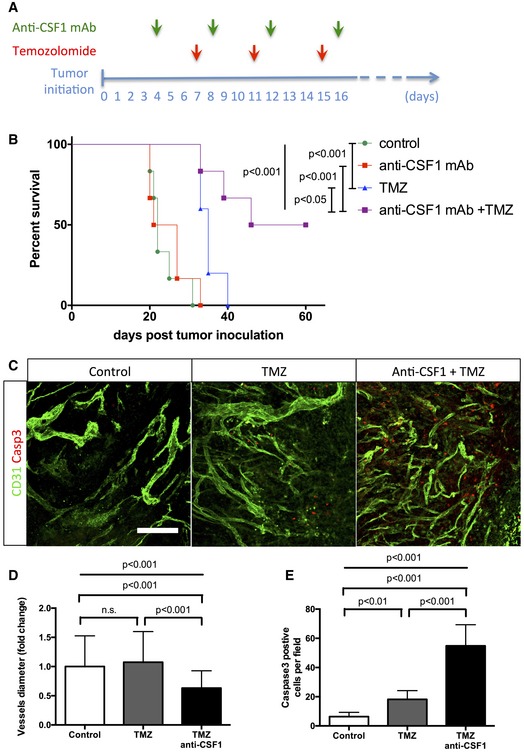
Experimental design for the survival trial: 8‐week‐old wild‐type mice were injected with GL261 cells to induce glioma formation and were assigned randomly to vehicle (n = 6), anti‐CSF1 monoclonal antibody treatment (0.5 mg; n = 6), temozolomide treatment (40 mg/kg; n = 6), or temozolomide and anti‐CSF1 mAb combination treatment (n = 6). Mice were weighed once daily until they developed symptoms or reached the trial endpoint.
Survival curves of the mice described in (A). Combination therapy is significantly more efficient than chemotherapy alone. (n = 6 mice per group).
phospho‐H2AX and Glut1 immunohistochemistry on 3‐week growth glioma in wild‐type mice treated as described in (A).
Anti‐CSF1 antibody in combination with temozolomide chemotherapeutic agent induces a wider tumor cell death efficiency with a significant decrease of blood vessel caliber (D) and an increase in caspase3‐positive tumor cells (E) (50‐μm depth stack) (n = 6 mice per group).
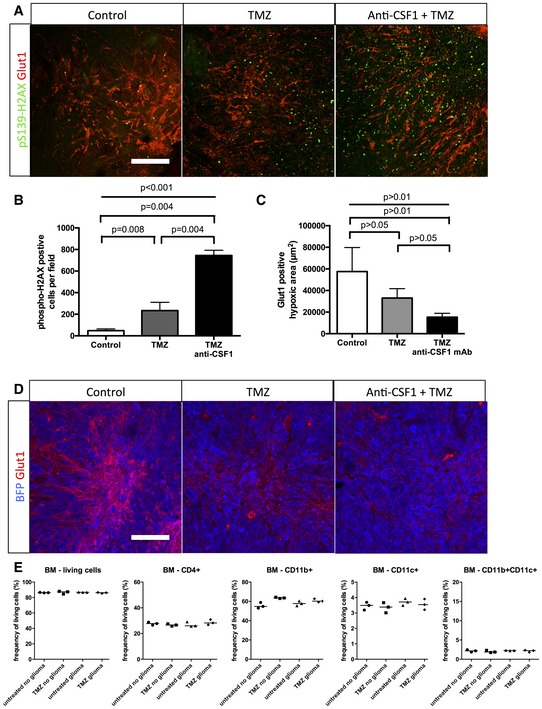
- A,B
Phospho‐H2AX and Glut1 immunohistochemistry on 3‐week growth glioma in wild‐type mice treated with anti‐CSF1 antibody in combination with temozolomide chemotherapeutic agent induces a higher tumor cell death efficiency with (B) a significant increase in DNA damage‐positive tumor cell labeled with anti‐phospho‐H2AX (50‐μm depth stack) (n = 6 mice per group).
- C
Quantification of (D). (n = 6 mice per group).
- D
Glut1 immunohistochemistry on 3‐week growth glioma in wild‐type mice treated with anti‐CSF1 antibody in combination with temozolomide chemotherapeutic agent showing a significant decrease in hypoxic area in response to temozolomide which is potentiated by anti‐CSF1 Ab treatment
- E
Immune cells population FACs analysis in bone marrow from glioma‐bearing mice treated or not with temozolomide (n = 3 mice per group).
Comment in
-
Fighting vessel dysmorphia to improve glioma chemotherapy.EMBO Mol Med. 2017 Dec;9(12):1626-1628. doi: 10.15252/emmm.201708431. EMBO Mol Med. 2017. PMID: 29127101 Free PMC article.
References
-
- Auffray C, Sieweke MH, Geissmann F (2009) Blood monocytes: development, heterogeneity, and relationship with dendritic cells. Annu Rev Immunol 27: 669–692 - PubMed
-
- Baluk P, Hashizume H, McDonald DM (2005) Cellular abnormalities of blood vessels as targets in cancer. Curr Opin Genet Dev 15: 102–111 - PubMed
-
- Barve RA, Zack MD, Weiss D, Song RH, Beidler D, Head RD (2013) Transcriptional profiling and pathway analysis of CSF‐1 and IL‐34 effects on human monocyte differentiation. Cytokine 63: 10–17 - PubMed
-
- Bentley K, Gerhardt H, Bates PA (2008) Agent‐based simulation of notch‐mediated tip cell selection in angiogenic sprout initialisation. J Theor Biol 250: 25–36 - PubMed
MeSH terms
Substances
Grants and funding
LinkOut - more resources
Full Text Sources
Other Literature Sources
Medical
Molecular Biology Databases
Research Materials
Miscellaneous
