Male apoE*3-Leiden.CETP mice on high-fat high-cholesterol diet exhibit a biphasic dyslipidemic response, mimicking the changes in plasma lipids observed through life in men
- PMID: 29038350
- PMCID: PMC5641925
- DOI: 10.14814/phy2.13376
Male apoE*3-Leiden.CETP mice on high-fat high-cholesterol diet exhibit a biphasic dyslipidemic response, mimicking the changes in plasma lipids observed through life in men
Erratum in
-
Male apoE*3-Leiden.CETP mice on high-fat high-cholesterol diet exhibit a biphasic dyslipidemic response, mimicking the changes in plasma lipids observed through life in men.Physiol Rep. 2018 Mar;6(6):e13608. doi: 10.14814/phy2.13608. Physiol Rep. 2018. PMID: 29595880 Free PMC article. No abstract available.
Abstract
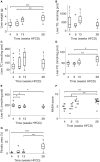
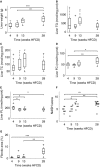
Physiological adaptations resulting in the development of the metabolic syndrome in man occur over a time span of several decades. This combined with the prohibitive financial cost and ethical concerns to measure key metabolic parameters repeatedly in subjects for the major part of their life span makes that comprehensive longitudinal human data sets are virtually nonexistent. While experimental mice are often used, little is known whether this species is in fact an adequate model to better understand the mechanisms that drive the metabolic syndrome in man. We took up the challenge to study the response of male apoE*3-Leiden.CETP mice (with a humanized lipid profile) to a high-fat high-cholesterol diet for 6 months. Study parameters include body weight, food intake, plasma and liver lipids, hepatic transcriptome, VLDL - triglyceride production and importantly the use of stable isotopes to measure hepatic de novo lipogenesis, gluconeogenesis, and biliary/fecal sterol secretion to assess metabolic fluxes. The key observations include (1) high inter-individual variation; (2) a largely unaffected hepatic transcriptome at 2, 3, and 6 months; (3) a biphasic response curve of the main metabolic features over time; and (4) maximum insulin resistance preceding dyslipidemia. The biphasic response in plasma triglyceride and total cholesterol appears to mimic that of men in cross-sectional studies. Combined, these observations suggest that studies such as these can help to delineate the causes of metabolic derangements in patients suffering from metabolic syndrome.
Keywords: Biphasic; dyslipidemia; insulin resistance; metabolic syndrome.
© 2017 The Authors. Physiological Reports published by Wiley Periodicals, Inc. on behalf of The Physiological Society and the American Physiological Society.
Figures


Similar articles
-
A Systems Analysis of Phenotype Heterogeneity in APOE*3Leiden.CETP Mice Induced by Long-Term High-Fat High-Cholesterol Diet Feeding.Nutrients. 2022 Nov 21;14(22):4936. doi: 10.3390/nu14224936. Nutrients. 2022. PMID: 36432620 Free PMC article.
-
GLP-1 receptor activation inhibits VLDL production and reverses hepatic steatosis by decreasing hepatic lipogenesis in high-fat-fed APOE*3-Leiden mice.PLoS One. 2012;7(11):e49152. doi: 10.1371/journal.pone.0049152. Epub 2012 Nov 2. PLoS One. 2012. PMID: 23133675 Free PMC article.
-
Combined GIP receptor and GLP1 receptor agonism attenuates NAFLD in male APOE∗3-Leiden.CETP mice.EBioMedicine. 2023 Jul;93:104684. doi: 10.1016/j.ebiom.2023.104684. Epub 2023 Jun 26. EBioMedicine. 2023. PMID: 37379656 Free PMC article.
-
Rosuvastatin reduces plasma lipids by inhibiting VLDL production and enhancing hepatobiliary lipid excretion in ApoE*3-leiden mice.J Cardiovasc Pharmacol. 2005 Jan;45(1):53-60. doi: 10.1097/00005344-200501000-00010. J Cardiovasc Pharmacol. 2005. PMID: 15613980
-
Lipid and lipoprotein dysregulation in insulin resistant states.Clin Chim Acta. 2006 Jun;368(1-2):1-19. doi: 10.1016/j.cca.2005.12.026. Epub 2006 Feb 9. Clin Chim Acta. 2006. PMID: 16480697 Review.
Cited by
-
Atherosclerosis: an overview of mouse models and a detailed methodology to quantify lesions in the aortic root.Vasc Biol. 2024 Apr 4;6(1):e230017. doi: 10.1530/VB-23-0017. Print 2024 Jan 1. Vasc Biol. 2024. PMID: 38428154 Free PMC article. Review.
-
Modelling of atherosclerosis in genetically modified animals.Am J Transl Res. 2019 Aug 15;11(8):4614-4633. eCollection 2019. Am J Transl Res. 2019. PMID: 31497187 Free PMC article. Review.
-
Spontaneous liver disease in wild-type C57BL/6JOlaHsd mice fed semisynthetic diet.PLoS One. 2020 Sep 21;15(9):e0232069. doi: 10.1371/journal.pone.0232069. eCollection 2020. PLoS One. 2020. PMID: 32956351 Free PMC article.
-
Translating atherosclerosis research from bench to bedside: navigating the barriers for effective preclinical drug discovery.Clin Sci (Lond). 2022 Dec 9;136(23):1731-1758. doi: 10.1042/CS20210862. Clin Sci (Lond). 2022. PMID: 36459456 Free PMC article.
-
A hierarchical dynamic model used for investigating feed efficiency and its relationship with hepatic gene expression in APOE*3-Leiden.CETP mice.Physiol Rep. 2021 Apr;9(8):e14832. doi: 10.14814/phy2.14832. Physiol Rep. 2021. PMID: 33932122 Free PMC article.
References
-
- Adiels, M. , Olofsson S.‐O., Taskinen M.‐R., and Borén J.. 2008. Overproduction of very low‐density lipoproteins is the hallmark of the dyslipidemia in the metabolic syndrome. Arterioscler. Thromb. Vasc. Biol. 28:1225–1236. - PubMed
-
- Allain, C. , and Poon L.. 1974. Enzymatic determination of total serum cholesterol. Clin. Chem. 20:470–475. - PubMed
-
- Baranowski, M. 2008. Biological role of liver X receptors. J. Physiol. Pharmacol. 59:31–55. - PubMed
-
- Barnard, R. J. , Roberts C. K., Varon S. M., and Berger J. J.. 1998. Diet‐induced insulin resistance precedes other aspects of the metabolic syndrome. J. Appl. Physiol. 84:1311–1315. - PubMed
MeSH terms
Substances
LinkOut - more resources
Full Text Sources
Other Literature Sources
Molecular Biology Databases
Miscellaneous

