. 2017 Dec 4;214(12):3577-3596.
doi: 10.1084/jem.20170041. Epub 2017 Oct 16.

Specifically differentiated T cell subset promotes tumor immunity over fatal immunity

Affiliations

Specifically differentiated T cell subset promotes tumor immunity over fatal immunity

Abdulraouf Ramadan et al. J Exp Med. .

Abstract

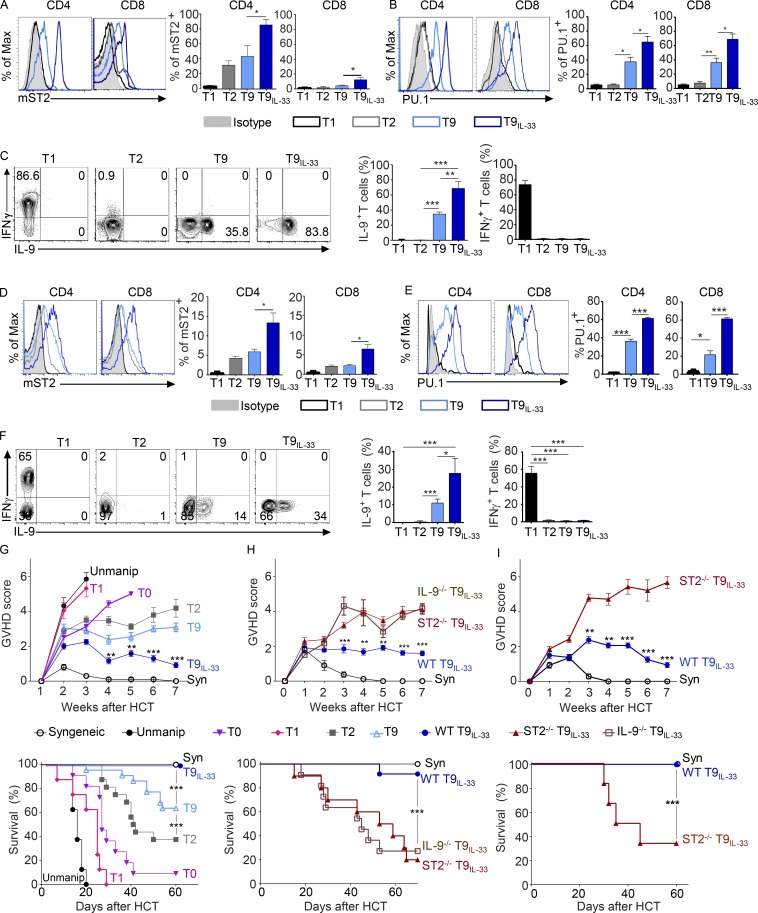
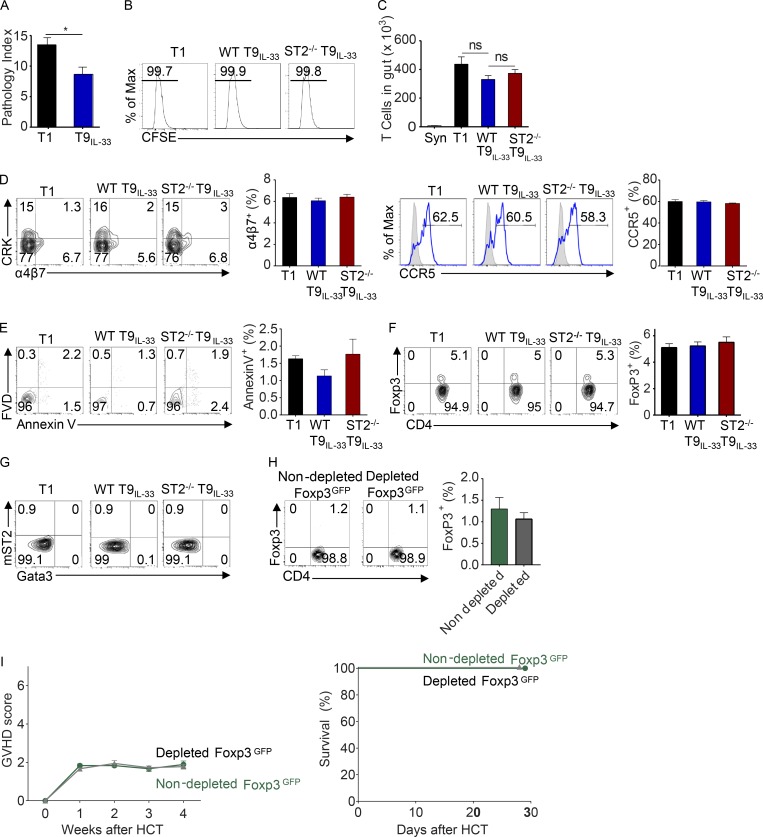
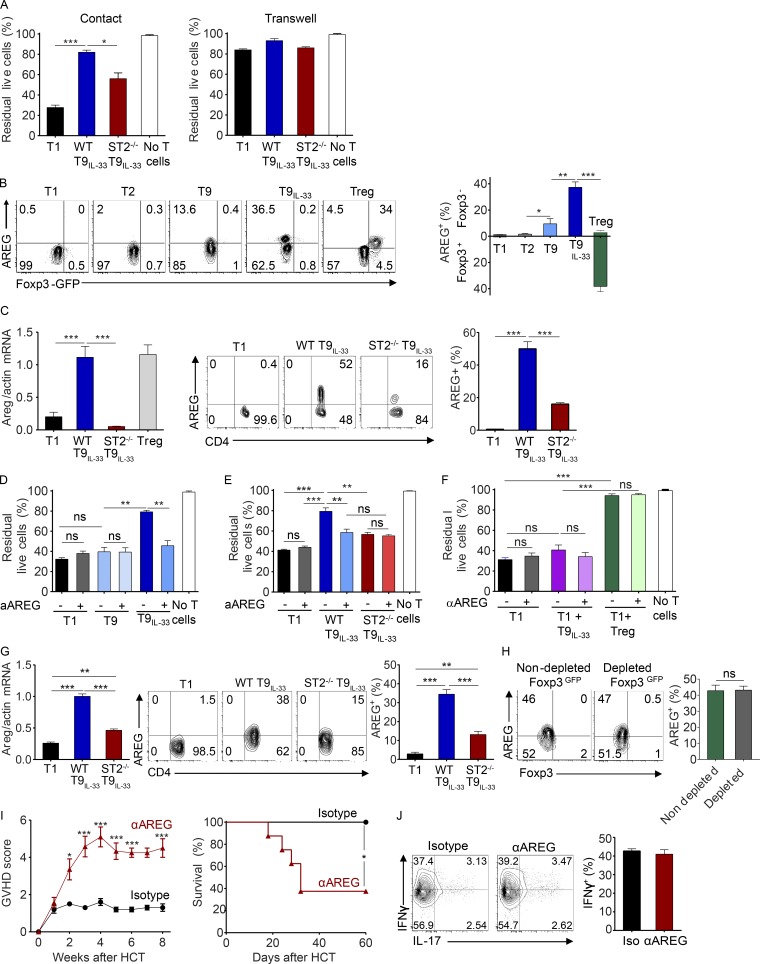
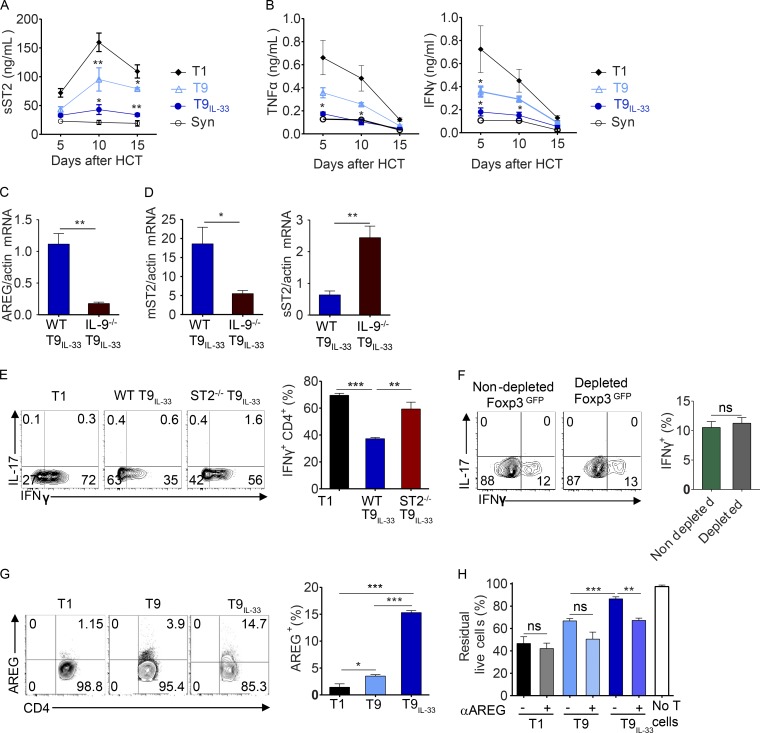
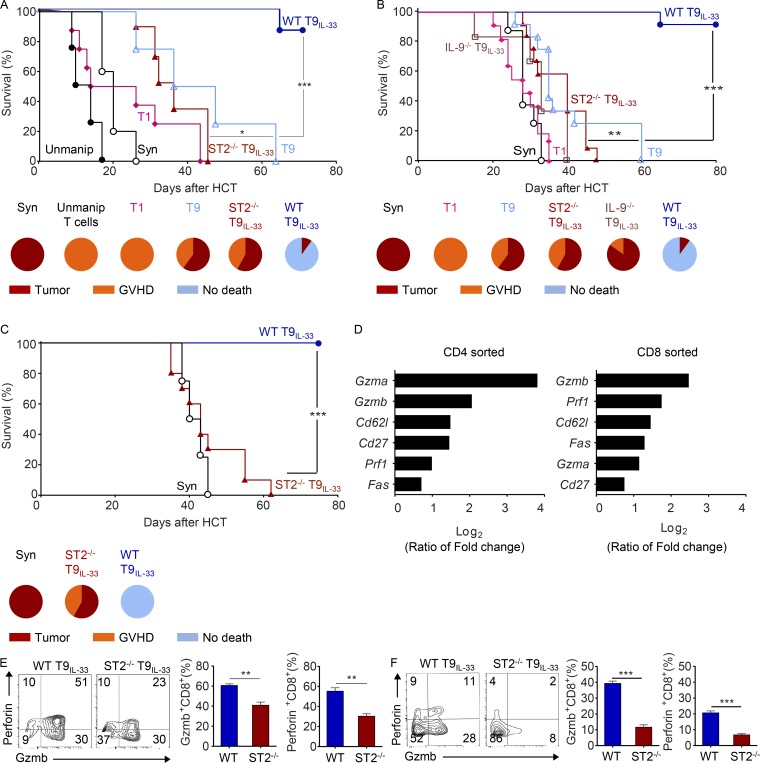
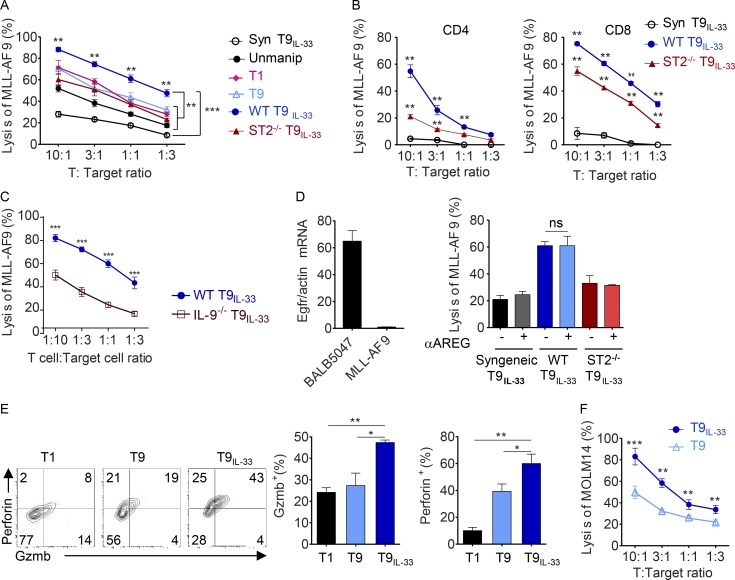
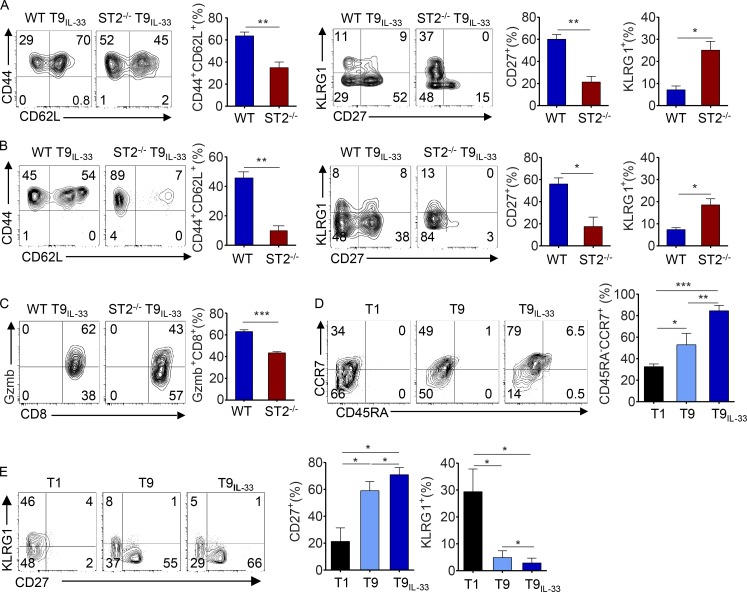
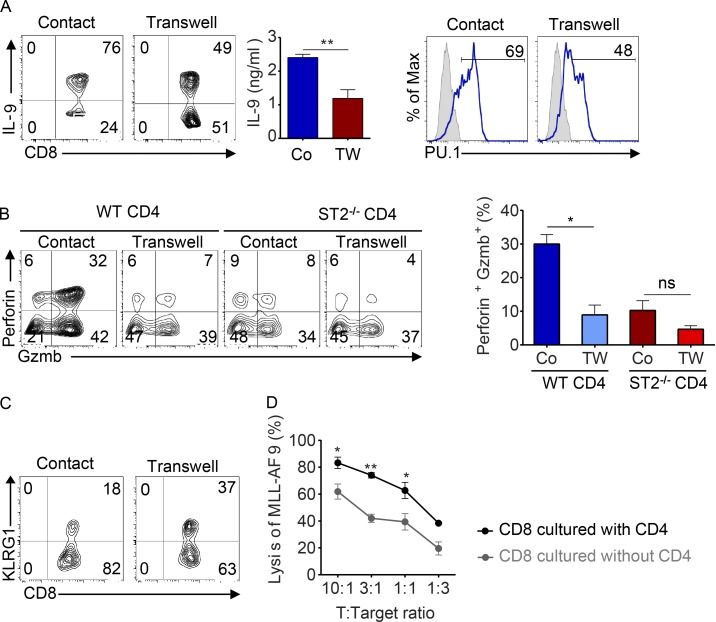
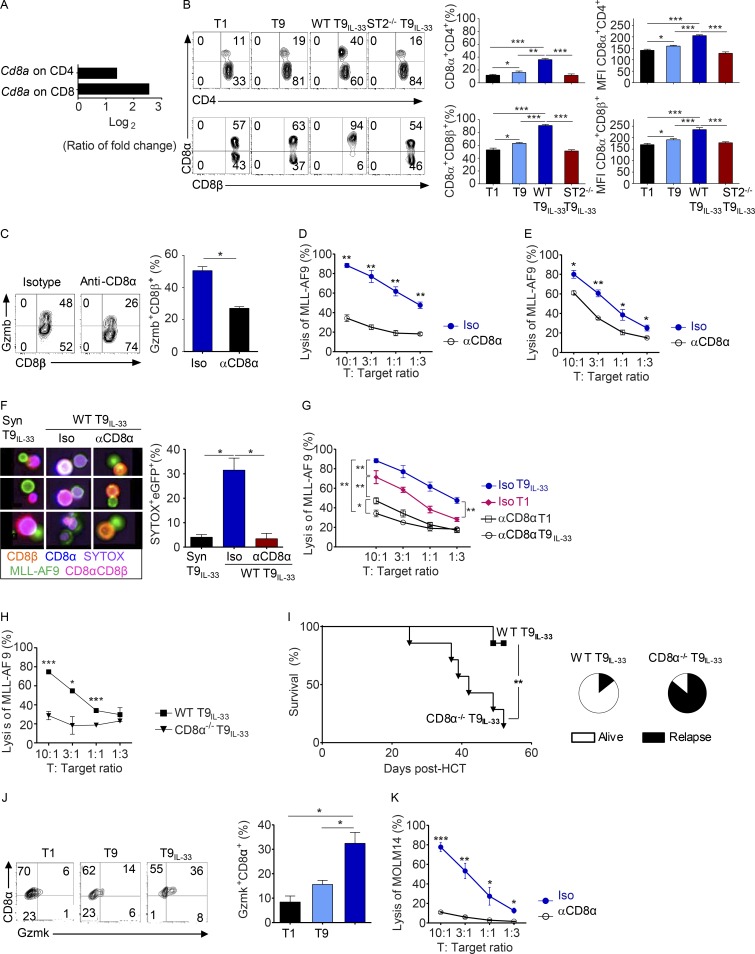
Allogeneic immune cells, particularly T cells in donor grafts, recognize and eliminate leukemic cells via graft-versus-leukemia (GVL) reactivity, and transfer of these cells is often used for high-risk hematological malignancies, including acute myeloid leukemia. Unfortunately, these cells also attack host normal tissues through the often fatal graft-versus-host disease (GVHD). Full separation of GVL activity from GVHD has yet to be achieved. Here, we show that, in mice and humans, a population of interleukin-9 (IL-9)-producing T cells activated via the ST2-IL-33 pathway (T9IL-33 cells) increases GVL while decreasing GVHD through two opposing mechanisms: protection from fatal immunity by amphiregulin expression and augmentation of antileukemic activity compared with T9, T1, and unmanipulated T cells through CD8α expression. Thus, adoptive transfer of allogeneic T9IL-33 cells offers an attractive approach for separating GVL activity from GVHD.


Figures

Figure 1.
Figure 1.
IL-33 enhances mST2, IL-9, and PU.1 expression on T9 cells, and adoptive transfer of T9IL-33 cells improves GVHD and survival after allo-HCT. (A) Representative histogram of mST2 expression on murine CD4 and CD8 T cell subsets after 5 d of differentiation (n = 5, from five independent experiments, unpaired t test; data are shown as mean ± SEM; *, P < 0.05). (B) Representative histogram of mouse PU.1 expression in CD4 and CD8 T cell subsets after 5 d of differentiation (n = 5, from five independent experiments, unpaired t test; data are shown as mean ± SEM; *, P < 0.05; **, P < 0.01). (C) Representative plots of IL-9 and IFN-γ expression from in vitro differentiated murine cells and a bar graphs showing the frequency of IL-9– and IFN-γ expressing T cells (n = 4, from four independent experiments, unpaired t test; data are shown as mean ± SEM; *, P < 0.05; **, P < 0.01; ***, P < 0.001). (D) mST2 expression on human CD4 and CD8 T cell subsets after 7 d of differentiation (n = 4, from four independent experiments, unpaired t test; data are shown as mean ± SEM; *, P < 0.05, mean ± SEM). (E) Representative histogram of PU.1 expression in human CD4 and CD8 T cell subsets after 7 d of differentiation (n = 3, from three independent experiments unpaired t test; data are shown as mean ± SEM; *, P < 0.05; ***, P < 0.001). (F) Representative plots of IL-9 and IFN-γ expression in human T cells differentiated into T9 cells in the presence or absence of IL-33, and bar graphs showing the frequency of IL-9– and IFN-γ–expressing T cells (n = 4, from four independent experiments, unpaired t test; data are shown as mean ± SEM; *, P < 0.05; ***, P < 0.001). (G) Clinical scores of GVHD and survival curves for BALB/c mice transplanted with B6 or syngeneic BM cells and in vitro differentiated or freshly isolated syngeneic T cells (n = 12 each group, from two independent experiments unpaired t test; data are shown as mean ± SEM; ***, P < 0.001). (H) Clinical scores of GVHD and survival curves for BALB/c mice receiving B6 or syngeneic BM cells and in vitro differentiated or freshly isolated syngeneic T cells (n = 24 per group, from three independent experiments, unpaired t test; data are shown as mean ± SEM; **, P < 0.01; ***, P < 0.001). (I) Clinical scores of GVHD and survival curves for C3H.SW mice receiving B6 or syngeneic BM cells and in vitro differentiated or freshly isolated syngeneic T cells (n = 7 per group, unpaired t test; data are shown as mean ± SEM; **, P < 0.01; ***, P < 0.001). For survival by log-rank test; **, P < 0.01; ***, P < 0.001.
Figure 2.
Figure 2.
Impact of T1 versus T9IL-33 cells on gut pathology and effect of ST2–IL-33 signaling on gut T cell proliferation, viability, and migration, T reg expansion, and ILC2 expansion. (A) Pathology index of mouse intestines at day 10 after allo-HCT with either T1 or T9IL-33 cells (n = 3, from three independent experiments, unpaired t test; data are shown as mean ± SEM; *, P < 0.05). Specimens were harvested, placed in 10% buffered formalin, embedded in paraffin, cut into 5-µm-thick sections, and stained with hematoxylin and eosin for histological examination. Slides were coded without reference to mouse type or prior treatment status and examined systematically by a single pathologist. (B) Representative plots of CFSE-labeled in gut T cells collected from mice on day 5 after all-HCT with syngeneic BALB/c T cells or allogeneic in vitro differentiated T cells. (C) Absolute counts of gut-infiltrating T cells from mice on day 10 after allo-HCT with syngeneic BALB/c T cells or allogeneic in vitro differentiated T cells (n = 3, mean ± SEM, from three independent experiments, unpaired t test; data are shown as mean ± SEM). (D) Representative plots of α4β7 and CRK (v-crk sarcoma virus CT10 oncogene homologue [avian], also called p38) and CCR5 in CD4 T cells infiltrating the gut at day 10 after HTC (n = 3, unpaired t test; data are shown as mean ± SEM). (E) Representative plots of Annexin V and fixable viability dye (FVD) staining of gut T cells at day 10 post-HTC (n = 3). (F) Representative plots of CD4 and FoxP3 and a bar graph showing the frequency of T reg cells (CD4+FoxP3+) in gut-infiltrating CD4 T cells at day 10 after HTC (n = 4, unpaired t test; data are shown as mean ± SEM). (G) Representative plots of mST2 and Gata3 in LinCD45+CD90.2+ cells (ILC2 markers, n = 4, unpaired t test; data are shown as mean ± SEM). (H) Ex vivo expression of Foxp3-GFP in gut CD4 T cells collected on day 14 after allo-HCT with either Foxp3-GFP–depleted or nondepleted allogeneic T9IL-33 cells (n = 3, mean ± SEM). (I) Clinical scores of GVHD and survival curves for C3H.SW mice receiving B6 BM cells and in vitro differentiated Foxp3-GFP–depleted or nondepleted T9IL-33 cells by flow cytometry (n = 9 per group, unpaired t test; data are shown as mean ± SEM).
Figure 3.
Figure 3.
ST2–IL-33 signaling enhances AREG expression on T9 cells, leading to protection of gut epithelial cells from alloreactivity. (A) B6 T1, WT T9IL-33, or ST2−/− T9IL-33 cells differentiated in MLR conditions were co-cultured with BALB-5047 colonic epithelial cells together (left) or through Transwells (right) for 6 h. The percentage of residual live BALB-5047 cells was measured by viability dye staining negative and flow cytometry (n = 4 from two independent experiments, unpaired t test; data are shown as mean ± SEM). (B) Representative plots of AREG and Foxp3 expression on CD4+ cells from in vitro differentiated T cell subsets from Foxp3-GFP reporter mice (n = 3, from three independent experiments, unpaired t test; data are shown as mean ± SEM; *, P < 0.05; **, P < 0.01; ***, P < 0.001). (C) AREG expression in in vitro differentiated and sorted CD4 subsets or T reg isolated freshly form spleen isolated magnetically using regulatory T cell isolation kit (Miltenyi). Gene expression was measured by real-time PCR and protein level by flow cytometry (n = 3, from three independent experiments, unpaired t test; data are shown as mean ± SEM; ***, P < 0.001). (D) Percentage of residual live cells of BALB-5047 cells after co-culture with T1, T9, or T9IL-33 cells for 6 h in the presence of anti-AREG blocking antibody or isotype control (n = 3, from three independent experiments, unpaired t test; data are shown as mean ± SEM; **, P < 0.01). (E) Percentage of residual live cells of BALB-5047 cells after co-culture with T1, WT T9IL-33, or ST2−/− T9IL-33 cells for 6 h in the presence of anti-AREG blocking antibody or isotype control (n = 3, from three independent experiments, unpaired t test; data are shown as mean ± SEM; **, P < 0.01; ***, P < 0.001). (F) Percentage of residual live cells among BALB-5047 cells after co-culture with T1 cells, T9IL-33 cells, T1 + T9IL-33 cells, or T1 + in vitro polarized T reg cells (purified magnetically using the regulatory T cell isolation kit) for 6 h in the presence of anti-AREG blocking antibody or isotype control (n = 3, mean ± SEM). (G) AREG expression in sorted CD4 subsets from intestine of GVHD mice collected on day 14 after allo-HCT with T1, WT T9IL-33, or ST2−/− T9IL-33 cells (n = 4, unpaired t test; data are shown as mean ± SEM; ***, P < 0.001). (H) Representative plots of ex vivo expression of AREG and Foxp3 in gut CD4 T cells collected on day 14 after allo-HCT with allogeneic T9IL-33 cells from Foxp3-GFP reporter mice depleted or nondepleted of Foxp3 T reg cells (n = 3, unpaired t test; data are shown as mean ± SEM). (I) Clinical scores of GVHD and survival curves for C3H.SW mice receiving B6 BM cells and in vitro differentiated T9IL-33 cells treated with five doses of 100 µg anti-AREG or isotype control every other day from day −1 to day 7 (n = 7 per group, unpaired t test; data are shown as mean ± SEM; *, P < 0.05; ***, P < 0.001. For survival by log-rank test (**, P < 0.01; ***, P < 0.001.). (J) Representative plots of ex vivo IFN-γ and IL-17 expression by gut-infiltrating T cells 10 d after HCT in mice treated with αAREG or isotype control antibodies, and bar graphs showing frequencies of IFN-γ–positive T cells. B6 WT T9IL-33 cells were cultured for 5 d, after which these cells were injected into lethally irradiated C3H.SW mice along with B6 WT BM cells. Mice were treated with a total of five doses of anti-AREG or isotype control (100 µg each) every other day from day −1 to day 7 (n = 4, unpaired t test; data are shown as mean ± SEM).
Figure 4.
Figure 4.
Allogeneic T cell interaction with colonic epithelial cells and AREG blockade in mice and human. (A) sST2 concentration in plasma collected every 5 d after HCT from the BALB/c mice receiving 5 × 10⁶ BM cells plus 106 from (n = 4, from two independent experiments, unpaired t test; data are shown as mean ± SEM; *, P < 0.05; **, P < 0.01). (B) TNF and IFN-γ concentrations in plasma collected every 5 d after HCT from BALB/c mice receiving 5 × 10⁶ BM cells plus 1 × 10⁶ from syngeneic T cells (BALB/c mice) or T1, T9, or T9IL-33 T cells from B6 WT mice (n = 4, from two independent experiments, unpaired t test; data are shown as mean ± SEM; *, P < 0.05, **. P < 0.01). (C) Ratio of AREG/actin mRNA expression in WT or IL-9−/− T9IL-33 cells. (D) Ratio of mST2/actin expression (left) and sST2/actin expression (right) in WT or IL-9−/− T9IL-33 cells (n = 3, from three independent experiments, unpaired t test; data are shown as mean ± SEM; *, P < 0.05; **, P < 0.01). (E) Ex vivo expression of IFN-γ and IL-17 in gut CD4 T cells collected on day 14 after allo-HCT with allogeneic T1, WT T9IL-33, or ST2−/− T9IL-33 cells (n = 4, from two independent experiments, unpaired t test; data are shown as mean ± SEM; **, P < 0.01; ***, P < 0.001). (F) Ex vivo expression of IFN-γ and IL-17 in gut CD4 T cells collected on day 14 after allo-HCT with T9IL-33 cells from Foxp3-GFP reporter mice depleted or nondepleted of Foxp3 T reg cells (n = 3, unpaired t test; data are shown as mean ± SEM). (G) AREG expression on in vitro differentiated human T1, T9, and T9IL-33 CD4 cells from healthy donors (n = 3, from three independent experiments, unpaired t test; data are shown as mean ± SEM; *, P < 0.05; **, P < 0.01; ***, P < 0.001). (H) Percentage of residual live human colonic cells after co-culture with T1, T9, T9IL-33 cells for 6 h in the presence of anti-AREG blocking antibody or isotype control and without T cells as control (n = 3, from three independent experiments, unpaired t test; data are shown as mean ± SEM; **, P < 0.01; ***, P < 0.001).
Figure 5.
Figure 5.
T9IL-33 cells preserve GVL and antitumor activity. (A). Survival curves for BALB/c mice receiving 104 syngeneic lymphoma cell line A20 cells with syngeneic T cells or allogeneic in vitro differentiated cells (n = 12 mice per group, from two independent experiments; ***, P < 0.0001, log-rank test). Pie charts show cause of death. (B) Survival curves for BALB/c mice receiving 104 cells of the syngeneic MLL-AF9 leukemic cell line with syngeneic T cells or allogeneic in vitro differentiated cells (n = 12 mice per group, from two independent experiments; **, P < 0.01; ***, P < 0.001, log-rank test). Pie charts show cause of death. (C) Survival curves for C3H.SW mice receiving 104 MLL-AF9 leukemic cells with syngeneic T9IL-33 cells or allogeneic in vitro differentiated cells (n = 14 mice per group, from two independent experiments; ***, P < 0.001, log-rank test). Pie charts show cause of death. (D) Transcriptome analysis of Gzma, Gzmb, Prf1, Cd62l, Cd27, and Fas expression in sorted WT T9IL-33 versus ST2−/− T9IL-33 CD8 and CD4 cells (n = 3; see Fig. S2). (E) Representative plots of Gzmb and Prf1 expression in WT T9IL-33 and ST2−/− T9IL-33 cells gated on CD8, and bar graphs showing the frequency of GzmB+ and Prf1+ CD8 T cells (n = 8, from four independent experiments, unpaired t test; data are shown as mean ± SEM; **, P < 0.01). (F) Representative plots of GzmB and Prf1 expression in gated CD8 T cells from BM 28 d after adoptive transfer of allogeneic T cells with syngeneic MLL-AF9 cells. Bar graphs show the frequency of GzmB+ and Prf1+ CD8 T cells (n = 4, unpaired t test; data are shown as mean ± SEM; ***, P < 0.001).
Figure 6.
Figure 6.
ST2–IL-33 signaling enhances cytolytic molecules expression and cytolytic activity. (A) Cytolytic assays: B6 or C3H.SW T cell MLR cultures were co-cultured with C3H.SW-derived MLL-AF9 leukemic cells for 6 h (n = 4, from two independent experiments, unpaired t test; data are shown as mean ± SEM; **, P < 0.01). (B) Cytolytic assays. CD4 or CD8 purified from B6 or C3H.SW T cell MLR cultures were co-cultured with C3H.SW-derived MLL-AF9 cells for 6 h (n = 4, from four independent experiments, unpaired t test; data are shown as mean ± SEM; **, P < 0.01). (C) Cytolytic assay of B6 WT or IL-9−/− T9IL-33 cells differentiated under MLR conditions. After 5 d, WT or IL-9−/− T9IL-33 cells were incubated with BALB/c MLL-AF9 cells for 6 h (n = 3, from three independent experiments, unpaired t test; data are shown as mean ± SEM; ***, P < 0.001). (D) mRNA expression of Egfr on BALB-5047, MLL-AF9 cells by quantitative PCR (left). Syngeneic T9IL-33, WT T9IL-33, or ST2−/− T9IL-33 cells were differentiated in MLR conditions and co-cultured with BALB/c MLL-AF9 cells for 6 h at a ratio of 10:1 with anti-AREG (right; n = 3, unpaired t test; data are shown as mean ± SEM). (E) Representative plots of human GzmB and perforin expression in human T9 and T9IL-33 cells, and bar graphs showing the frequencies of GzmB+ and GzmK+ cells (n = 3, from three independent experiments, unpaired t test; data are shown as mean ± SEM; *, P < 0.05; **, P < 0.01). (F) Cytolytic assays of human T9 or T9IL-33 cells incubated for 6 h with MOLM14 leukemia cells (n = 3, from three independent experiments, unpaired t test; data are shown as mean ± SEM; **, P < 0.01; ***, P < 0.001).
Figure 7.
Figure 7.
ST2–IL-33 signaling preserves central memory phenotype. (A) Representative plots of CD62L+ and CD44+ (left) and CD27+ and KLRG1+ (right) cells, and bar graphs showing the frequency of CD44+CD62L+, CD27+, and KLRG1+ CD8 T cells from in vitro differentiated cells from WT T9IL-33 versus ST2−/− T9IL-33 cells (n = 4, from four independent experiments, unpaired t test; data are shown as mean ± SEM; **, P < 0.01). (B) Representative plots of CD62L+ and CD44+ (left) and CD27+ and KLRG1+ (right) cells, and bar graphs showing the frequency of CD44+CD62L+ and CD27+ CD8 T cells from ex vivo BM collected on day 28 from mice receiving MLL-AF9 leukemic cells with WT T9IL-33 or ST2−/− T9IL-33 cells (n = 4, unpaired t test; data are shown as mean ± SEM; *, P < 0.05; **, P < 0.01). (C) Representative plots of Gzmb expression in WT or ST2−/− CD8+KLRG-1+CD27 short-term effector cells differentiated under T9IL-33 conditions, and a bar graph showing the frequency of Gzmb expression in these cells (n = 3, unpaired t test; data are shown as mean ± SEM; ***, P < 0.001). (D and E) Representative plots of CD45RA and CCR7+ (D) and CD27+ and KLRG1+ (E) cells, and bar graphs showing the frequency of CD45RACCR7+, CD27+, and KLRG1+ CD8 T cells from in vitro differentiated T1, T9, and T9IL-33 human cells (n = 3, from three independent experiments, paired t test; data are shown as mean ± SEM; *, P < 0.05; **, P < 0.01).
Figure 8.
Figure 8.
ST2–IL-33 signaling in CD4 impacts CD8 antitumor activity. (A) Granzyme B and perforin expression in CD8 T cells cultured with WT or ST2−/− CD4 cells together or through a Transwell under T9IL-33 conditions (n = 3, from three independent experiments, unpaired t test; data are shown as mean ± SEM; *, P < 0.05). (B) Splenic CD4 and CD8 cells were either co-cultured together or separated in a Transwell under T9IL-33 conditions for 5 d. Representative plots and mean ± SEM of IL-9 expression in CD8 T cells (left), IL-9 secretion from total T9IL-33 (center), and PU.1 expression in CD8 T cells (right) either from co-culture (Co) or through Transwell (TW; n = 3, unpaired t test; data are shown as mean ± SEM; **, P < 0.01). (C) KLRG1 expression on CD8 cells cultured together or through a Transwell with CD4 T cells. (D) Cytolytic assays of purified CD8 cells differentiated into Tc9IL-33 cells or co-cultured in the presence of CD4 in MLR conditions (n = 4, from two independent experiments, unpaired t test; data are shown as mean ± SEM; *, P < 0.05).
Figure 9.
Figure 9.
CD8α expression is up-regulated on CD4+ and CD8+ murine and human T9IL-33 cells and increases their killing of leukemia cells. (A) Transcriptome analysis of CD8α expression in sorted WT T9IL-33 versus ST2−/− T9IL-33 CD8 and CD4 cells (n = 3; see Fig. S2). (B) Representative plots of CD8α expression on CD4+ (top) and CD8β+ (bottom) T cells from in vitro differentiated murine T1, T9, WT T9IL-33, and ST2−/− T9IL-33 cells, and bar graphs showing the frequency and mean florescence intensity (MFI) of CD4+CD8a+ and CD8α+CD8β+ T cells for each condition (n = 6, from three independent experiments, unpaired t test; data are shown as mean ± SEM; *, P < 0.05; **, P < 0.01; ***, P < 0.001). (C) Representative plots of Gzmb expression in CD8β+ T cells differentiated under T9IL-33 conditions plus either anti-CD8α or isotype control, and bar graphs showing the frequency of Gzmb+CD8β+ cells (n = 3, from three independent experiments, unpaired t test; data are shown as mean ± SEM; *, P < 0.05). (D) Cytolytic assays of in vitro differentiated B6 T9IL-33 incubated with BALB/c MLL-AF9 cells in the presence of anti-CD8α or isotype control for 6 h (n = 3, from three independent experiments, unpaired t test; data are shown as mean ± SEM; **, P < 0.01). (E) Cytolytic assays. B6 T9IL-33 cells were differentiated in MLR conditions with anti-CD8α blocking antibody or isotype control. After 5 d, T9IL-33 cells were incubated with BALB/c MLL-AF9 cells for 6 h (n = 3, from three independent experiments, unpaired t test; data are shown as mean ± SEM; *, P < 0.05; **, P < 0.01). (F) ImageStream cell images of syngeneic T9IL-33 or allogeneic T9IL-33 cells incubated with BALB/c eGFP–MLL-AF9 cells and anti-CD8α blocking antibody or isotype control for 3 h (n = 3, unpaired t test; data are shown as mean ± SEM; *, P < 0.05). (G) Cytolytic assays of in vitro differentiated B6 T1 or T9IL-33 incubated with BALB/c MLL-AF9 cells in the presence of anti-CD8α or isotype control for 6 h (n = 3, mean ± SEM). (H) Cytolytic assay of in vitro differentiated B6 WT T9IL-33 or CD8α−/− T9IL-33 cells in MLR conditions. After 5 d, both WT and ST2−/− T9IL-33 cells were incubated with BALB/c MLL-AF9 cells for 6 h (n = 3, unpaired t test; data are shown as mean ± SEM; *, P < 0.05; ***, P < 0.001). (I) Survival curves for BALB/c mice receiving 104 cells of the syngeneic MLL-AF9 leukemic cell line with allogeneic WT (n = 7 mice per group, **, P < 0.01, log-rank test). Pie charts show relapses. (J) Representative plots of CD8α and GzmK expression from human in vitro differentiated T1, T9, and T9IL-33 cells and a bar graph showing the frequency of GzmK+CD8α+ T cells from each condition (n = 3, from three independent experiments, unpaired t test; data are shown as mean ± SEM; *, P < 0.05). (K) Cytolytic assays of human T9IL-33 cells differentiated with anti-CD8α blocking antibody or isotype control and incubated with MOLM14 cells for 6 h (n = 3, from three independent experiments, unpaired t test; data are shown as mean ± SEM; *, P < 0.05; **, P < 0.01; ***, P < 0.001).

Similar articles

Cited by

References

    1. American Cancer Society 2015. Cancer Facts & Figures 2015. American Cancer Society, Atlanta: https://www.cancer.org/research/cancer-facts-statistics/all-cancer-facts....
    1. Arpaia N., Green J.A., Moltedo B., Arvey A., Hemmers S., Yuan S., Treuting P.M., and Rudensky A.Y.. 2015. A Distinct Function of Regulatory T Cells in Tissue Protection. Cell. 162:1078–1089. 10.1016/j.cell.2015.08.021 - DOI - PMC - PubMed
    1. Baba Y., Maeda K., Yashiro T., Inage E., Niyonsaba F., Hara M., Suzuki R., Ohtsuka Y., Shimizu T., Ogawa H., et al. . 2012. Involvement of PU.1 in mast cell/basophil-specific function of the human IL1RL1/ST2 promoter. Allergol. Int. 61:461–467. 10.2332/allergolint.12-OA-0424 - DOI - PubMed
    1. Bachireddy P., Burkhardt U.E., Rajasagi M., and Wu C.J.. 2015. Haematological malignancies: at the forefront of immunotherapeutic innovation. Nat. Rev. Cancer. 15:201–215. 10.1038/nrc3907 - DOI - PMC - PubMed
    1. Badovinac V.P., Tvinnereim A.R., and Harty J.T.. 2000. Regulation of antigen-specific CD8+ T cell homeostasis by perforin and interferon-gamma. Science. 290:1354–1358. 10.1126/science.290.5495.1354 - DOI - PubMed

MeSH terms