. 2017 Oct 16;8(1):941.
doi: 10.1038/s41467-017-00924-7.

Myoblasts and macrophages are required for therapeutic morpholino antisense oligonucleotide delivery to dystrophic muscle

Affiliations

Myoblasts and macrophages are required for therapeutic morpholino antisense oligonucleotide delivery to dystrophic muscle

James S Novak et al. Nat Commun. .

Erratum in

Abstract

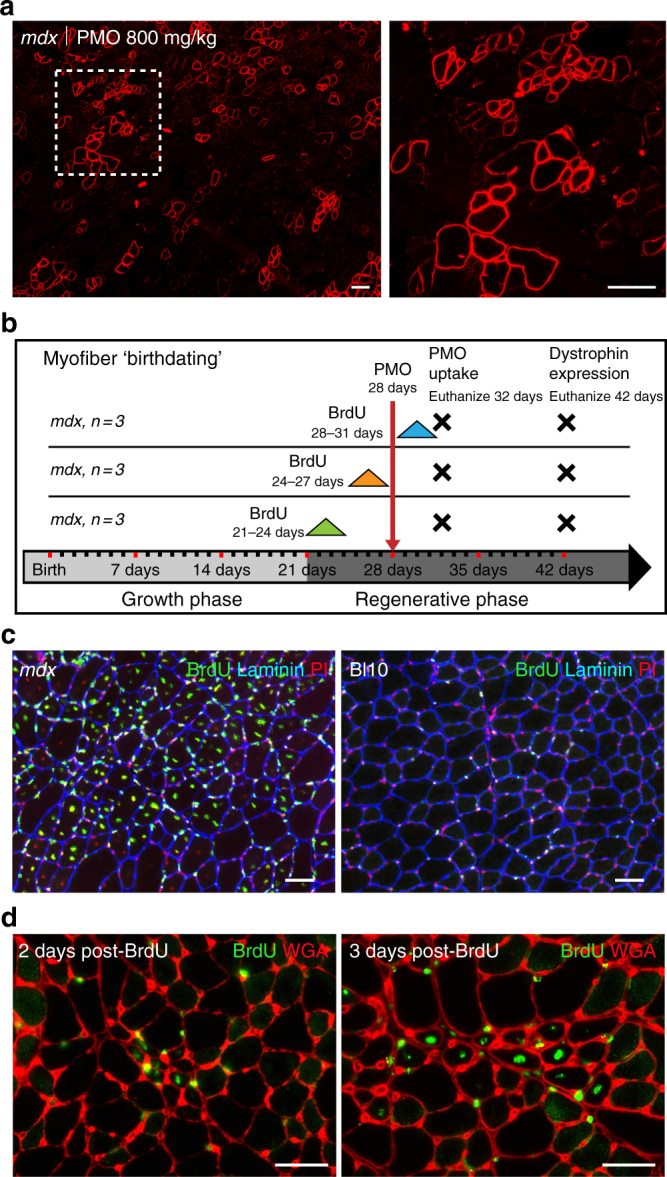
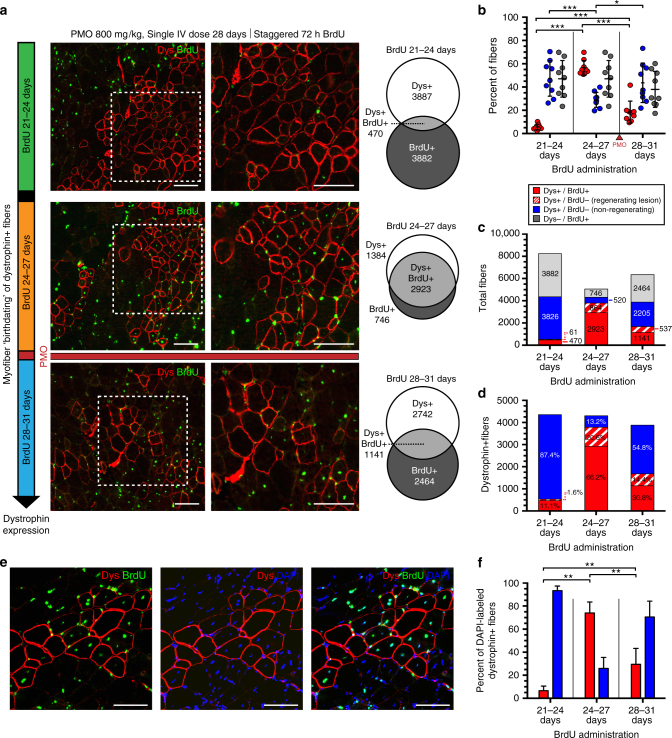
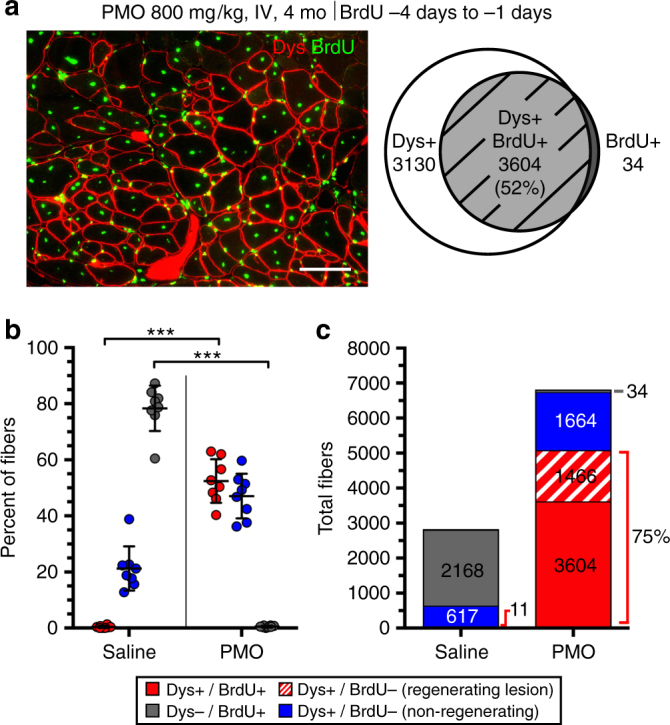
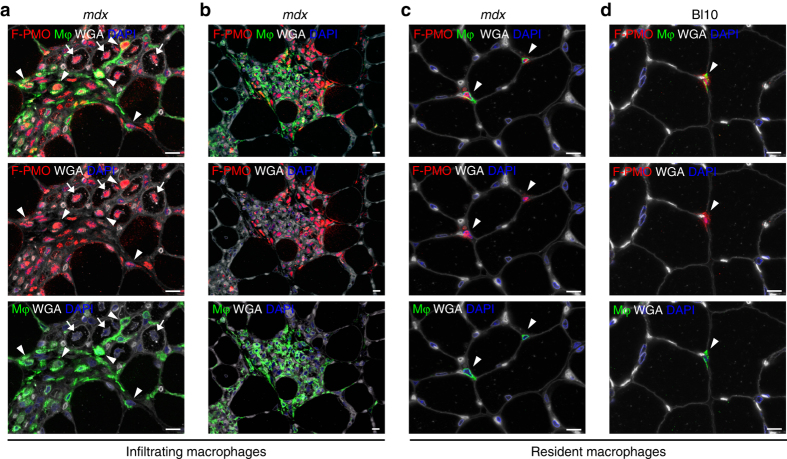
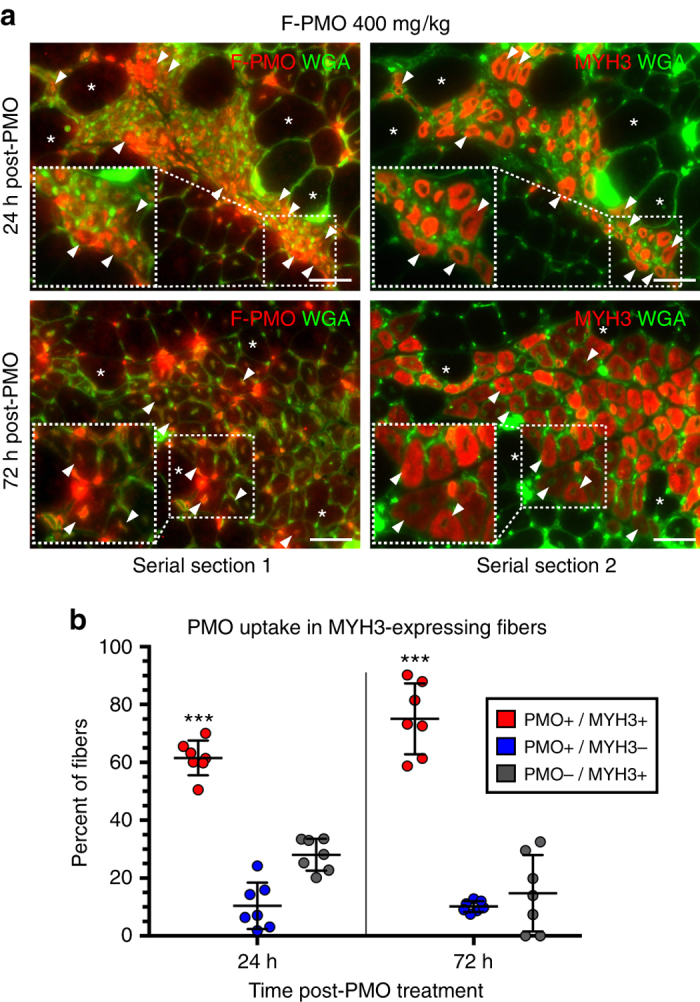
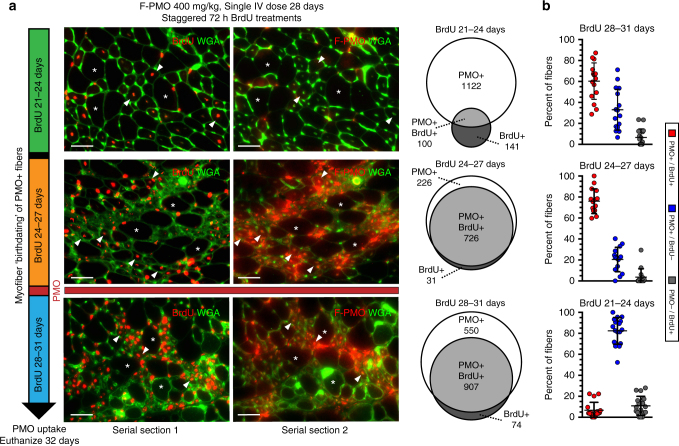
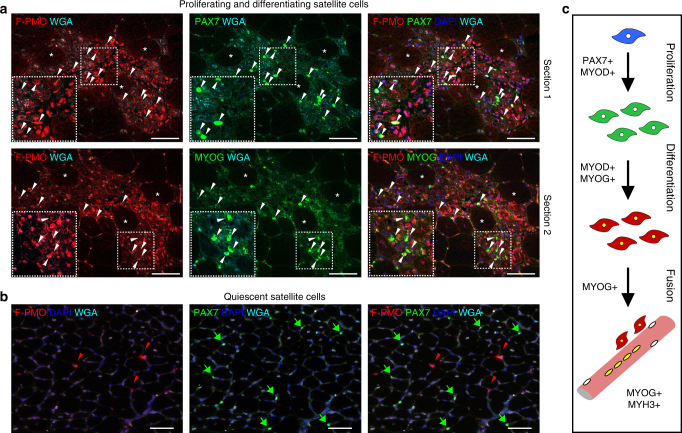
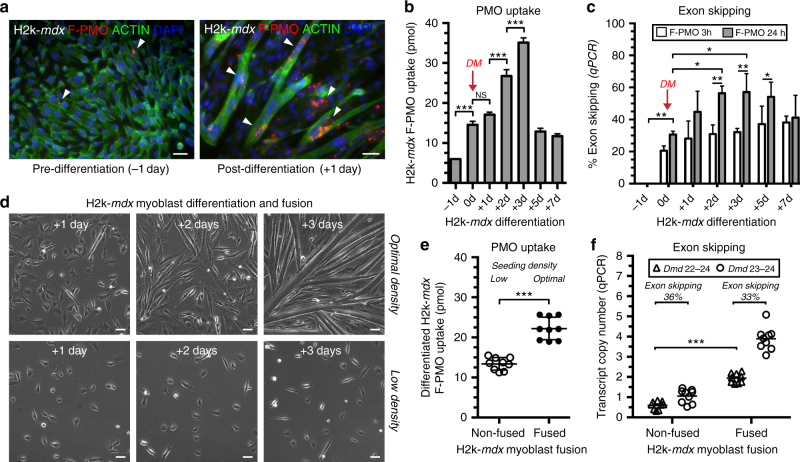
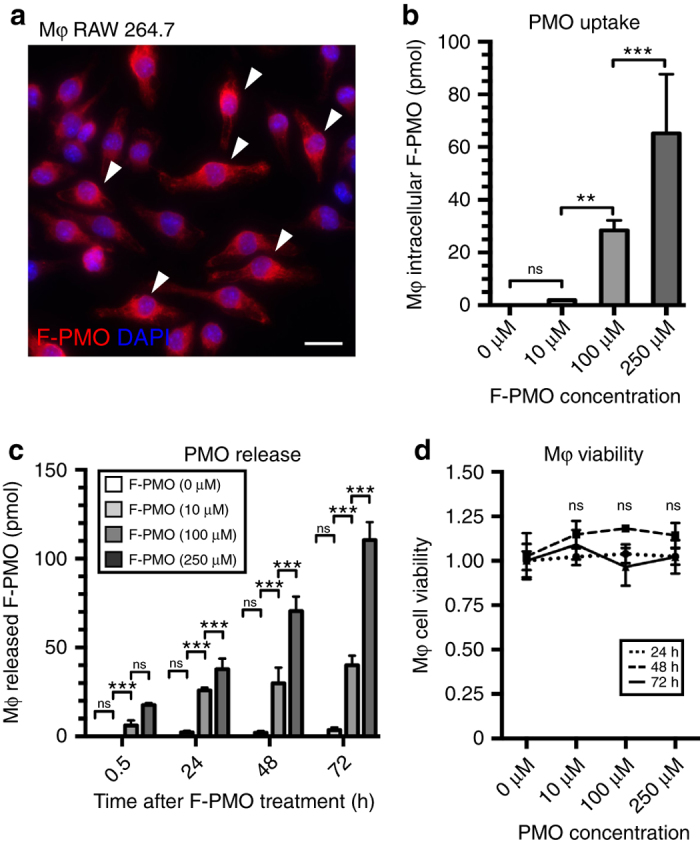
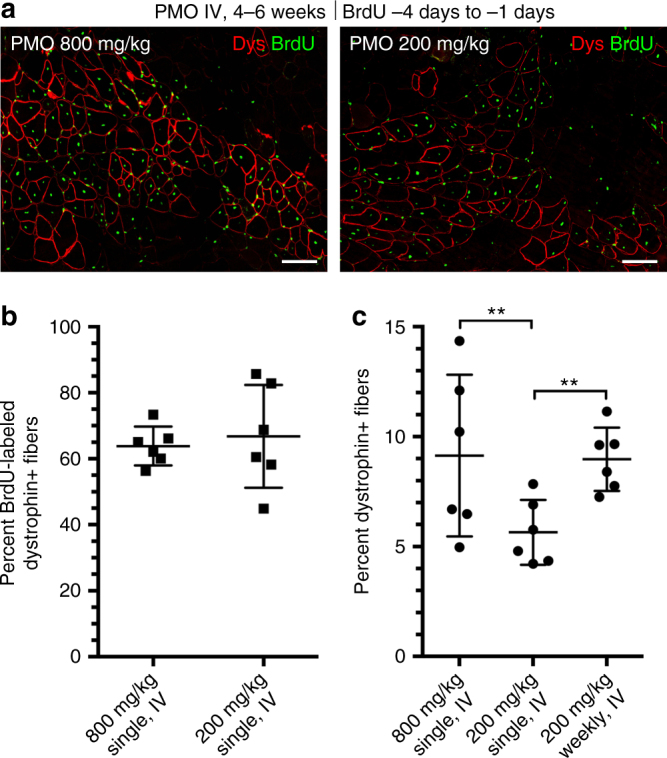
Exon skipping is a promising therapeutic strategy for Duchenne muscular dystrophy (DMD), employing morpholino antisense oligonucleotides (PMO-AO) to exclude disruptive exons from the mutant DMD transcript and elicit production of truncated dystrophin protein. Clinical trials for PMO show variable and sporadic dystrophin rescue. Here, we show that robust PMO uptake and efficient production of dystrophin following PMO administration coincide with areas of myofiber regeneration and inflammation. PMO localization is sustained in inflammatory foci where it enters macrophages, actively differentiating myoblasts and newly forming myotubes. We conclude that efficient PMO delivery into muscle requires two concomitant events: first, accumulation and retention of PMO within inflammatory foci associated with dystrophic lesions, and second, fusion of PMO-loaded myoblasts into repairing myofibers. Identification of these factors accounts for the variability in clinical trials and suggests strategies to improve this therapeutic approach to DMD.Exon skipping is a strategy for the treatment of Duchenne muscular dystrophy, but has variable efficacy. Here, the authors show that dystrophin restoration occurs preferentially in areas of myofiber regeneration, where antisense oligonucleotides are stored in macrophages and delivered to myoblasts and newly formed myotubes.


Conflict of interest statement

The authors declare no competing financial interests.

Figures

Fig. 1
Fig. 1
PMO and BrdU co-administration to investigate PMO uptake and efficacy relative to regeneration. a Patchy dystrophin expression shown in mdx quadriceps 2 weeks after single IV dose of PMO (800 mg/kg, n = 3). Dashed box shows magnified inlay, scale bars represent 100 μm. b Schematic representation of parallel PMO-BrdU labeling assays to investigate relationship between PMO localization, dystrophin expression, and muscle regeneration. c Onset of mdx pathology at 4 weeks characterized by widespread regeneration shown by BrdU labeling of centrally nucleated fibers. Bl10 muscle without regeneration shown as control with only minor labeling of interstitial nuclei. BrdU (green), laminin (blue), and propidium iodide (PI, red). Scale bars represent 50 μm. d BrdU labeling of newly regenerated fibers shown in 4 week mdx gastrocnemius 48 and 72 h following a 24 h feeding of BrdU. Scale bars represent 50 μm
Fig. 2
Fig. 2
Systemic PMO delivery targets dystrophin expression to spontaneously regenerating mdx myofibers. a Dystrophin expression in 6 week mdx mice (i.e., tricep, gastrocnemius, and quadriceps) after single IV dose of PMO (800 mg/kg, n = 3). PMO injected at day 28 together with staggered pulses of BrdU (i.e., 21–24 days, 24–27 days, 28–31 days). Dystrophin (Dys, red) and BrdU+ve myonuclei (green) 14 days after PMO. Venn diagrams demonstrate the overlap between dystrophin expression (Dys+ve) and myofiber regeneration (BrdU+ve). b Quantification of Dys+ve/BrdU+ve, Dys+ve/BrdU−ve, and Dys−ve/BrdU+ve myofibers for each BrdU cohort shown as a percentage of labeled fibers. Data represented as scatter plot with SD; n = 3 mdx mice per BrdU cohort. c Quantification of total fibers characterized as Dys+ve/BrdU+ve (red), Dys+ve/BrdU−ve within a regenerating lesion (dashed red), Dys+ve/BrdU−ve isolated revertants (blue), or Dys−ve/BrdU+ve (gray). d Quantification of BrdU co-localization in dystrophin+ve fibers; Dys+ve/BrdU+ve (red), Dys+ve/BrdU−ve within a regenerating lesion (dashed red), Dys+ve/BrdU−ve (blue) (n = 3). e BrdU-DAPI co-staining procedure to confirm BrdU specificity and assess prevalence of central myonuclei per myofiber within a given cross-section. f Quantification of BrdU-labeling for centrally nucleated (DAPI+ve), dystrophin+ve myofibers. Scale bars represent 100 μm. Statistical analysis performed by Mann–Whitney nonparametric test; ***p < 0.001, **p < 0.01, *p < 0.05
Fig. 3
Fig. 3
PMO entry of regenerating myofibers in mature mdx mice. a Dystrophin expression specific to BrdU+ve regenerated myofibers in aged mdx muscle (triceps, gastrocnemius, and quadriceps) following a single IV dose of PMO (800 mg/kg, n = 3) at 13 weeks of age in conjunction with BrdU administered for 72 h prior to PMO delivery. Dystrophin expression (Dys, red) and BrdU+ve central myonuclei (green) 14 day after PMO to evaluate dystrophin restoration relative to muscle regeneration. Venn diagram demonstrates the overlap between dystrophin expression (Dys+ve) and myofiber regeneration (BrdU+ve). Scale bar represents 100 μm. b Quantification of Dys+ve/BrdU+ve, Dys+ve/BrdU−ve, and Dys−ve/BrdU+ve myofibers shown as a percentage of labeled fibers. Data represented as scatter plot with SD. c Quantification of labeled fibers classified as Dys+ve/BrdU+ve (red), Dys+ve/BrdU−ve within a regenerating lesion (dashed red), Dys+ve/BrdU−ve (blue), or Dys−ve/BrdU+ve (gray) (n = 4). Statistical analysis performed by Mann–Whitney nonparametric test; ***p < 0.001
Fig. 4
Fig. 4
PMO penetrates infiltrating inflammatory cells targeting regions of active muscle regeneration. a PMO uptake within infiltrating macrophages, targeting areas of regeneration after systemic F-PMO delivery in 4 week mdx mice (400 mg/kg, n = 3); PMO uptake observed within myonuclei is marked by arrow, while PMO-loaded macrophages (Mφ) are marked by arrowheads and immunostained with F4/80. b Widespread PMO accumulation within a large population of infiltrating macrophages and other inflammatory cells targeting degenerating myofibers. c, d Sporadic PMO uptake within interstitial, resident macrophages localized in non-regenerating mdx (c) and wild-type (d) muscle. Arrowheads mark examples of PMO+ve macrophages. Muscles were analyzed following single injection of F-PMO, mice were euthanized 4 days post-PMO delivery. PMO, red; macrophage F4/80, green; DAPI, blue; WGA, white; scale bars represent 10 μm
Fig. 5
Fig. 5
PMO uptake prevalent among actively regenerating myofibers expressing embryonic myosin heavy chain. a PMO localization and uptake specific to regenerating myofiber clusters expressing MYH3, after systemic F-PMO delivery in 4 week mdx mice (400 mg/kg, n = 3). Co-localization of PMO and MYH3+ve myofibers examined in gastrocnemius, quadriceps, and triceps at 24 and 72 h post-PMO delivery. Asterisks denote fiber identity between serial cross-sections; arrowheads denote examples of MYH3+ve myofibers with nuclear PMO. Dashed boxes show magnified inlay; scale bars represent 50 μm. b Quantification of PMO localization in MYH3+ve myofibers shown as percent of labeled fibers. Statistical analysis performed by Mann–Whitney nonparametric test; ***p < 0.001. Data represented as scatter plot with SD
Fig. 6
Fig. 6
Robust PMO uptake in actively regenerating myofibers concurrent with systemic PMO delivery. a Myonuclear PMO uptake after single IV dose of F-PMO (400 mg/kg, n = 3) in 4 week mdx mice treated with staggered pulses of BrdU (refer to Fig. 1c “PMO uptake”). Note, asterisks denote fiber identity between serial cross-sections and arrowheads denote examples of centrally-nucleated BrdU+ve/PMO+ve myofibers. Venn diagrams demonstrate the overlap between F-PMO localization (PMO+ve) and myofiber regeneration (BrdU+ve). Scale bars represent 50 μm. b Quantification of PMO+ve/BrdU+ve, PMO+ve/BrdU−ve, and PMO−ve/BrdU+ve myofibers shown as percent of labeled fibers per BrdU cohort (n = 3 mice per cohort). Statistical analysis performed by Mann–Whitney nonparametric test; ***p < 0.001, **p < 0.01, *p < 0.05. Data represented as scatter plot with SD
Fig. 7
Fig. 7
PMO infiltration of proliferating and differentiating myoblasts facilitates entry into actively regenerating fibers. a PMO uptake in proliferating (PAX7+ve, top panel) or differentiating (MYOG+ve, bottom panel) myoblasts within regenerating foci. mdx mice treated at 4 weeks with a single dose of F-PMO (400 mg/kg, n = 3) and euthanized 24 h after PMO delivery. Asterisks denote fiber identity between serial cross-sections; arrowheads denote PAX7+ve or MYOG+ve (green) cells co-labeled for PMO (red). Myoblasts void of PMO remain unmarked for comparison. Images acquired by confocal; dashed boxes show magnified inlay and scale bars represent 50 μm. b PAX7+ve satellite cells residing in non-regenerating muscle regions do not co-localize with PMO+ve nuclei. Arrowheads mark PMO+ve nuclei. Merged image shows PMO (red), PAX7 or MYOG (green), WGA (cyan), and DAPI (blue). Gastrocnemius shown; scale bars represent 50 μm. c Schematic representation of myoblast proliferation, differentiation, and fusion with corresponding gene expression
Fig. 8
Fig. 8
In vitro assessment of PMO uptake during myoblast differentiation and fusion. a F-PMO uptake in H2k-mdx myoblasts and fusing myotubes in vitro after a 24 h treatment with 100 μM F-PMO. F-PMO (red), actin (green), DAPI (blue). b Quantified F-PMO uptake (pmol) in H2k-mdx myoblasts at the designated time points pre-differentiation and post-differentiation after treatment with 100 μM F-PMO. c Exon skipping quantified by RT-qPCR as relative level of skipped vs. unskipped Dmd transcript 24 h following a 3 or 24 h F-PMO treatment (100 μM). Data represented as mean with SD. DM denotes change to differentiation media. d DIC imaging of H2k-mdx myoblasts at time points after onset of differentiation when seeded at optimal density to promote efficient myoblast fusion, or low density to inhibit myoblast fusion. e Quantified F-PMO uptake (pmol) in H2k-mdx cells treated with F-PMO (100 μM, 24 h) 2 days post-differentiation when maintained at optimal or low density. f Dmd mRNA transcript copy number quantified by RT-qPCR for skipped and unskipped transcripts 24 h after F-PMO treatment (100 μM, 24 h) in response to myoblast differentiation and fusion. Data represented as bar graph or scatter plot with SD. Statistical analysis performed by one-way ANOVA (b, c) or Mann–Whitney nonparametric test (e, f), ***p < 0.001, **p < 0.01, *p < 0.05. Scale bars represent 50 μm
Fig. 9
Fig. 9
Investigation of PMO uptake and release in cultured macrophages. a F-PMO uptake in cultured RAW 264.7 macrophages (Mφ) after 24 h treatment with 100 μM F-PMO. F-PMO (red), DAPI (blue). Arrowheads mark PMO+ve macrophages. Scale bar represents 20 μm. b Quantified F-PMO uptake (pmol) in cultured macrophages at designated time points after 24 h treatment of 10, 100, and 250 μM F-PMO. c Release of F-PMO (pmol) from cultured macrophages quantified at 0.5, 24, 48, and 72 h after 24 h F-PMO treatment (0, 10, 100, or 250 μM). d Normalized CCK-8 viability assay for cultured macrophages 24, 48, and 72 h, after 24 h PMO treatment. Statistical analysis performed by one-way ANOVA, ***p < 0.001, **p < 0.01, *p < 0.05
Fig. 10
Fig. 10
Role of myofiber repair in productive exon skipping consistent between low and high systemic PMO doses. a Dystrophin restoration and BrdU co-localization observed in 4–6 week mdx mice (i.e., triceps, gastrocnemius) after single, systemic dose of PMO (200 or 800 mg/kg, n = 3). BrdU administered for 72 h prior to IV PMO delivery. Dystrophin (Dys, red) and BrdU+ve myonuclei (green) 14 days after PMO. Scale bars represent 100 μm. b Quantification of dystrophin and BrdU co-localization after 200 or 800 mg/kg PMO shown as percent of labeled fibers. c Quantification of dystrophin-expressing fibers after a single dose of 200 or 800 mg/kg or 4 weekly 200 mg/kg doses shown as percent of total fibers per cross-section. Data represented as scatter plot with SD. Statistical analysis performed by Mann–Whitney nonparametric test; ***p < 0.001, **p < 0.01, *p < 0.05

References

    1. Hoffman EP, Brown RH, Jr., Kunkel LM. Dystrophin: the protein product of the Duchenne muscular dystrophy locus. Cell. 1987;51:919–928. doi: 10.1016/0092-8674(87)90579-4. - DOI - PubMed
    1. Hoffman EP, Monaco AP, Feener CC, Kunkel LM. Conservation of the Duchenne muscular dystrophy gene in mice and humans. Science. 1987;238:347–350. doi: 10.1126/science.3659917. - DOI - PubMed
    1. Guiraud S, et al. The pathogenesis and therapy of muscular dystrophies. Annu. Rev. Genomics Hum. Genet. 2015;16:281–308. doi: 10.1146/annurev-genom-090314-025003. - DOI - PubMed
    1. Monaco AP, Bertelson CJ, Liechti-Gallati S, Moser H, Kunkel LM. An explanation for the phenotypic differences between patients bearing partial deletions of the DMD locus. Genomics. 1988;2:90–95. doi: 10.1016/0888-7543(88)90113-9. - DOI - PubMed
    1. Beggs AH, et al. Exploring the molecular basis for variability among patients with Becker muscular dystrophy: dystrophin gene and protein studies. Am. J. Hum. Genet. 1991;49:54–67. - PMC - PubMed

Publication types