

Parallels between DNA and collagen - comparing elastic models of the double and triple helix
- PMID: 29038480
- PMCID: PMC5643560
- DOI: 10.1038/s41598-017-12878-3
Parallels between DNA and collagen - comparing elastic models of the double and triple helix
Abstract
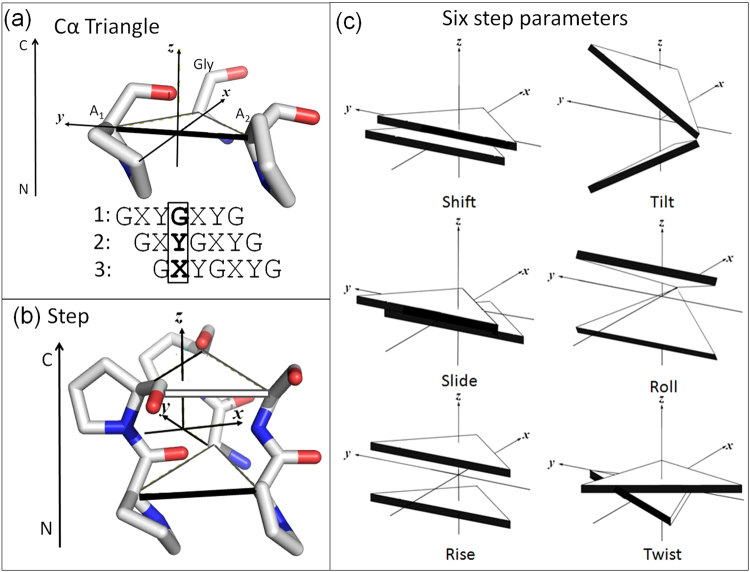
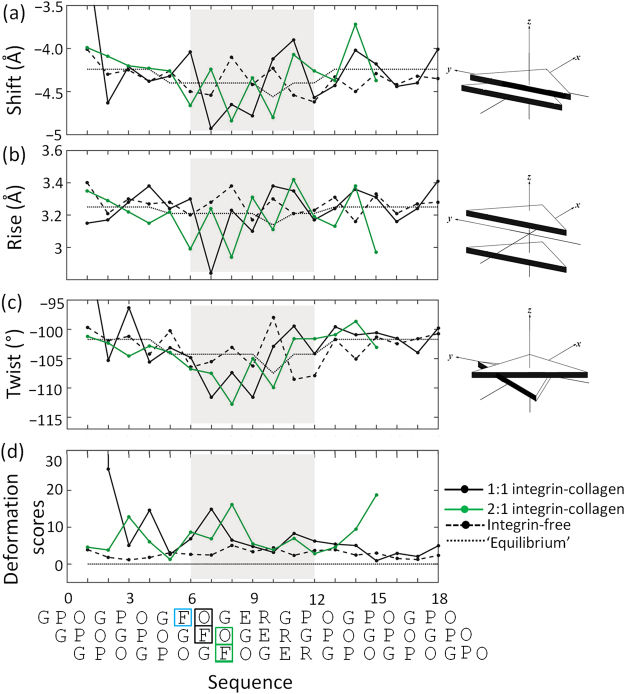
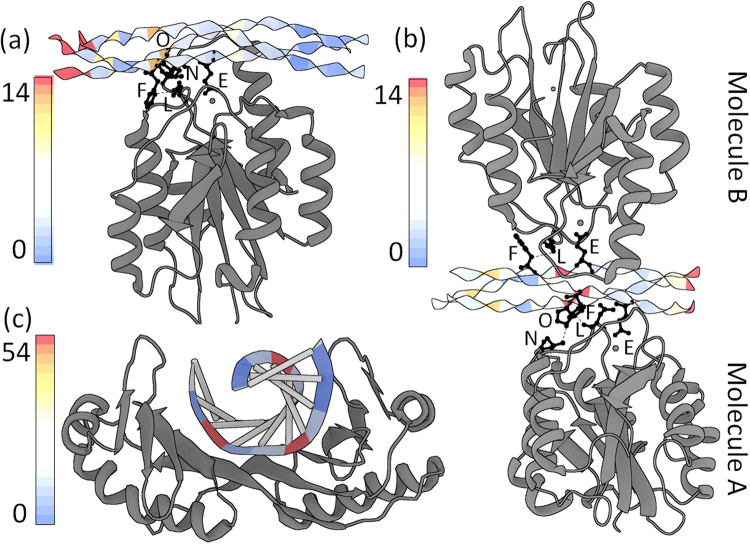
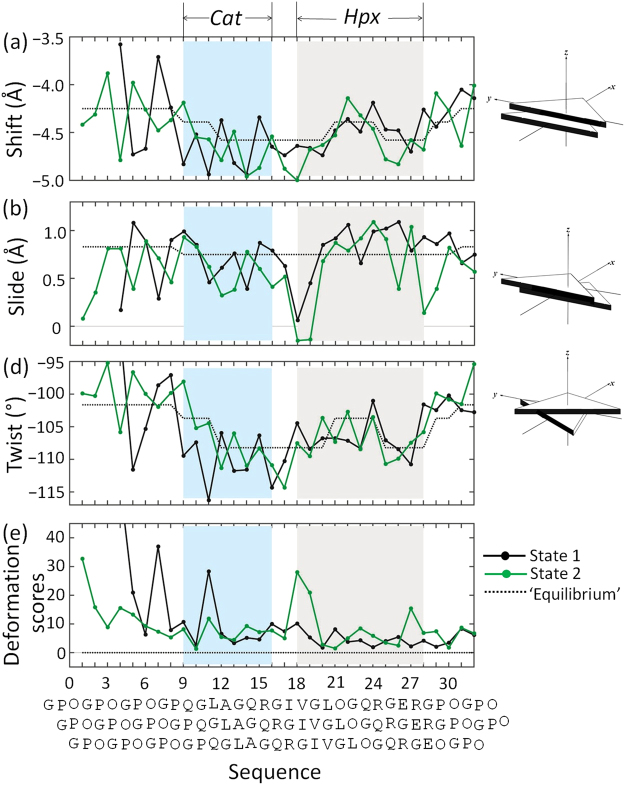
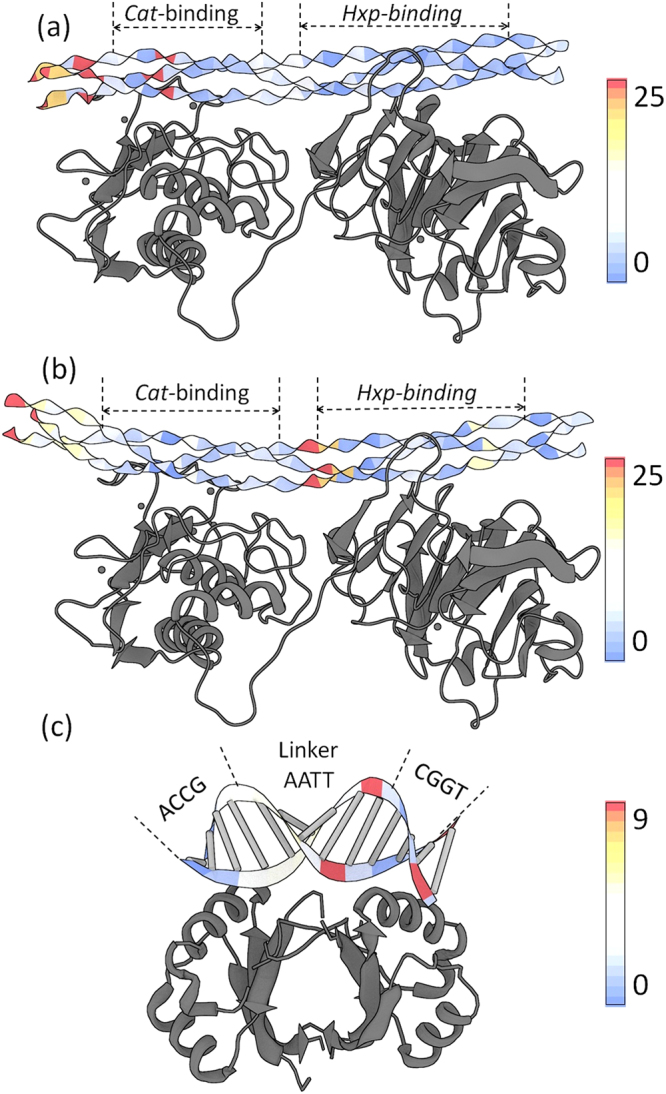
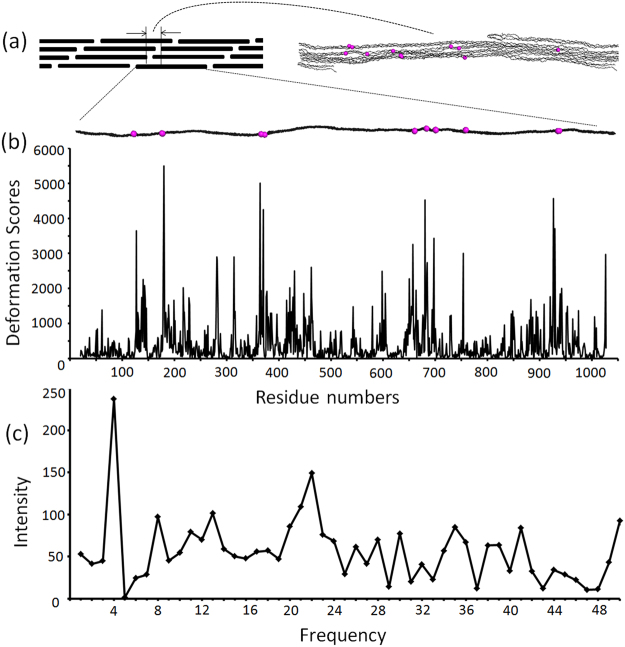
Multi-stranded helices are widespread in nature. The interplay of polymeric properties with biological function is seldom discussed. This study probes analogies between structural and mechanical properties of collagen and DNA. We modeled collagen with Eulerian rotational and translational parameters of adjacent rungs in the triple-helix ladder and developed statistical potentials by extracting the dispersion of the parameters from a database of atomic-resolution structures. The resulting elastic model provides a common quantitative way to describe collagen deformations upon interacting with integrins or matrix metalloproteinase and DNA deformations upon protein binding. On a larger scale, deformations in Type I collagen vary with a periodicity consistent with the D-periodic banding of higher-order fibers assemblies. This indicates that morphologies of natural higher-order collagen packing might be rooted in the characteristic deformation patterns.
Conflict of interest statement
The authors declare that they have no competing interests.
Figures
Similar articles
-
The energy of formation of internal loops in triple-helical collagen polypeptides.Biopolymers. 1995 Jun;35(6):607-19. doi: 10.1002/bip.360350607. Biopolymers. 1995. PMID: 7766826
-
Flexing and folding double helical DNA.Biophys Chem. 1995 Jun-Jul;55(1-2):7-29. doi: 10.1016/0301-4622(94)00139-b. Biophys Chem. 1995. PMID: 7632878
-
Complex between triple helix of collagen and double helix of DNA in aqueous solution.Int J Biol Macromol. 2005 Jun;35(5):243-5. doi: 10.1016/j.ijbiomac.2005.02.004. Epub 2005 Mar 19. Int J Biol Macromol. 2005. PMID: 15862862
-
Biophysical studies of matrix metalloproteinase/triple-helix complexes.Adv Protein Chem Struct Biol. 2014;97:37-48. doi: 10.1016/bs.apcsb.2014.09.001. Epub 2014 Nov 7. Adv Protein Chem Struct Biol. 2014. PMID: 25458354 Free PMC article. Review.
-
Molecular structure of the collagen triple helix.Adv Protein Chem. 2005;70:301-39. doi: 10.1016/S0065-3233(05)70009-7. Adv Protein Chem. 2005. PMID: 15837519 Review.
Cited by
-
Environmentally Controlled Curvature of Single Collagen Proteins.Biophys J. 2018 Oct 16;115(8):1457-1469. doi: 10.1016/j.bpj.2018.09.003. Epub 2018 Sep 13. Biophys J. 2018. PMID: 30269884 Free PMC article.
-
A Collagen Triple Helix without the Superhelical Twist.ACS Cent Sci. 2025 Feb 4;11(2):331-345. doi: 10.1021/acscentsci.5c00018. eCollection 2025 Feb 26. ACS Cent Sci. 2025. PMID: 40028357 Free PMC article.
-
Stability of collagen heterotrimer with same charge pattern and different charged residue identities.Biophys J. 2023 Jul 11;122(13):2686-2695. doi: 10.1016/j.bpj.2023.05.023. Epub 2023 May 23. Biophys J. 2023. PMID: 37226442 Free PMC article.
-
Real-time single-molecule observation of incipient collagen fibrillogenesis and remodeling.Proc Natl Acad Sci U S A. 2024 Aug 13;121(33):e2401133121. doi: 10.1073/pnas.2401133121. Epub 2024 Aug 5. Proc Natl Acad Sci U S A. 2024. PMID: 39102538 Free PMC article.
-
How electrostatic networks modulate specificity and stability of collagen.Proc Natl Acad Sci U S A. 2018 Jun 12;115(24):6207-6212. doi: 10.1073/pnas.1802171115. Epub 2018 May 29. Proc Natl Acad Sci U S A. 2018. PMID: 29844169 Free PMC article.
References
Publication types
MeSH terms
Substances
Grants and funding
LinkOut - more resources
Full Text Sources
Other Literature Sources
