. 2017 Oct 16;7(1):13211.
doi: 10.1038/s41598-017-13581-z.

Quantitative microglia analyses reveal diverse morphologic responses in the rat cortex after diffuse brain injury

Affiliations

Quantitative microglia analyses reveal diverse morphologic responses in the rat cortex after diffuse brain injury

Helena Morrison et al. Sci Rep. .

Abstract

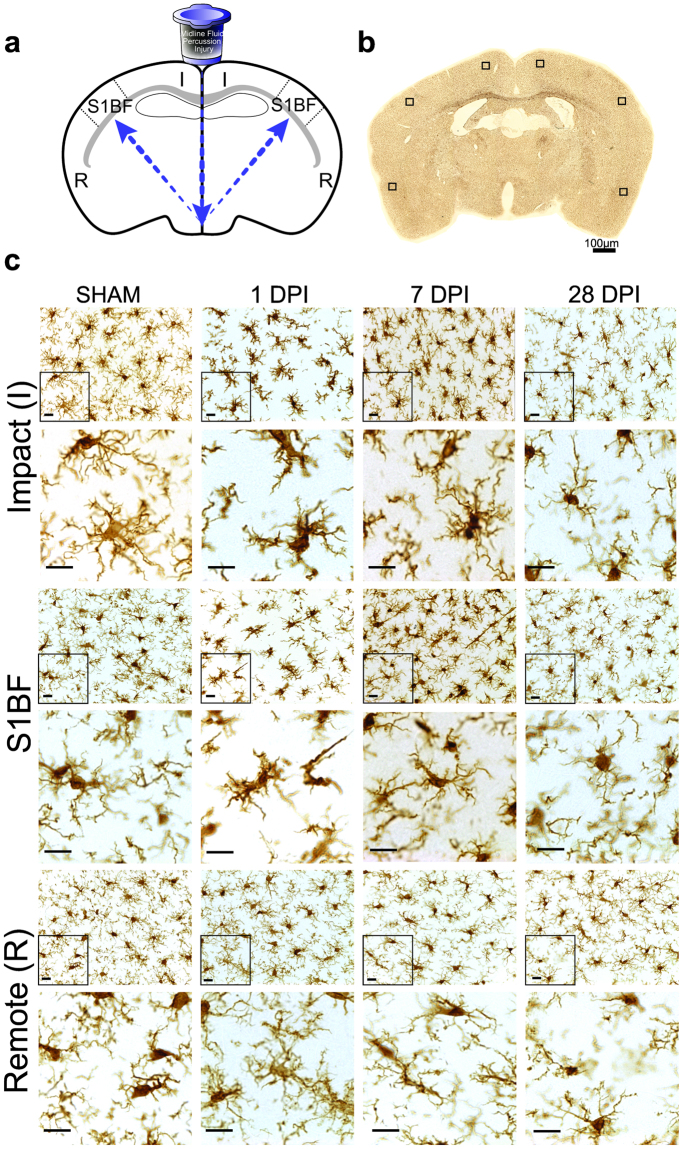
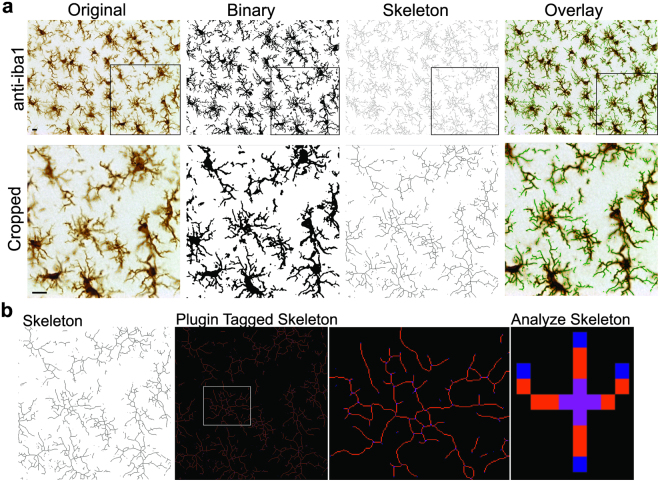
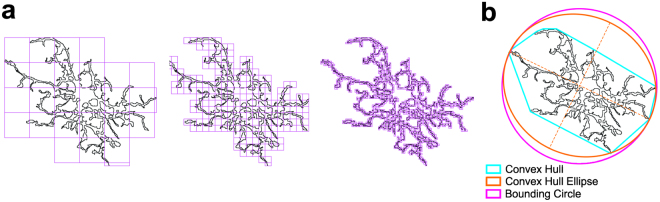
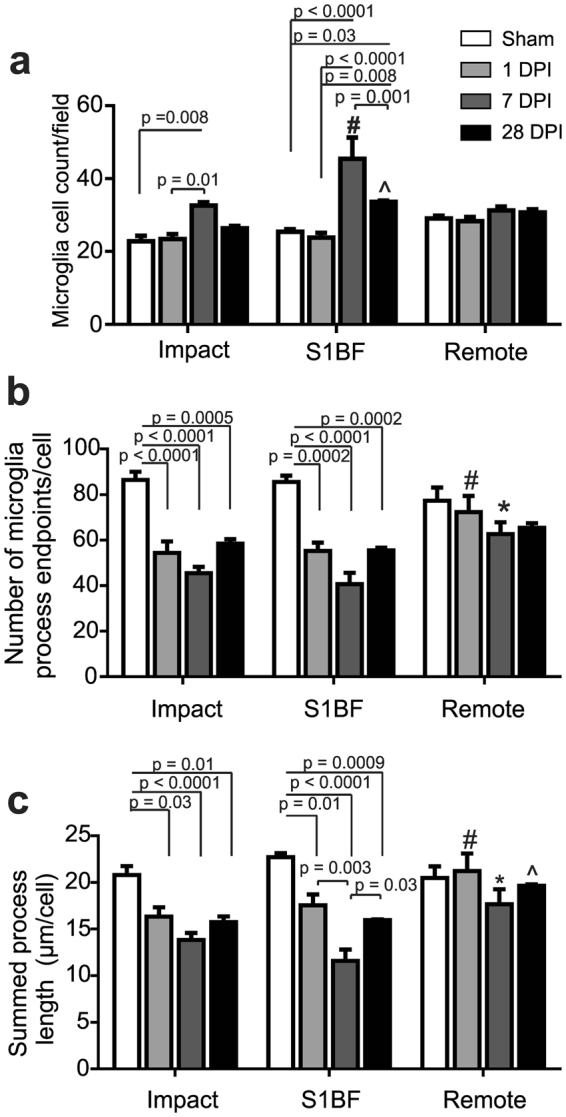
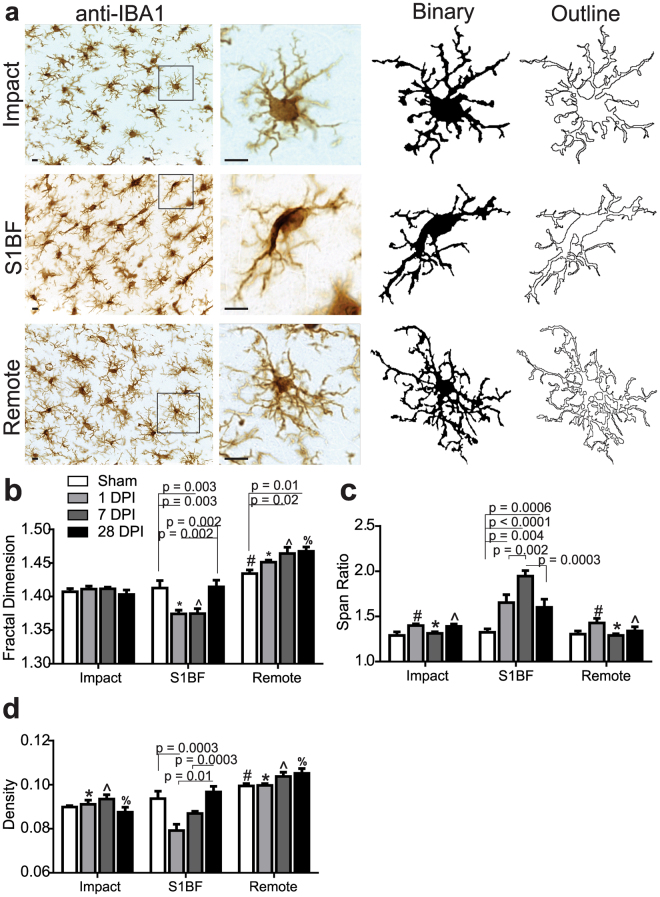
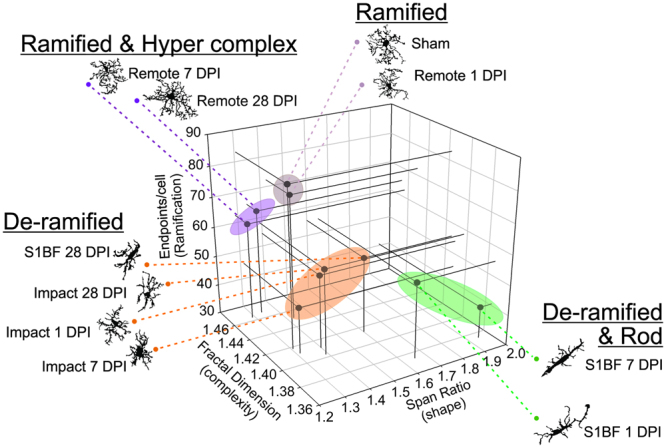
Determining regions of altered brain physiology after diffuse brain injury is challenging. Microglia, brain immune cells with ramified and dynamically moving processes, constantly surveil the parenchyma for dysfunction which, when present, results in a changed morphology. Our purpose was to define the spatiotemporal changes in microglia morphology over 28 days following rat midline fluid percussion injury (mFPI) as a first step in exploiting microglia morphology to reflect altered brain physiology. Microglia morphology was quantified from histological sections using Image J skeleton and fractal analysis procedures at three time points and in three regions post-mFPI: impact site, primary somatosensory cortex barrel field (S1BF), and a remote region. Microglia ramification (process length/cell and endpoints/cell) decreased in the impact and S1BF but not the remote region (p < 0.05). Microglia complexity was decreased in the S1BF (p = 0.003) and increased in the remote region (p < 0.02). Rod-shaped microglia were present in the S1BF and had a 1.8:1.0 length:width ratio. An in-depth quantitative morphologic analysis revealed diverse and widespread changes to microglia morphology in the cortex post-mFPI. Due to their close link to neuronal function, changes in microglia morphology, summarized in this study, likely reflect altered physiology with diverse and widespread impact on neuronal and circuit function.


Conflict of interest statement

The authors declare that they have no competing interests.

Figures

Figure 1
Figure 1
Iba1 stained microglia in cortex regions after midline experimental diffuse brain injury and days of recovery. (a) Schematic drawing depicting the midline fluid percussion injury (mFPI) delivered to animals and the brain regions (impact, somatosensory barrel field [S1BF], and remote) imaged within cortical layers I-III. The arrows illustrate the percussive force delivered by the mFPI model. (b) Approximate imaging regions per histological section. (c) Iba1 immunostaining of impact, S1BF, and remote brain regions in sham animals and 1, 7, and 28 days post-injury (DPI). Cropped photomicrographs corresponding to the highlighted square are provided to show microglia morphology detail. All quantitative skeleton analysis was carried out on full sized photomicrographs while fractal analysis was carried out on single cells. (Scale bars = 10 µm unless otherwise noted).
Figure 2
Figure 2
Skeleton analysis of microglia morphologies in Iba1 stained tissue. (a) The process to prepare photomicrographs for skeleton analysis. Original photomicrographs were subjected to a series of uniform ImageJ plugin protocols prior to conversion to binary images; binary images were then skeletonized. An overlay of a resulting skeletonized image (in green) and original photomicrograph shows the relationship between skeleton and photomicrograph. Cropped photomicrographs (below) show additional detail and all skeleton analysis was completed on full sized photomicrographs (Scale bar = 10 µm). (b) The skeletonized images are processed using the Analyze Skeleton plugin (maintained here: http://imagej.net/AnalyzeSkeleton) to identify and tag skeletonized processes as orange, endpoints as blue, and junctions as purple. The tagged data are then organized and data output summarized.
Figure 3
Figure 3
FracLac for ImageJ to quantify cell complexity and shape. (a) Illustration of FracLac box counting method to derive fractal dimension calculations of a microglia outline. Shape detail is quantified as scale increases, represented by pink boxes. Box counting equation is summarized in Table 1. (b) Schematic of the convex hull (blue), bounding circle (pink) and convex hull ellipse (orange) with accompanying longest length and width (dashed lines) necessary for calculating microglia span ratio and density (Table 1).
Figure 4
Figure 4
Microglia ramification is different in brain regions following experimental diffuse brain injury. (a) Summary data (mean and SEM) and statistical analysis (two-way ANOVA) of microglia cell counts/field in brain regions following diffuse brain injury (image n = 6/group, animal n = 3/group). At 1, 7, and 28 days post-injury (DPI), microglia counts are higher than sham within regions (F(2,24) = 9.07, p = 0.001) and with time (F(3,24) = 21.50, p < 0.0001) with significant interaction (F(6,24) = 5.08, p = 0.002). Post-hoc analyses are reported within the figure (# p = 0.003 vs impact and ^ p < 0.003 vs. remote). (b) Summary data and statistical analysis of microglia endpoints/cell at 1, 7, and 28 DPI (n = 3/group). The number of microglia endpoints/cell is different than sham after mFPI (F(3,24) = 33.67, p < 0.0001). There are fewer endpoint/cell in the impact and S1BF regions at all DPI, but not at the remote region (post hoc are summarized in figure). The number of endpoints/cell was also different among brain regions at time points (F(2,24) = 6.56, p = 0.005) with post-hoc analysis reported in figure (1DPI ^ p < 0.05 vs S1BF and Impact; 7DPI # p < 0.05 vs Impact and S1BF). There was a significant interaction effect (F(6,24) 3.17, p = 0.02) c). Summary data and statistical analysis of microglia process length/cell in brain regions at 1, 7, and 28 DPI (n = 3/group). Summed process length is different than sham in the days following mFPI (F(3,24) 21.78, p < 0.0001). Process length is decreased at all DPI in the impact and S1BF regions, but not the remote region (post hoc analyses are summarized in the figure). Microglia process length/cell was also different among brain regions at time points (F(2,24) 9.99, p = 0.0007) with post hoc analysis reported in figure (1DPI ^ p < 0.05 vs S1BF and Impact; 7DPI # p < 0.05 vs Impact and S1BF; 28DPI ^ p = 0.04 vs Impact). There was a significant interaction effect (F(6,24) = 3.07, p = 0.02).
Figure 5
Figure 5
Microglia complexity, elongation, and size are different in brain regions following experimental diffuse brain injury. (a) Example photomicrographs and cell outlines of Iba1/DAB microglia in impact, S1BF, and remote regions; scale bar = 10 µm. (b) Summary data and statistical analysis of fractal dimension at 1, 7, and 28 DPI. Microglia fractal dimension was different than sham post-mFPI within brain regions (F(3,24) = 2.99, p = 0.05), decreased in the S1BF region after 1 DPI and 7 DPI, and increased in the remote region at 7 and 28 DPI. Microglia fractal dimension was also different according to time (F(2,24) = 84.07, p < 0.0001). There was a significant interaction effect (F(6,24) = 5.53, p = 0.0001). All post-hoc analyses are reported in the figure (Sham: # p < 0.01; 1DPI: * p < 0.05 vs impact and S1BF; 7DPI: ^ p < 0.05 vs Impact and S1BF; 28DPI: % p < 0.05 vs Impact and S1BF). c) Summary data and statistical analysis of span ratio at 1, 7, and 28 DPI. Microglia span ratio was different than sham within brain regions in the days following mFPI (F(3,24) = 10.43, p < 0.0001), elongated in the S1BF region after 1, 7 and 28 DPI. Microglia span ratio was also different between brain regions (F(2,24) = 43.15, p < 0.0001). All post hoc analyses are reported in the figure (1DPI: # p < 0.05 vs S1BF; 7DPI: * p < 0.0001 vs S1BF; 28 DPI: ^ p = 0.05 vs S1BF). There was a significant interaction effect after mFPI (F(6,24) = 8.9, p < 0.0001). (d) Summary data and statistical analysis of density at 1, 7, and 28 DPI. Microglia density was different than sham within brain regions after mFPI (F(3,24) = 5.28, p = 0.006). Microglia density was decreased when in the S1BF region at 1 DPI when compared to sham but increased at 28 DPI. Microglia density was also different between brain regions (F(2,24) = 46.54, p < 0.0001). There was a significant interaction effect after mFPI (F(6,24) = 6.11, p = 0.0005). All post hoc analysis reported in figure (Sham: # p < 0.01; 1DPI: * p < 0.05 vs S1BF and Remote; 7DPI: ^ p < 0.01 vs S1BF and Remote; 28DPI: % p < 0.05 vs S1BF and Remote). All data are mean ± SEM with two-way ANOVA analysis.
Figure 6
Figure 6
Diverse microglia morphologies in the days following diffuse brain injury. Fractal dimension (Db), endpoints/cell, and span ratio data were averaged for each region and time for Pearson’s correlation (n = 10). The figure summarizes the relationship between all three variables with exemplars of microglia for data points. Fractal dimension (DB) is inversely related to span ratio (r = −0.69, p = 0.03) (r = 0.55, p = 0.10); endpoints/cell is not significantly correlated to span ratio (r = 0.58, p = 0.08). Four groupings emerge: Ramified, ramified and hyper-complex, de-ramified and de-ramified and rod. Fractal dimension was inversely related to span ratio but not endpoints/cell.

Similar articles

Cited by

References

    1. Centers for Disease Control and Prevention. Report to Congress on Traumatic Brain Injury In the United States: Epidemiology and Rehabilitation. (National Center for Injury Prevention and Control; Division of Unintentional Injury Prevention. Atlanta, GA) (2015).
    1. Leo, P. & McCrea, M. Frontiers in Neuroscience: Epidemiology. In Translational Research in Traumatic Brain Injury (eds Laskowitz, D. & Grant, G.) (CRC Press/Taylor and Francis Group, Boca Raton (FL), 2016). - PubMed
    1. LaPlaca MC, Simon CM, Prado GR, Cullen DK. CNS injury biomechanics and experimental models. Prog Brain Res. 2007;161:13–26. doi: 10.1016/S0079-6123(06)61002-9. - DOI - PubMed
    1. Wolf JA, Stys PK, Lusardi T, Meaney D, Smith DH. Traumatic axonal injury induces calcium influx modulated by tetrodotoxin-sensitive sodium channels. J Neurosci. 2001;21:1923–1930. - PMC - PubMed
    1. Barkhoudarian G, Hovda DA, Giza CC. The Molecular Pathophysiology of Concussive Brain Injury - an Update. Phys Med Rehabil Clin N Am. 2016;27:373–393. doi: 10.1016/j.pmr.2016.01.003. - DOI - PubMed

Publication types

LinkOut - more resources