. 2017 Oct 16;7(1):13302.
doi: 10.1038/s41598-017-13440-x.

MCM2-regulated functional networks in lung cancer by multi-dimensional proteomic approach

Affiliations

MCM2-regulated functional networks in lung cancer by multi-dimensional proteomic approach

Chantal Hoi Yin Cheung et al. Sci Rep. .

Abstract

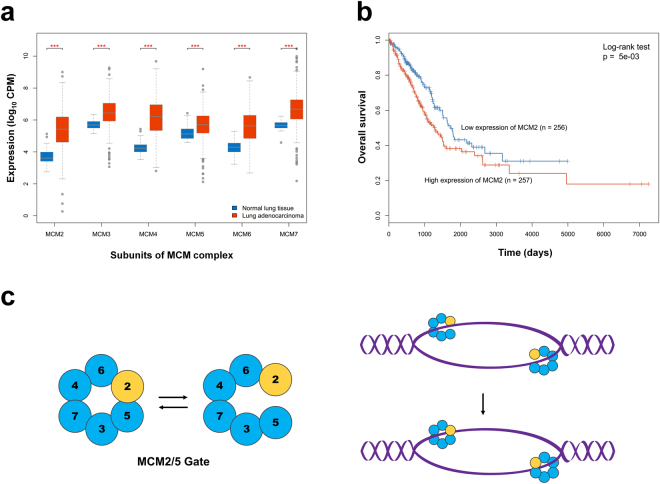
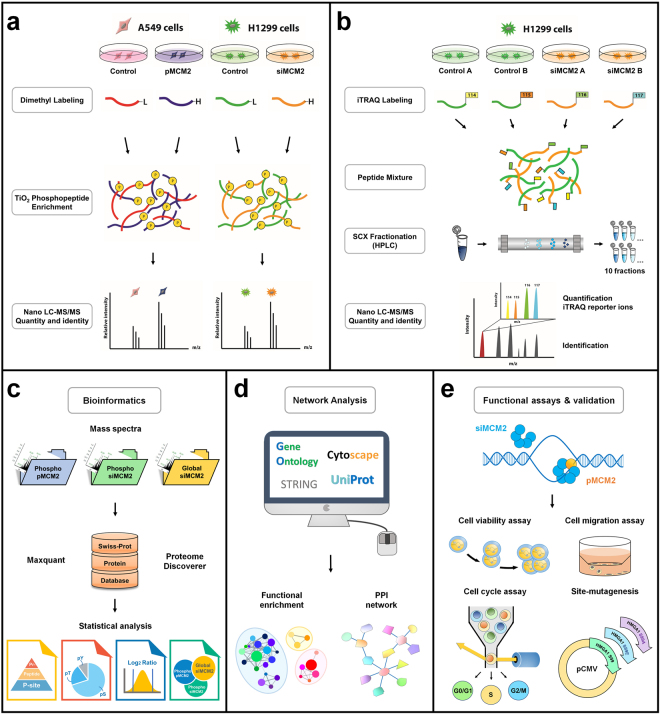
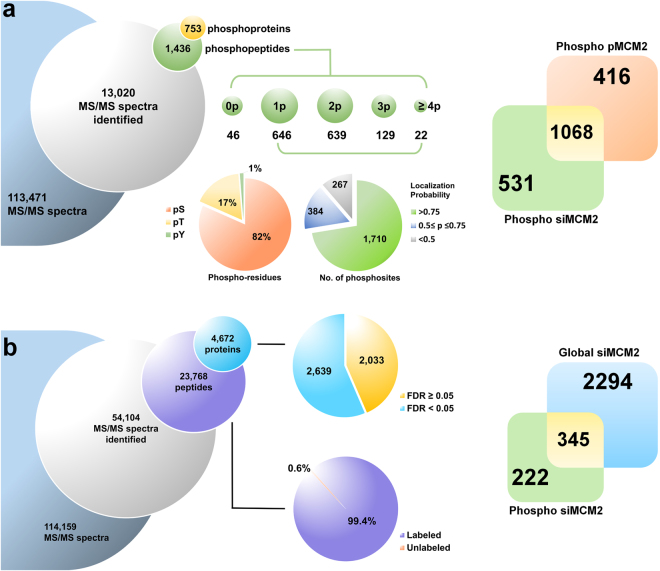
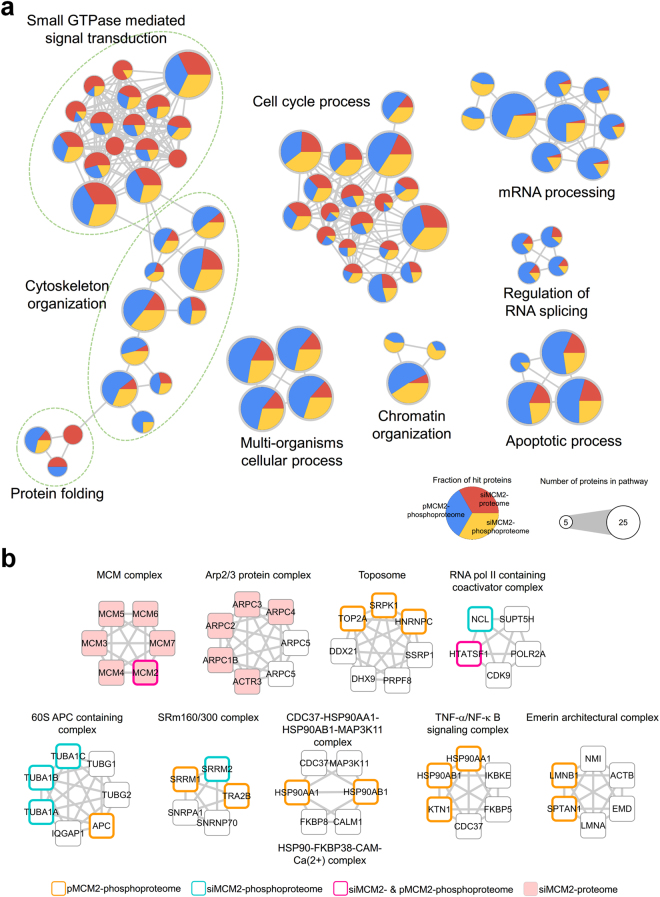
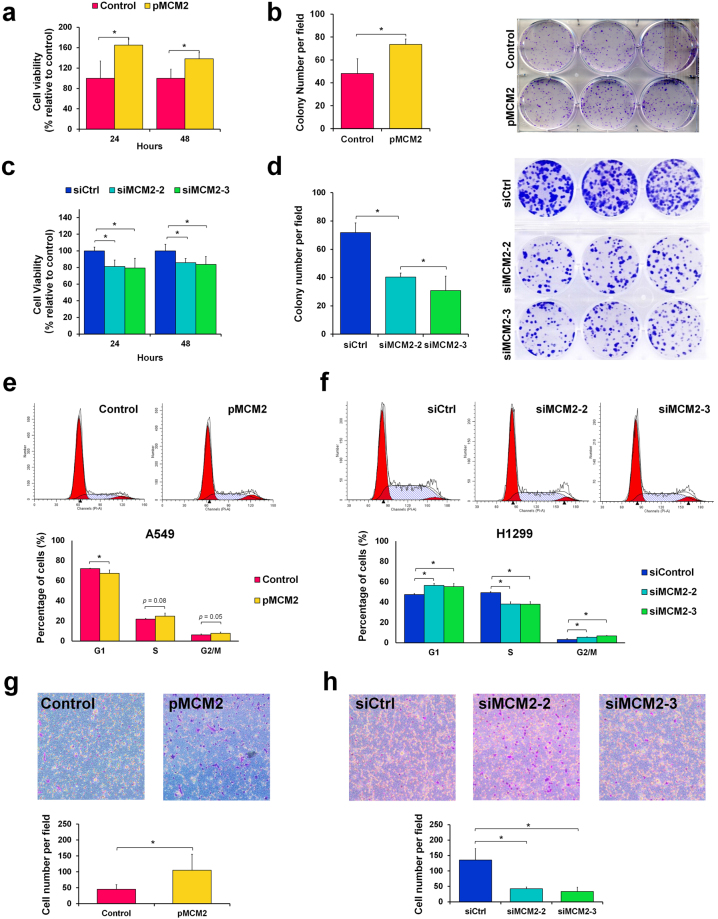
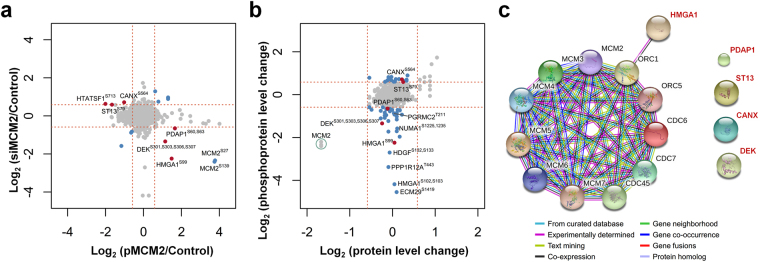
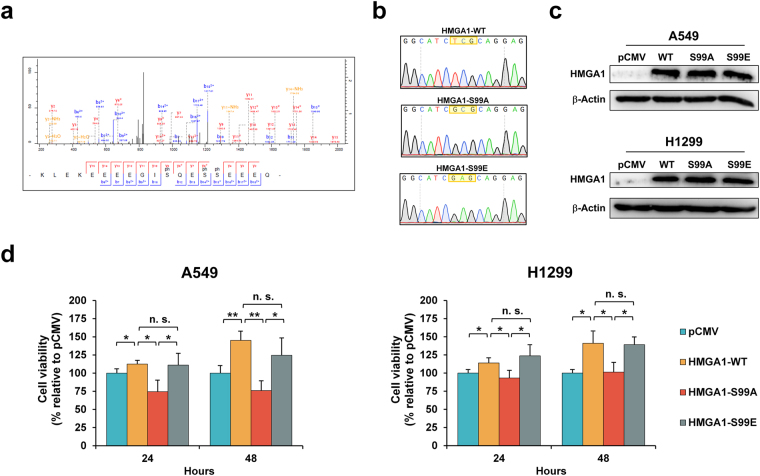
DNA replication control is vital for maintaining genome stability and the cell cycle, perhaps most notably during cell division. Malignancies often exhibit defective minichromosome maintenance protein 2 (MCM2), a cancer proliferation biomarker that serves as a licensing factor in the initiation of DNA replication. MCM2 is also known to be one of the ATPase active sites that facilitates conformational changes and drives DNA unwinding at the origin of DNA replication. However, the biological networks of MCM2 in lung cancer cells via protein phosphorylation remain unmapped. The RNA-seq datasets from The Cancer Genome Atlas (TCGA) revealed that MCM2 overexpression is correlated with poor survival rate in lung cancer patients. To uncover MCM2-regulated functional networks in lung cancer, we performed multi-dimensional proteomic approach by integrating analysis of the phosphoproteome and proteome, and identified a total of 2361 phosphorylation sites on 753 phosphoproteins, and 4672 proteins. We found that the deregulation of MCM2 is involved in lung cancer cell proliferation, the cell cycle, and migration. Furthermore, HMGA1S99 phosphorylation was found to be differentially expressed under MCM2 perturbation in opposite directions, and plays an important role in regulating lung cancer cell proliferation. This study therefore enhances our capacity to therapeutically target cancer-specific phosphoproteins.


Conflict of interest statement

The authors declare that they have no competing interests.

Figures

Figure 1
Figure 1
MCM gene expression in lung adenocarcinoma. (a) Expression levels of six MCM complex genes (MCM2-7) in normal lung tissue and lung adenocarcinoma. Each gene is represented by two mean values derived from its expression in 59 normal (blue) and 515 lung adenocarcinoma (red) samples. CPM: counts per million; ***p < 0.001. (b) Kaplan-Meier plots showing overall survival rates for lung adenocarcinoma in two groups separated according to levels of MCM2 expression: high (red) and low (blue). (c) Schematic presentation of the regulation of MCM2/5 gate conformation, which restrains DNA synthesis and activates the MCM2-7 complex to encircle the DNA.
Figure 2
Figure 2
Overall workflow for integrated profiling of the phosphoproteome and global proteome regulated by MCM2 in non-small cell lung cancer cells. (a) Experimental strategy for quantitative phosphoproteomic profiling in response to overexpression of MCM2 (pMCM2) in A549 cells and silencing of MCM2 (siMCM2) in H1299 cells. Protein extracts obtained from the transfected cells were digested, dimethyl labeled, phosphopeptide enriched, and analyzed with mass spectrometry. (b) Experimental strategy for quantitative global proteomic profiling in response to siMCM2 in H1299 cells. Protein extracts obtained from the transfected cells were digested, iTRAQ labeled, SCX fractionated, and analyzed with mass spectrometry. (c) MCM2 phosphoproteomic and global proteomic mass spectra were identified and quantified using MaxQuant or Proteome Discoverer and analyzed using a bioinformatics strategy. (d) Construction of functional network and protein-protein interaction from differentially expressed phosphoproteins and proteins. (e) MCM2-perturbed biological processes in lung cancer cells were validated by functional assays, and the protein of interest was further investigated by site-directed mutagenesis.
Figure 3
Figure 3
Quantitative phosphoproteome and global proteome profiling of MCM2 overexpression and silencing in lung cancer cells. (a) Quantitation and identification of the phosphoproteome of lung cancer cells in response to siMCM2 and pMCM2 in A549 and H1299 cells. Venn diagram illustrating the overlap in the sets of phosphoproteins. (b) Quantitation and identification of the global proteome of lung cancer cells in response to siMCM2 in H1299 cells. Venn diagram illustrating the overlap in the set of siMCM2 phosphoproteins with that of the siMCM2 global proteome.
Figure 4
Figure 4
Functional networks of MCM2-regulated phosphoproteins. (a) Functional enrichment analysis of proteins with differential expression under MCM2 silencing (red) and proteins with differential change in phosphorylation levels under MCM2 overexpression (blue) or silencing (yellow). According to corrected p-value < 0.05, 76 over-represented GO terms were identified. (b) Ten protein complexes that are over-represented in response to MCM were obtained from CORUM. Variable protein members of the complex are colored depending on the phosphoproteomic or global proteomic profiles.
Figure 5
Figure 5
MCM2 regulates cell proliferation, the cell cycle via G1/S phase arrest, and cell migration in lung cancer cells. (a) Overexpression of MCM2 (pMCM2) enhanced cell proliferation at 24 h and 48 h post-transfection, as assessed by MTT assay. (b) The effects of MCM2 overexpression on colony formation in A549 cells transfected with MCM2, compared with the control. MCM2-overexpressing A549 cells exhibited a significant (53%) increase in colony formation activity. (c) Silencing of MCM2 (siMCM2-2 and siMCM2-3) repressed cell proliferation at 24 h and 48 h post-transfection, as assessed by MTS assay. (d) MCM2-silenced H1299 cells exhibited a significant decrease in colony formation activity: 44% (siMCM2-2) and 57% (siMCM2-3). (e) Overexpression of MCM2 in A549 cells interrupt the cell cycle process in the G1 phase. A549 cells were transfected with pMCM2 or pcDNA3.1(+) control for DNA content analysis using FASC. The abundance of MCM2-overexpressed A549 cells in the G1 phase decreased and that of cells in the S phase and G2/M phase slightly increased. (f) Silencing of MCM2 in H1299 cells induced cell cycle arrest at the G1/S phase. H1299 cells were transfected with MCM2-siRNA (siMCM2-2 and siMCM2-3) or control-siRNA. The abundance of siMCM2-silenced H1299 cells in the G1 phase increased and that of cells in the S phase decreased. An accumulation of cells in the G2/M phase was also observed in MCM2-silenced cells. (g) Overexpression of MCM2 promotes cell migration, as shown by Transwell migration assays. Microscopic image of crystal violet staining and bar plot showing that A549 cells transfected with pMCM2 had a greater migratory ability than the pcDNA3.1(+) control. (g) Silencing of MCM2 in the H1299 cell line represses cell migration. Microscopic image of crystal violet staining and bar plot showing that H1299 cells transfected with MCM2-siRNA had a lower migratory ability than the siRNA control. *p < 0.05.
Figure 6
Figure 6
Identification of MCM2-associated phosphoprotein HMGA1. (a) Comparison of phosphoprotein expression ratios with specific phosphorylation sites from the MCM2 overexpression and silencing phosphoproteomic profiles for two lung cancer cell lines. Phosphoproteins with specific sites that were significantly up- or down- regulated, with at least a 1.5-fold change in opposite directions in the pMCM2 and siMCM2 phosphoproteomes are represented in red. (b) Comparison of changes in protein abundance from the global siMCM2 proteome with changes in phosphoprotein expression ratios from the siMCM2 phosphoproteome in lung cancer cells. Phosphoproteins that were significantly up- or down- regulated by siMCM2 but with no change in protein abundance from the proteome are represented in blue. The phosphoproteins with specific phosphorylation sites that changed in opposite directions in the pMCM2 and siMCM2 phosphoproteomic profiles, without changes in protein abundance, are represented in red. (c) The network predicted a functional association between HMGA1 and the MCM complex. Five MCM2-associated phosphoproteins (HMGA1, PDAP1, DEK, ST13, and CANX) and components of MCM complex are used as seeds to construct a functional association network via STRING.
Figure 7
Figure 7
Phosphorylation of HMGA1 at Ser99 is involved in lung cancer cell proliferation. (a) Fragmentation spectrum for modified HMGA1 (High Mobility Group Protein HMG-I/HMG-Y) peptide, showing the phosphorylated serine residue 99. (b) Electropherogram representation of genomic DNA fragments from HMGA1S99 wild-type (top), the HMGA1S99A mutant (middle) and HMGA1S99E mutant (bottom), the positions of the mutations are indicated by yellow square. (c) Western blot showing the total HMGA1 protein expression of A549 and H1299 cells 48 h after transfection of pCMV vector (pCMV), HMGA1 wild-type (WT), HMGA1 S99A mutants (S99A), and HMGA1S99E mutants (S99E). (d) Proliferation of A549 cells and H1299 under the overexpression of proteins HMGA1 wild-type (WT), HMGA1S99A mutants (S99A), and HMGA1S99E mutants (S99E), as assessed by MTS. Overexpression of HMGA1 wild-type and HMGA1S99A mutants promoted A549 and H1299 cell proliferation at 24 h and 48 h post-transfection, whereas the non-phosphorylatable HMGA1S99A mutant repressed A549 and H1299 cell proliferation at 24 h and 48 h post-transfection (*p < 0.05; **p < 0.01).

Similar articles

Cited by

References

    1. Siegel RL, Miller KD, Jemal A. Cancer statistics, 2016. CA Cancer J Clin. 2016;66:7–30. doi: 10.3322/caac.21332. - DOI - PubMed
    1. Crino L, Weder W, van Meerbeeck J, Felip E, Group EGW. Early stage and locally advanced (non-metastatic) non-small-cell lung cancer: ESMO Clinical Practice Guidelines for diagnosis, treatment and follow-up. Ann Oncol. 2010;21(Suppl 5):v103–115. doi: 10.1093/annonc/mdq207. - DOI - PubMed
    1. Cheung CHY, Juan HF. Quantitative proteomics in lung cancer. J Biomed Sci. 2017;24:37. doi: 10.1186/s12929-017-0343-y. - DOI - PMC - PubMed
    1. Croce CM. Oncogenes and cancer. N Engl J Med. 2008;358:502–511. doi: 10.1056/NEJMra072367. - DOI - PubMed
    1. Collins K, Jacks T, Pavletich NP. The cell cycle and cancer. Proc Natl Acad Sci USA. 1997;94:2776–2778. doi: 10.1073/pnas.94.7.2776. - DOI - PMC - PubMed

Publication types

MeSH terms