. 2017 Oct 16;8(1):837.
doi: 10.1038/s41467-017-00796-x.

Gastric acid suppression promotes alcoholic liver disease by inducing overgrowth of intestinal Enterococcus

Affiliations

Gastric acid suppression promotes alcoholic liver disease by inducing overgrowth of intestinal Enterococcus

Cristina Llorente et al. Nat Commun. .

Erratum in

Abstract

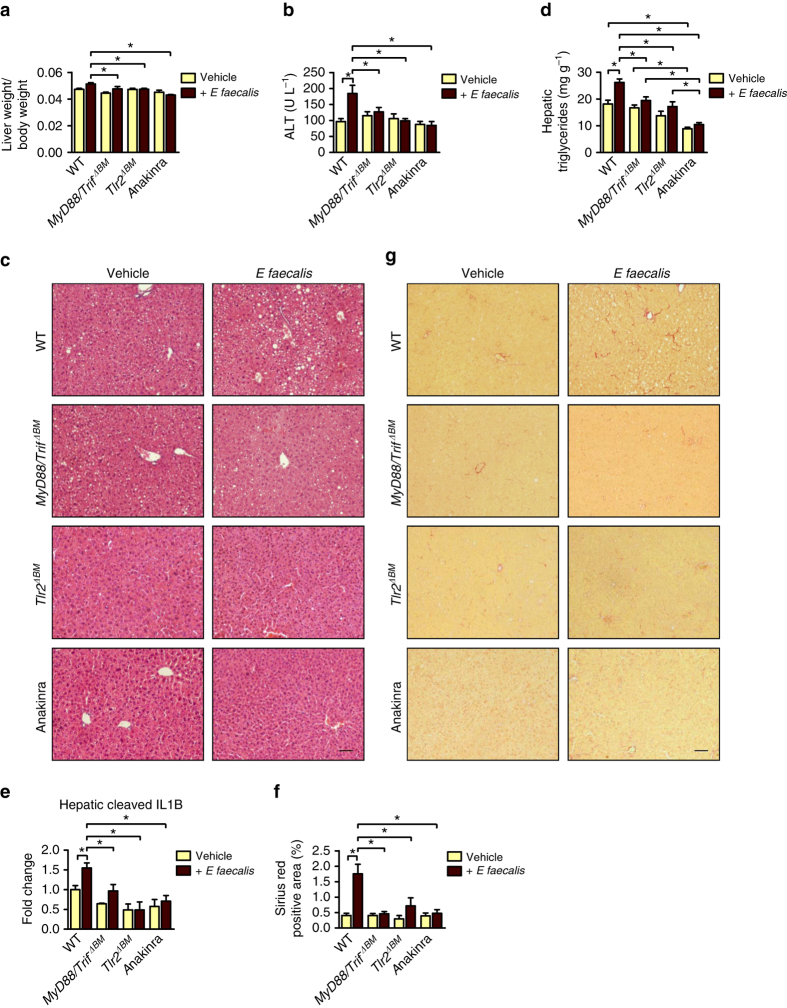
Chronic liver disease is rising in western countries and liver cirrhosis is the 12th leading cause of death worldwide. Simultaneously, use of gastric acid suppressive medications is increasing. Here, we show that proton pump inhibitors promote progression of alcoholic liver disease, non-alcoholic fatty liver disease, and non-alcoholic steatohepatitis in mice by increasing numbers of intestinal Enterococcus spp. Translocating enterococci lead to hepatic inflammation and hepatocyte death. Expansion of intestinal Enterococcus faecalis is sufficient to exacerbate ethanol-induced liver disease in mice. Proton pump inhibitor use increases the risk of developing alcoholic liver disease among alcohol-dependent patients. Reduction of gastric acid secretion therefore appears to promote overgrowth of intestinal Enterococcus, which promotes liver disease, based on data from mouse models and humans. Recent increases in the use of gastric acid-suppressive medications might contribute to the increasing incidence of chronic liver disease.Proton pump inhibitors (PPIs) reduce gastric acid secretion and modulate gut microbiota composition. Here Llorente et al. show that PPIs induce bacterial overgrowth of enterococci, which, in turn, exacerbate ethanol-induced liver disease both in mice and humans.


Conflict of interest statement

The authors declare no competing financial interests.

Figures

Fig. 1
Fig. 1
Genetic deletion of gastric acid secretion exacerbates alcohol-induced liver disease in mice. ah WT mice and their Atp4aSl/Sl littermates were fed an oral control diet (n = 3–8; 2–3 replicates) or ethanol diet (n = 6–16; 8–9 replicates) for 9 weeks following the chronic Lieber DeCarli diet model. a Plasma levels of ALT. b Representative liver sections after hematoxylin and eosin staining. c Hepatic triglyceride content. d Hepatic expression of cleaved IL1B protein (n = 2–5). e Hepatic areas of fibrosis were identified by staining with Sirius red (n = 2–6); area was quantitated by image analysis software. f Representative Sirius red-stained liver sections. g Total bacteria in feces (left panel). Fecal enterococci (mid panel). Principal component analysis of fecal microbiomes, performed using the ade4 R package (right panel). h Enterococcus in mesenteric lymph nodes (MLN) and liver, assessed by qPCR. i Proportions of positive Enterococcus cultures from liver tissues of WT mice (n = 6) and their Atp4aSl/Sl littermates (n = 11) subjected to chronic-plus-binge ethanol feeding. Results are expressed as mean ± s.e.m. Scale bars = 100 μm. For a, c, d, e, g, h significance was evaluated using the unpaired Student t-test or Mann–Whitney U-statistic test. For i, significance was evaluated using Fisher’s exact test.*P < 0.05
Fig. 2
Fig. 2
NAFLD is increased in Atp4aSl/Sl mice. WT mice and their Atp4aSl/Sl littermates were fed a regular chow (RC) diet (n = 5–8; 2–3 replicates) or a HFD (n = 6–15; 3–6 replicates) for 9 weeks. a Body weight and weight of white epididymal fat. b Hepatic triglyceride content and hepatic steatosis visualized with Oil Red O staining and quantified by image analysis software (n = 5–10). Scale bar = 100 μm. c Representative Oil Red O-stained liver sections. d Insulin tolerance test (ITT) (n = 5–10). ef Representative liver sections of F4/80 immunofluorescence staining; the positively stained area was quantified by image analysis software (n = 3–6). Scale bar = 50 μm. g Hepatic levels of cleaved IL1B (n = 2–5). h Hepatic expression of mRNA encoding Col1a1. i Total bacteria, Enterococcus, E. coli, and Prevotella in fecal samples, measured by qPCR. Changes in fecal numbers of E. coli and Prevotella did not differ significantly between Atp4aSl/Sl mice fed a HFD vs. WT mice fed a HFD (n = 5–10). Atp4aSl/Sl mice fed a HFD had significantly higher numbers in Enterococcus than WT mice fed a HFD. Results are expressed as mean ± s.e.m. For a, b, d, e, g, h, i significance was evaluated using the unpaired Student t-test or Mann–Whitney U-statistic test. *P < 0.05
Fig. 3
Fig. 3
Exacerbated NASH in Atp4aSl/Sl mice. WT mice and their Atp4aSl/Sl littermates were fed a CSAA (control, n = 4–9; 1–3 replicates) or CDAA diet (n = 10–12; 4–5 replicates) for 20 weeks. a Ratio of liver to body weight was significantly higher in CDAA-fed Atp4aSl/Sl mice than CDAA-fed WT mice, b as was mean plasma level of ALT. c Representative liver sections, stained with hematoxylin and eosin. d Hepatic triglyceride content. The Oil Red O-stained area was quantified by image analysis (n = 5–12). e Representative Oil Red O-stained liver sections. f Hepatic expression of mRNA encoding the chemokine Cxcl1. g Hepatic levels of cleaved IL1B (n = 2–5). h Collagen deposition was evaluated by Sirius red staining and quantified by image analysis (n = 5–13). i Representative sections stained with Sirius red. j Hepatic expression of genes involved in liver fibrosis including Col1a1, Acta2 (smooth muscle α-actin, a marker of activated myofibroblasts), and Timp1 (tissue inhibitor of metalloproteinase 1). k Total bacteria, proportions of Enterococcus, E. coli, and Prevotella in fecal samples, measured by qPCR. Proportions of fecal E. coli did not differ significantly between WT and Atp4aSl/Sl mice. Numbers of Prevotella were lower in Atp4aSl/Sl mice than in WT mice, with or without CDAA feeding. Numbers of Enterococcus were significantly higher in Atp4aSl/Sl mice than in WT mice, with or without CDAA feeding. Scale bars = 100 μm. Results are expressed as mean ± s.e.m. For a, b, d, f, g, h, j, k significance was evaluated using the unpaired Student t-test or Mann–Whitney U-statistic test.*P < 0.05
Fig. 4
Fig. 4
Pharmacological gastric acid suppression promotes progression of alcohol-induced liver disease in mice. C57BL/6 mice were fed an oral control diet (n = 4–6; 1–2 replicates) or ethanol diet (n = 11–18; 1–2 replicates) that contained PPI (200 p.p.m.) or vehicle (water) for 9 weeks. a Plasma levels of ALT. b Representative liver sections after hematoxylin and eosin staining. c Hepatic triglyceride content. d Hepatic levels of cleaved IL1B protein (n = 2–5). e Hepatic areas of fibrosis were identified by staining with Sirius red (n = 2–7); area was quantitated by image analysis software. f Representative Sirius red-stained liver sections. g Total bacteria and total amount of enterococci in feces. h Enterococcus in mesenteric lymph nodes (MLN) and liver, assessed by qPCR. Scale bars = 100 μm. Results are expressed as mean ± s.e.m. For a, ce, g, h significance was evaluated using the unpaired Student t-test or Mann–Whitney U-statistic test. *P < 0.05
Fig. 5
Fig. 5
Changes of intestinal Enterococcus growth in the absence of gastric acid during chronic ethanol feeding. a WT mice and their Atp4aSl/Sl littermates were fed an ethanol diet (n = 3–5) for 2 weeks. We used an in vivo assay to measure luminal killing of E. coli and E. faecalis in the gut, , . A 4 cm loop of the proximal jejunum was ligated (without interrupting the blood supply) in anesthetized mice and injected with bioluminescent E. coli or E. faecalis. To analyze luminal survival and killing, we performed IVIS imaging of bioluminescent E. coli and E. faecalis at 80 and 90 min, respectively, after injection of bacteria into ligated jejunal loops. Representative images are shown. Whereas loops of ethanol-fed Atp4aSl/Sl mice had a similar amount of bioluminescent E. coli than ethanol-fed WT mice, bioluminescent E. faecalis was found to be ninefold higher in Atp4aSl/Sl than WT mice. b The graph shows survival in percentage of injected E. coli and E. faecalis. c C57BL/6 mice were fed an ethanol diet with or without a PPI (200 p.p.m.) for 9 weeks, before the PPI was discontinued. Fecal Enterococcus and total luminal bacteria were measured by qPCR (n = 2–12) (2 replicates). Results are expressed as mean ± s.e.m. For b, c significance was evaluated using the unpaired Student t-test or Mann–Whitney U-statistic test. *P < 0.05
Fig. 6
Fig. 6
Numbers of Enterococcus in human fecal samples and effects of E. faecalis on progression of alcohol-induced liver disease in mice. a Fecal amounts of Enterococcus in healthy individuals before (n = 13) and after taking a PPI (omeprazole, 40 mg) daily for 14 days (n = 12). bi C57BL/6 mice were gavaged with polymyxin B 150 mg kg−1 and neomycin 200 mg kg−1 body weight once daily for 1 week to facilitate colonization of E. faecalis. Mice were then fed an oral control diet (n = 3–9; 1–2 replicates) or ethanol diet (n = 13–25; 1–2 replicates) for 9 weeks and gavaged with E. faecalis (5 × 109 CFUs) or vehicle (water) every third day. b Enterococci (left panel) and total amount of bacteria (right panel) in feces. Samples used to measure enterococci in ethanol-fed Atp4aSl/Sl mice and in C57BL/6 mice fed ethanol or given PPIs are the same as in Figs. 1g and 2g, respectively. c Plasma levels of ALT. d Representative liver sections after hematoxylin and eosin staining. e Hepatic triglyceride content. f Hepatic expression of cleaved IL1B protein (n = 2–5). g Hepatic areas of fibrosis were identified by staining with Sirius red (n = 3–10); area was quantitated by image analysis software. h Representative Sirius red-stained liver sections. i Enterococcus in liver, assessed by qPCR. Scale bars = 100 μm. Results are expressed as mean ± s.e.m. For ac, eg, i significance was evaluated using the unpaired Student t-test or Mann–Whitney U-statistic test. *P < 0.05
Fig. 7
Fig. 7
MYD88/TRIF, TLR2 or IL1-receptor inhibition protects from E. faecalis -exacerbated alcoholic liver disease. C57BL/6 mice were irradiated, given transplants of WT, Myd88−/−/TrifLPS2/LPS2 (Myd88/TrifΔBM), or Tlr2−/− bone marrow (Tlr2ΔBM) and injected with clodronate liposomes. Mice were then gavaged with polymyxin B 150 mg kg−1 and neomycin 200 mg kg−1 body weight once daily for 1 week to facilitate colonization of E. faecalis, fed the ethanol diet for 9 weeks, and gavaged with E. faecalis (5 × 109 CFUs; n = 14–27; 1–3 replicates) or vehicle (water; n = 14–29) (1–3 replicates) every third day. A subset of WT mice given transplants of WT bone marrow received the IL1-receptor antagonist anakinra. a Ratio of liver to body weight. b Plasma levels of ALT. c Representative liver sections after hematoxylin and eosin staining. d Hepatic triglyceride content. e Hepatic levels of cleaved IL1B (n = 3). f Hepatic areas of fibrosis were identified by staining with Sirius red; area was quantified by image analysis software (n = 6–17). g Representative Sirius red-stained liver sections. Scale bar = 100 μm. Results are expressed as mean ± s.e.m. For a, b, df significance was evaluated using one-way analysis of variance with Newman–Keuls post-test. *P < 0.05
Fig. 8
Fig. 8
E. faecalis causes an inflammatory and hepatotoxic response mediated by TLR2 on Kupffer cells. a C57BL/6 mice were irradiated, given transplants of WT or Myd88−/−/TrifLPS2/LPS2 bone marrow (Myd88/TrifΔBM), and injected with clodronate liposomes. Mice were then gavaged with polymyxin B 150 mg kg−1 and neomycin 200 mg kg−1 body weight once daily for 1 week to facilitate colonization of E. faecalis, fed the ethanol diet for 9 weeks and gavaged with E. faecalis (5 × 109 CFUs) every third day. Immunofluorescence analysis of F4/80 (red) and IL1B (green; representative liver sections); nuclei are blue. Scale bar = 10 μm. b Primary mouse WT and Tlr2−/− Kupffer cells were stimulated with heat-inactivated, sonicated E. faecalis for 8 h; expression of genes encoding inflammatory mediators was measured (n = 4–5 independent experiments). Results are expressed relative to the level of unstimulated WT Kupffer cells within each experiment. c, d Conditioned medium (CM) from Kupffer cells (KC; stimulated or not stimulated with heat-inactivated, sonicated E. faecalis) was transferred to ethanol-stimulated (100 mM) primary mouse hepatocytes in the presence of a control (IgG) or IL1B neutralizing antibody. c Hepatocyte cytotoxicity (n = 3 independent experiments performed in 2–6 replicates) and total IL1B in the cell supernatant (2–6 replicates) (d). Results are expressed as mean ± s.e.m.. For bd significance was evaluated using the unpaired Student t-test or Mann–Whitney U-statistic test. *P < 0.05
Fig. 9
Fig. 9
PPI treatment increases the risk of liver disease in chronic alcoholics. a Cumulative risk of ALD based on use of PPIs. A Cox regression model was used to compare risk among active, previous, and never users. b Fecal amounts of Enterococcus in chronic consumers of alcohol taking PPIs (n = 3) and not taking PPI (n = 8). Results are expressed as mean ± s.e.m. For a, a Cox regression model was used to compare risk among PPI users in a cohort of alcohol-dependent patients.For b, significance was evaluated using Student t-test. *P < 0.05
Fig. 10
Fig. 10
Gastric acid suppression and alcoholic liver disease. Gastric acid suppression increases intestinal Enterococcus, which translocates to the liver via the portal vein. Enterococcus binds to the pathogen recognition receptor TLR2 on hepatic Kupffer cells, leading to secretion of IL1B. IL1B contributes to ethanol-induced liver inflammation and hepatocyte damage

Comment in

References

    1. Lozano R, et al. Global and regional mortality from 235 causes of death for 20 age groups in 1990 and 2010: a systematic analysis for the Global Burden of Disease Study 2010. Lancet. 2012;380:2095–2128. doi: 10.1016/S0140-6736(12)61728-0. - DOI - PMC - PubMed
    1. Wong RJ, Cheung R, Ahmed A. Nonalcoholic steatohepatitis is the most rapidly growing indication for liver transplantation in patients with hepatocellular carcinoma in the U.S. Hepatology. 2014;59:2188–2195. doi: 10.1002/hep.26986. - DOI - PubMed
    1. Rehm J, Samokhvalov AV, Shield KD. Global burden of alcoholic liver diseases. J. Hepatol. 2013;59:160–168. doi: 10.1016/j.jhep.2013.03.007. - DOI - PubMed
    1. Hvid-Jensen F, et al. Lifestyle factors among proton pump inhibitor users and nonusers: a cross-sectional study in a population-based setting. Clin. Epidemiol. 2013;5:493–499. doi: 10.2147/CLEP.S49354. - DOI - PMC - PubMed
    1. Johansen ME, Huerta TR, Richardson CR. National use of proton pump inhibitors from 2007 to 2011. JAMA Intern. Med. 2014;174:1856–1858. doi: 10.1001/jamainternmed.2014.2900. - DOI - PubMed

Publication types

Substances