. 2017 Oct 16;7(1):13220.
doi: 10.1038/s41598-017-13576-w.

The contribution of Saccharomyces cerevisiae replicative age to the variations in the levels of Trx2p, Pdr5p, Can1p and Idh isoforms

Affiliations

The contribution of Saccharomyces cerevisiae replicative age to the variations in the levels of Trx2p, Pdr5p, Can1p and Idh isoforms

Aglaia V Azbarova et al. Sci Rep. .

Abstract

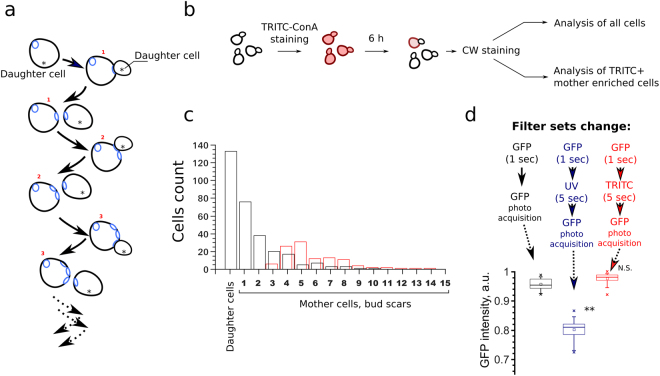
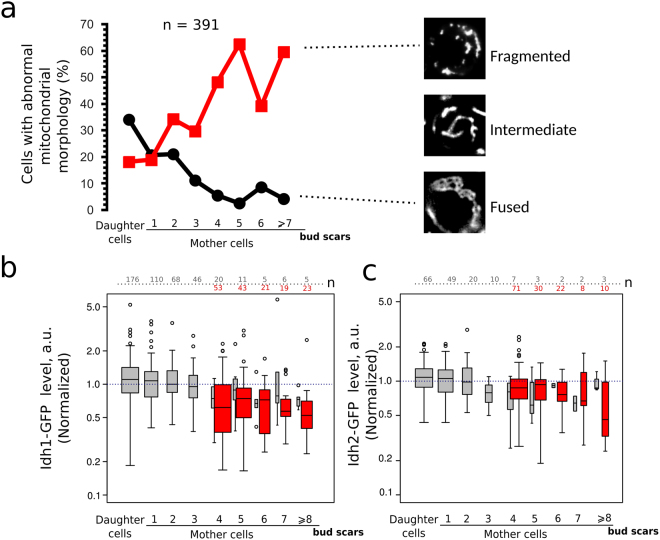
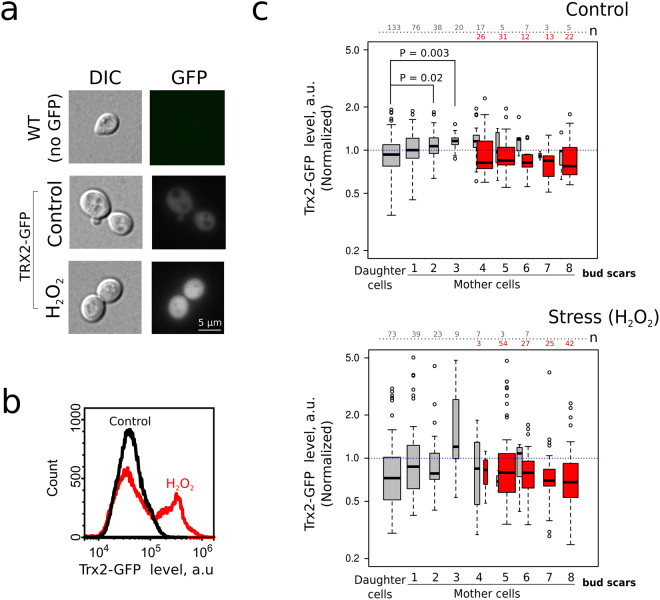
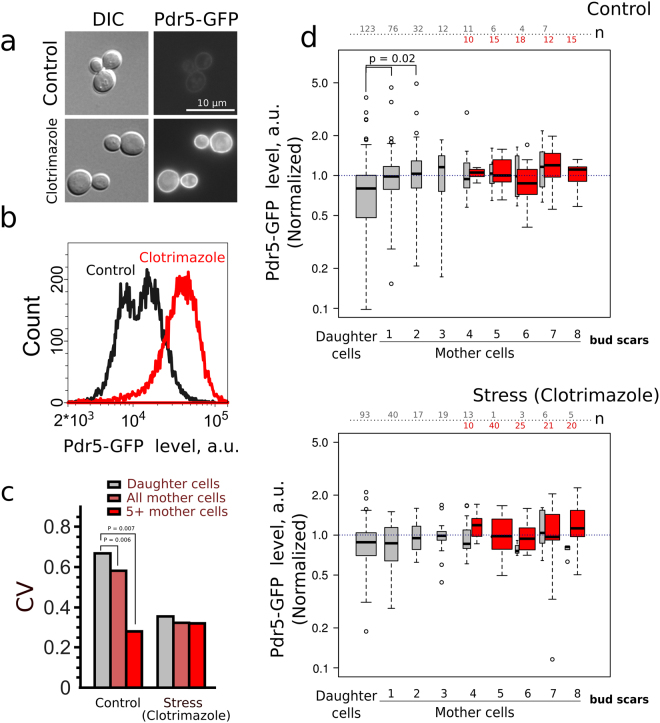
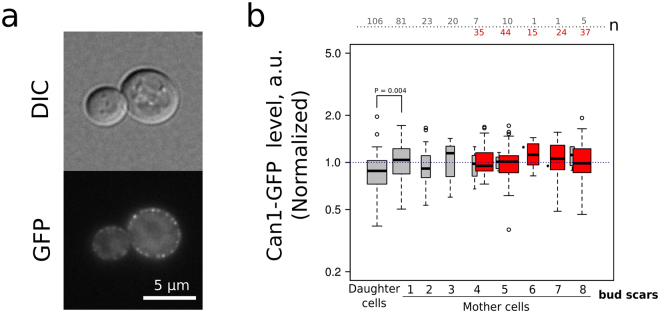
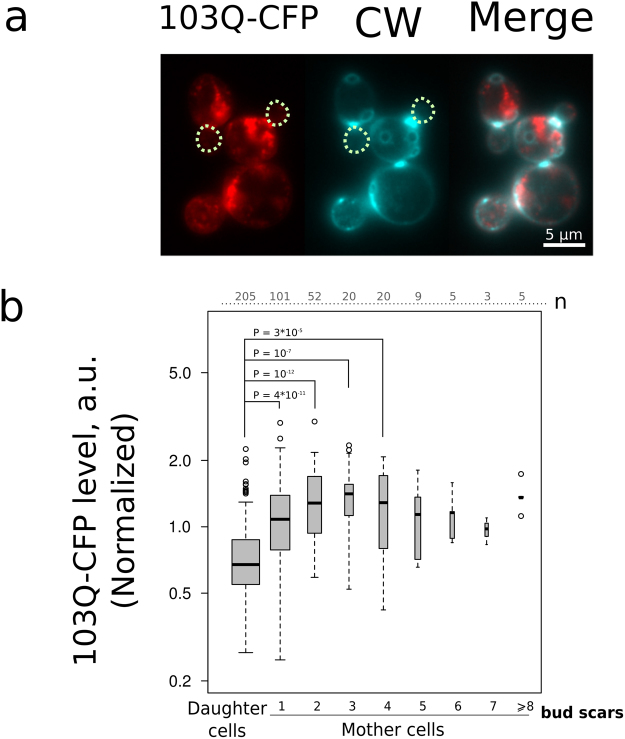
Asymmetrical division can be a reason for microbial populations heterogeneity. In particular, budding yeast daughter cells are more vulnerable to stresses than the mothers. It was suggested that yeast mother cells could also differ from each other depending on their replicative age. To test this, we measured the levels of Idh1-GFP, Idh2-GFP, Trx2-GFP, Pdr5-GFP and Can1-GFP proteins in cells of the few first, most represented, age cohorts. Pdr5p and Can1p were selected because of the pronounced mother-bud asymmetry for these proteins distributions, Trx2p as indicator of oxidative stress. Isocitrate dehydrogenase subunits Idh1p and Idh2p were assessed because their levels are regulated by mitochondria. We found a small negative correlation between yeast replicative age and Idh1-GFP or Idh2-GFP but not Trx2-GFP levels. Mitochondrial network fragmentation was also confirmed as an early event of replicative aging. No significant difference in the membrane proteins levels Pdr5p and Can1p was found. Moreover, the elder mother cells showed lower coefficient of variation for Pdr5p levels compared to the younger ones and the daughters. Our data suggest that the levels of stress-response proteins Pdr5p and Trx2p in the mother cells are stable during the first few cell cycles regardless of their mother-bud asymmetry.


Conflict of interest statement

The authors declare that they have no competing interests.

Figures

Figure 1
Figure 1
Experimental approach. (a) Yeast cell division cycles result in the formation of the mother cells with different numbers of chitin enriched bud scars. Asterisks indicate the buds (daughter cells), digits - the replicative age (number of bud scars) of mother cells. (b) An outline of the performed experimental procedures. Exponentially growing yeast cells were stained with TRITC-ConA, then grown for 6 hours, stained with CW (Calcofluor white) and analyzed. In each biological replicate the first 40–60 randomly selected cells were photographed in GFP- and then CW-channel (analysis of all cells), afterwards 40–60 TRITC-positive cells from the same sample were selected and photographed in the same channels. (c) Distribution of yeast cells in the replicative aging cohorts (black bars). The distribution of TRITC-ConA enriched mother cells (red bars). (d) The ratio of Trx2-GFP fluorescence intensity before and after the illumination with U-MNU2 (UV, excitation wavelength λ = 360–370 nm) and U-MNG2 (TRITC, excitation wavelength λ = 530–550 nm) filter sets. **P value < 0.01 according to Wilcoxon rank-sum unpaired test.
Figure 2
Figure 2
The levels of Idh1-GFP and mitochondrial morphology in yeast cells correlate with the age of the mother cells. (a) The percentage of yeast cells with fragmented or fused mitochondrial network morphology. The data (391 cells) were pooled from four separate day experiments. Correlation coefficient (Kendall’s tau) for yeast age and percentage of yeast cells with fragmented mitochondria is equal to 0.714 (P = 0.014). The difference between the age cohorts of the mother cells is significant, p-value = 0.00018 according to Pearson’s Chi-squared test with simulated p-value. The representative photographs of different types mitochondrial morphology networks visualized by mitochondrial protein Idh1-GFP are shown in the right. Idh1-GFP (b) and Idh2-GFP (c) levels in individual cells of different replicative age cohorts. Grey boxplots represent the random samples of yeast cells. There is a significant negative correlation between yeast mother cells age and Idh1-GFP level (see Table 1). Red box plot represents TRITC+ (age > 4) enriched mother cells. The numbers of analyzed cells for each age class are shown at the top of the boxplot. The bin size for TRITC+ and TRITC− cells are designated separately.
Figure 3
Figure 3
Trx2-GFP level displays mother-daughter asymmetry but does not differ between the mother cells of different ages. (a) Representative photograph of control yeast cells and yeast cells expressing Trx2-GFP. Treatment of yeast cells with H2O2 (2 mM) induces an increase of Trx2-GFP levels; (b) Analysis of Trx2-GFP levels by flow cytometry under the control conditions and in the presence of 2 mM H2O2; (c) Quantification of Trx2-GFP in yeast cells of different age cohorts under the control conditions (upper panel) or treated with H2O2. Red box plots indicate Trx2-GFP levels in TRITC-ConA positive (age > 4 enriched) mother cells. The numbers of analyzed cells for each age class are shown at the top of the boxplot. The bin size for TRITC+ and TRITC− cells are designated separately. The only detected difference was between the untreated daughter and the mother cells (*P < 0.05; **P < 0.005 according to Nemenyi test).
Figure 4
Figure 4
The level of Pdr5-GFP in yeast cells does not differ in the mother cells aging cohorts. (a) A representative photograph of the control and clotrimazole treated (20 μM) cells. (b) Quantification of Pdr5-GFP levels increase induced by clotrimazole. (c) Cell-to-cell coefficient of variation (CV) of Pdr5-GFP levels for daughter cells, all mother cells and TRITC+ (age > 4 enriched) mother cells with replicative age above five. P-value was calculated with Fligner-Killeen (median) test. (d) Pdr5-GFP levels in individual cells of different yeast cells replicative age cohorts. Grey boxplots represent the random samples of yeast cells, the red box plot represents TRITC+ cells. The control and the stress conditions (20 μM clotrimazole) were analyzed. The numbers of analyzed cells for each age class are shown at the top of the boxplot. The bin size for TRITC+ and TRITC− cells are designated separately. P value was calculated by Nemenyi-Test.
Figure 5
Figure 5
The level of Can1-GFP does not differ in the mother cells aging cohorts. (a) Representative photograph of the control yeast cells expressing Can1-GFP. (b) Can1-GFP levels in the individual cells of different replicative age cohorts (n = 410 cells). Grey boxplots represent the random samples of yeast cells, the red box plot represents TRITC+ (age > 4 enriched) mother cells. The numbers of analyzed cells for each age class are shown at the top of the boxplot. The bin size for TRITC+ and TRITC− cells are designated separately. P value was calculated according Nemenyi-Test.
Figure 6
Figure 6
103Q-CFP level displays mother-daughter asymmetry. (a) Representative photograph of the group of cells expressing 103Q-CFP (red) stained with calcofluor white (blue). Image was generated by pseudo colouring: CFP-channel black and white image was copied to R channel, CW-channel image — to G and B channels of the RGB file. The dotted circles mark daughter cells. (b) Quantification of the average 103Q-CFP levels for replicative age cohorts. The numbers of analyzed cells for each age class are shown at the top of the boxplot. P value was calculated by Nemenyi-Test.

Similar articles

Cited by

References

    1. Dubnau D, Losick R. Bistability in bacteria. Mol. Microbiol. 2006;61:564–572. doi: 10.1111/j.1365-2958.2006.05249.x. - DOI - PubMed
    1. Veening J-W, et al. Bet-hedging and epigenetic inheritance in bacterial cell development. Proc. Natl. Acad. Sci. USA. 2008;105:4393–4398. doi: 10.1073/pnas.0700463105. - DOI - PMC - PubMed
    1. Aragon AD, et al. Characterization of differentiated quiescent and nonquiescent cells in yeast stationary-phase cultures. Mol. Biol. Cell. 2008;19:1271–1280. doi: 10.1091/mbc.E07-07-0666. - DOI - PMC - PubMed
    1. Halme A, Bumgarner S, Styles C, Fink GR. Genetic and epigenetic regulation of the FLO gene family generates cell-surface variation in yeast. Cell. 2004;116:405–415. doi: 10.1016/S0092-8674(04)00118-7. - DOI - PubMed
    1. Ghaemmaghami S, et al. Global analysis of protein expression in yeast. Nature. 2003;425:737–741. doi: 10.1038/nature02046. - DOI - PubMed

Publication types

MeSH terms

Substances