. 2017 Oct 16;8(1):947.
doi: 10.1038/s41467-017-00983-w.

TRPA1-FGFR2 binding event is a regulatory oncogenic driver modulated by miRNA-142-3p

Affiliations

TRPA1-FGFR2 binding event is a regulatory oncogenic driver modulated by miRNA-142-3p

Jonathan Berrout et al. Nat Commun. .

Abstract

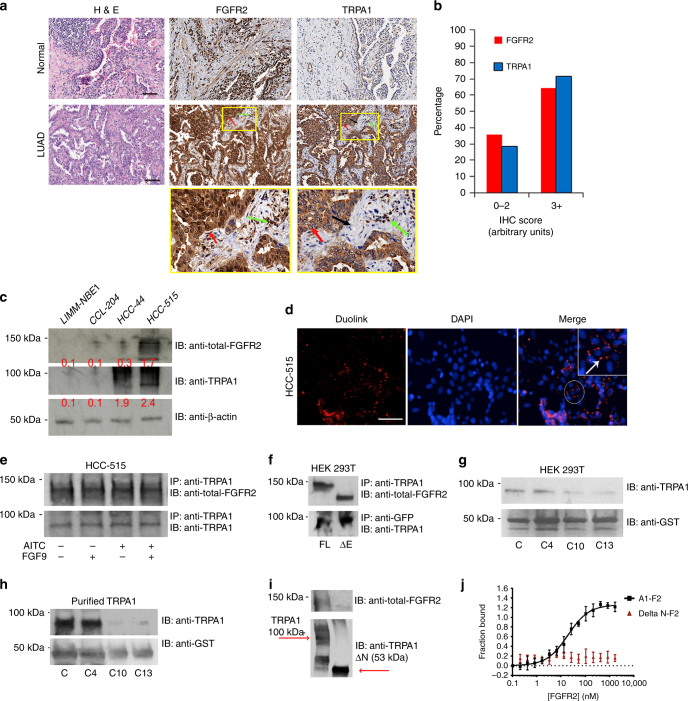
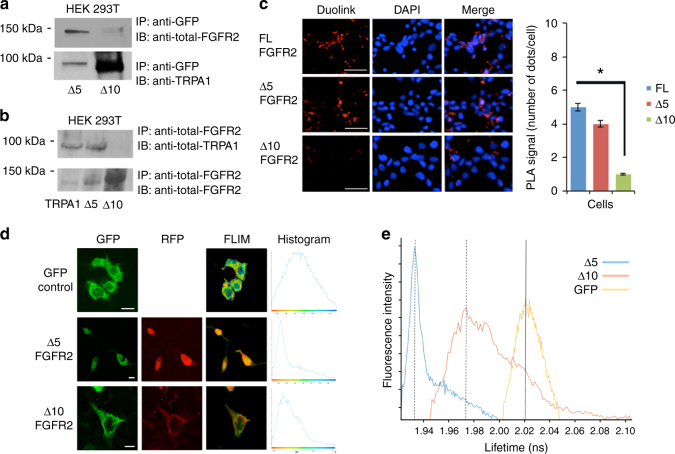
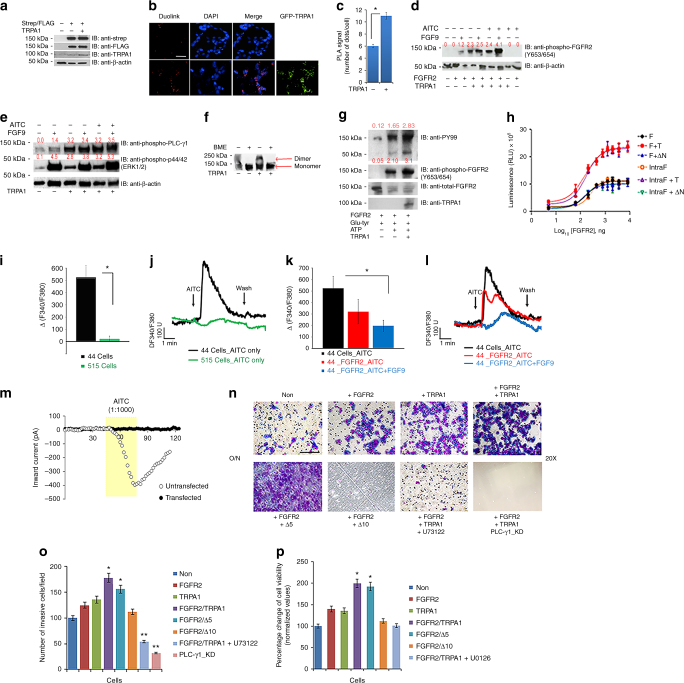
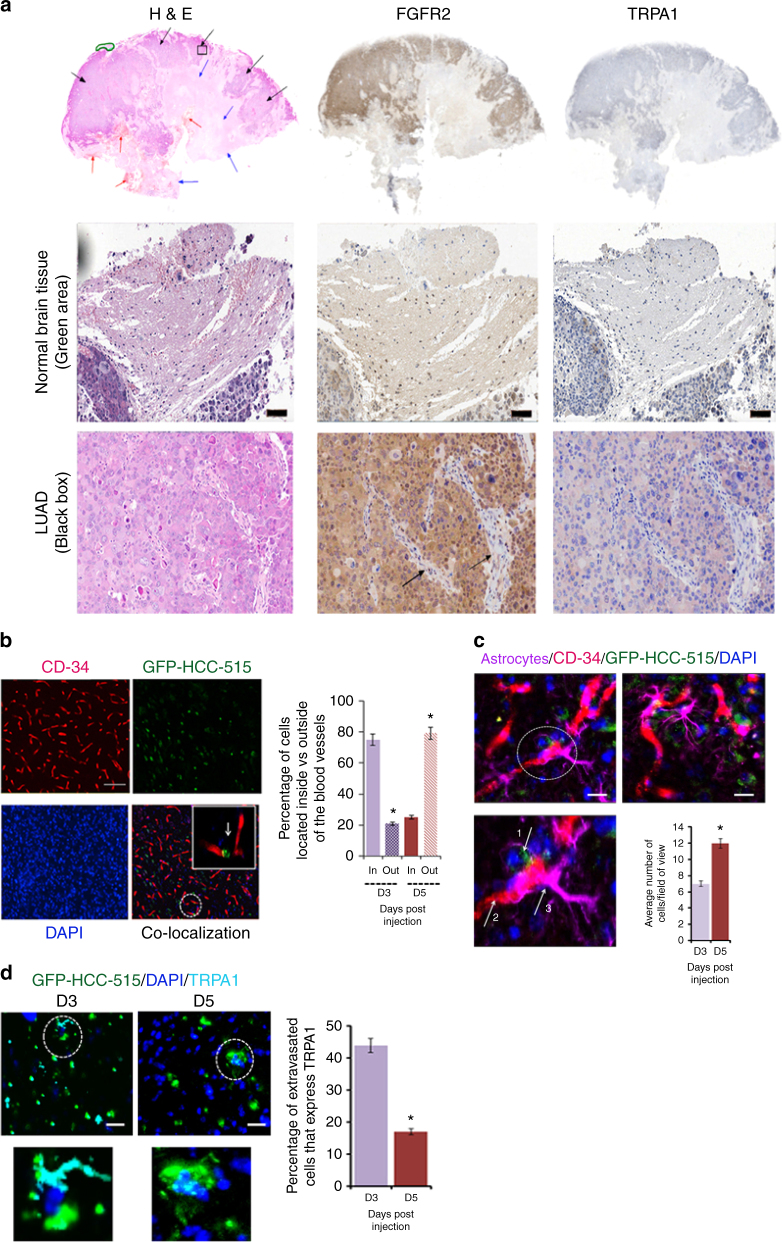
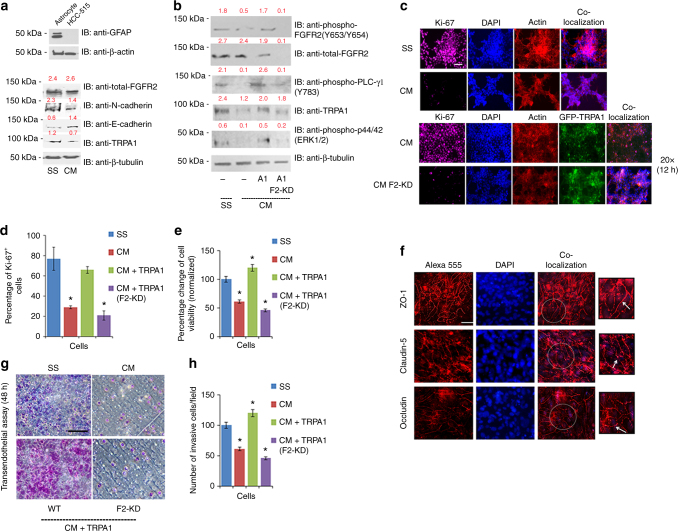
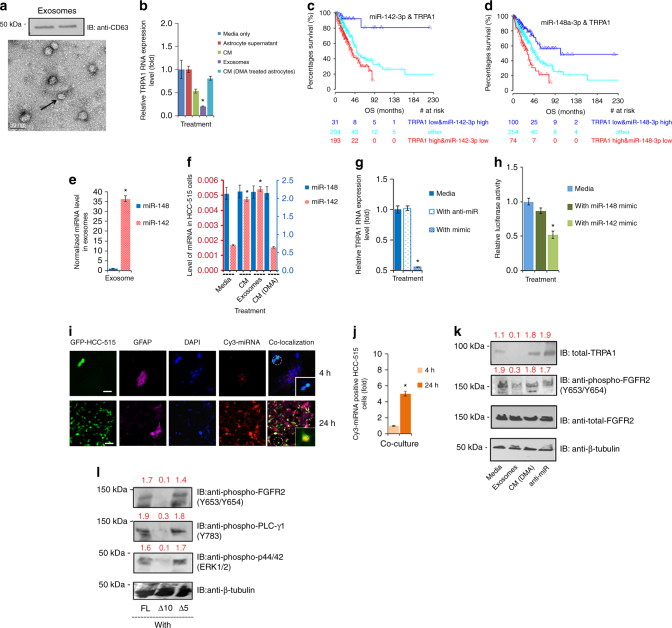
Recent evidence suggests that the ion channel TRPA1 is implicated in lung adenocarcinoma (LUAD), where its role and mechanism of action remain unknown. We have previously established that the membrane receptor FGFR2 drives LUAD progression through aberrant protein-protein interactions mediated via its C-terminal proline-rich motif. Here we report that the N-terminal ankyrin repeats of TRPA1 directly bind to the C-terminal proline-rich motif of FGFR2 inducing the constitutive activation of the receptor, thereby prompting LUAD progression and metastasis. Furthermore, we show that upon metastasis to the brain, TRPA1 gets depleted, an effect triggered by the transfer of TRPA1-targeting exosomal microRNA (miRNA-142-3p) from brain astrocytes to cancer cells. This downregulation, in turn, inhibits TRPA1-mediated activation of FGFR2, hindering the metastatic process. Our study reveals a direct binding event and characterizes the role of TRPA1 ankyrin repeats in regulating FGFR2-driven oncogenic process; a mechanism that is hindered by miRNA-142-3p.TRPA1 has been reported to contribute lung cancer adenocarcinoma (LUAD), but the mechanisms are unclear. Here the authors propose that TRPA1/FGFR2 interaction is functional in LUAD and show that astrocytes oppose brain metastasis by mediating the downregulation of TRPA1 through exosome-delivered miRNA-142-3p.


Conflict of interest statement

The authors declare no competing financial interests.

Figures

Fig. 1
Fig. 1
FGFR2 binds directly to TRPA1 ankyrin repeats via its C-terminal proline-rich motif. a Representative image of haematoxylin and eosin (H&E) stain and immunohistochemistry (IHC) staining with FGFR2 and TRPA1 antibodies of a lung cancer tissue microarray. Scale bar: 10 μm. Neoplastic epithelial cells are indicated by the red arrow, inflammatory cells by the green arrow, and supporting stroma (fibroblasts) by the black arrow. b Fraction of total LUAD samples (in percentage) in the tissue microarrays (TMAs) with the indicated pathological scores. c Western blots for the expression levels of FGFR2 and TRPA1 in LIMM-NBE1, CCL-204, HCC-515, and HCC-44 cell lines. Normalized densitometric values (in relative arbitrary units) are reported in red below each band and represent the average of three independent experiments. d Duolink assay results with an example of a PLA signal depicted by the white arrow. Scale bar: 50 μm. e Western blot analysis of an immunoprecipitation (IP with anti-TRPA1) in HCC-515 cell line followed by immunoblotting (IB) with the indicated antibodies. f Western blot analysis of an IP in HEK 293T cells transfected with full-length TRPA1 with either full-length FGFR2 (FL) or extracellular region-truncated FGFR2 (ΔE). IP and IB were performed with the indicated antibodies. g GST pull-down results in HEK 293T cells transfected with TRPA1 and C, C4, C10, and C13 GST-constructs on GST beads. h GST pull-down experiment with full-length purified TRPA1 and C, C4, C10, and C13 GST-constructs on GST beads. i Western blot analysis of purified biotinylated full-length TRPA1 or ankyrin repeats-truncated TRPA1 (ΔN) proteins immobilized on streptavidin beads and incubated with full-length purified FGFR2. j Microscale thermophoresis (MST) curve of purified full-length FGFR2 (F2; titrated in a range of concentrations) with purified full-length TRPA1 (A1) or ΔN. Apparent dissociation constant K d for A1-F2 was 122.8 ± 23.4 nM. Error bars represent the s.d. of each data point (n = 7)
Fig. 2
Fig. 2
FGFR2 binds to ankyrins 6–10 of TRPA1. a, b Western blot analysis of an IP with anti-GFP in (a) and anti-FGFR2 in (b) in HEK 293T cells that were co-transfected with full-length FGFR2 and N-terminal ankyrin repeat truncated TRPA1 (Δ5-GFP or Δ10-GFP) followed by IB with the indicated antibodies. c Duolink assay results performed in HEK 293T cells that were co-transfected with FGFR2 and TRPA1 constructs. Scale bar: 50 μm. The bar graph indicates the number of red dots (binding events) in the samples. Error bars, s.d. (n = 3 biological replicates each with technical replicates). *P ≤ 0.05 by two-tailed Student’s t test. d, e FLIM experiment in HEK 293T cells co-transfected with FGFR2-RFP and Δ5-GFP or Δ10-GFP. Y-axis depicts the fluorescence intensity. Scale bar is 10 μm. HEK 293T cells that were transfected with an empty GFP vector (upper panel) were utilized as a control to establish the lifetime of GFP. Histograms (shown on the same scale) in (e) indicate lifetime changes in nanoseconds (ns), where a decrease in GFP lifetime (peak shift to the left of the yellow curve) correlates with a potential direct binding event between the two proteins
Fig. 3
Fig. 3
FGFR2-TRPA1 binding event results in FGFR2 activation, but TRPA1 inhibition. a Western blot showing the efficiency of transfection of Strep-tagged FGFR2, FLAG-tagged FGFR2, and TRPA1-GFP in HEK 293T cells. b, c Duolink assay in HEK 293T cells using antibodies targeted against Strep-tagged and FLAG-tagged FGFR2 in the absence (upper panel) or presence (bottom panel) of TRPA1. Scale bar: 50 μm. PLA signals are quantified in (c). d Western blot analysis of differentially transfected and treated HEK 293T cells. The blot was probed with the indicated antibodies. e Western blot analysis of HEK 293T cells transfected with FGFR2 in all samples but differentially transfected with TRPA1. The blot was probed with the indicated antibodies. f Western blot analysis of purified FGFR2 dimerization assay (under non-reducing or reducing conditions) in the presence or absence of purified TRPA1. g Western blot analysis of an in vitro receptor kinase assay in the presence or absence of purified TRPA1. h Luminescent kinase assay results of purified full length FGFR2 (F) and intracellular cytoplasmic region of FGFR2 (IntraF) in the presence or absence of full-length TRPA1 (T) or ΔN. Intensity of the luminescence signal is measured in relative luminescence units (RLU). ik Bar graphs of the averaged calcium imaging results (Δ F340/380) with representative traces of calcium responses. m Example inward currents, from a holding potential of −60 mV, evoked in untransfected (○) and FGFR2-transfected HCC-44 cells (●) by the application of AITC (1:1000 in the perfusate). Currents were recorded at 2 s intervals for a control period, during application of AITC and then during washout. n Representative images of an invasion assay using differentially transfected HEK 293T that were incubated over night (O/N) in serum starvation media. Lower chamber contains 1% FBS-supplemented media. Images were taken at 20× magnification (scale bar: 100 μm). U73122 is PLC-γ1 inhibitor and PLC-γ1_KD designates HEK 293T cell line with knocked down PLC-γ1. o Quantification of the results from (n), where the number of invaded cells were counted in 6 different microscopic fields/well. p MTT assay results of differentially transfected HEK 293T cells with or without U0126 (MEK inhibitor) treatment. Percentage change in cell viability for each sample with respect to the untransfected control sample (Non) is depicted on the Y-axis. In the above, error bars, s.d. (n = 3 biological replicates). *P ≤ 0.05 and **P ≤ 0.01 were determined by two-tailed Student’s t test
Fig. 4
Fig. 4
TRPA1 expression level is significantly reduced upon LUAD brain metastasis. a IHC and H&E staining of lung cancer brain metastases. Upper panel: Normal brain tissue (green area), tumor tissue (black arrows), necrosis (blue arrows), and haemorrhage (red arrows). Middle panel: Higher magnification of normal brain (scale bar: 100 μm). Bottom panel: Higher magnification of metastatic lung cancer (scale bar: 200 μm) shows FGFR2-positive tumor cells with areas of negatively-stained fibrovascular connective tissue (black arrows). b Left panel: Images of IF staining at 20× magnification of mouse brain slices 5 days following injection with GFP-HCC-515. CD-34 (Alexa 555) was used as a blood vessel marker. Scale bars: 20 μm. Right panel: Percentage of cancer cells located inside vs. outside blood vessels 3 days (D3) and 5 days (D5) following injection. Error bars indicate s.d. *P ≤ 0.05. c Left panel: Two representative images from D5 (one with an additional zoom-in area). GFAP-positive reactive astrocytes (Alexa 647; pseudo colour: magenta) are shown in the vicinity of extravasating cancer cells (green) as indicated by the white arrows (arrow 1: cancer cell; arrow 2: blood vessel; and arrow 3: astrocyte). Scale bars: 20 μm. Right panel: Bar graph representation of the number of activated astrocytes present in the vicinity of cancer cells 3 days (D3) and 5 days (D5) following injection. Cancer cell-associated astrocytes are quantified within a distance of 150-μm from cancer cells. Error bars indicate s.d. *P ≤ 0.05. d Left panel: TRPA1 expression (Alexa 647; pseudo colour: cyan) in cancer cells 3 days (D3) and 5 days (D5) following injection. Scale bars: 20 μm. Right panel: Extravasated cancer cells were counted in 20 randomly chosen fields per brain followed by calculation of TRPA1-positive cells. Error bars indicate s.d. *P ≤ 0.05
Fig. 5
Fig. 5
Astrocytes decrease the proliferative and invasive potential of cancer cells by reducing TRPA1 expression level. a Upper panel: western blot analysis of GFAP expression level in astrocytes with HCC-515 cells used as a negative control. Bottom panel: western blot analysis of HCC-515 cells that have been serum starved (SS) or treated with conditioned media (CM). The blot was probed with the indicated antibodies. Normalized densitometric values are reported in red above each band throughout the figure and represent the average of three independent experiments. b Western blot analysis of HCC-515 cells without TRPA1 transfection (−), with TRPA1 transfection and scrambled shRNA (A1) or with TRPA1 transfection and FGFR2 knockdown (A1/F2_KD). In all cases, blots were probed with the indicated antibodies. c IF of HCC-515 cells stained with the proliferation marker, Ki-67. Scale bar: 50 μm. d Bar graph quantification of (c), where the number of Ki-67+ cells were counted under the same magnification in 6 random microscopic fields/sample and averaged. Error bars indicate s.d. (n = 3 biological replicates). *P ≤ 0.05 by two-tailed Student’s t test. e Results of an MTT assay performed overnight and normalized against the values obtained for SS-treated-cells. Error bars indicate s.d. (n = 3 biological replicates). *P ≤ 0.05 by two-tailed Student’s t test. f IF of tight junction proteins (ZO-1, Occludin and Claudin-5 depicted by white arrows in the zoom-in area) in RBE4 cells with different paracellular permeability that were grown in a trans-well chamber. TEER measurement of the integrity of the cellular barrier ranged in value between 150 and 200 ohm cm2. Scale bars: 20 μm. g Representative images of a transendothelial assay with RBE4 monolayer from (f) utilized as a cellular barrier on top of which HCC-515 cells were incubated in SS media or CM media with 1% serum-supplemented media in the lower chamber. Images were taken at 20× magnification. Scale bar: 100 μm. h Quantification of the transendothelial assay results, where the number of invaded cells were counted in 8 different microscopic fields. Error bars indicate s.d. (n = 3 biological replicates). *P ≤ 0.05 by two-tailed Student’s t test
Fig. 6
Fig. 6
TRPA1-targeting miR-142-3p is intercellularly transferred from astrocytes to HCC-515 cells. a TEM image (Scale bar: 50 nm) and western blot analysis (loaded samples are from two separate experiments) of purified exosomes. The blot was probed with CD63 antibody. b Bar graph depicting normalized TRPA1 mRNA level in HCC-515 cells treated overnight with SS media (normalization control), astrocyte supernatant, which lacks exosomes, astrocyte-CM, 200 μl of 100X concentrated exosomes and CM from astrocytes that have been treated for 4 h with DMA (inhibitor of exosomal release). c, d Kaplan–Meier curve depicting the correlation of TRPA1, miR-142-3p, and miR-148-3p with patient survival. The numbers of patients at risk at different time points are presented at the bottom of the graph. The calculated log-rank test value yielded P = 0.00001 (c) and P = 0.00002 (d), respectively. The median of overall survival (OS) in months is shown. e, f Bar graphs showing the level of miRNA in exosomes and differentially treated HCC-515 cells. g Bar graph representation of the changes in TRPA1 mRNA levels in HCC-515 cells following their treatment with SS media only, SS media + anti-miR (miR-142-3p inhibitor) and SS media + miR-142-3p mimic. h Bar graph of the 3′-UTR luciferase assay results obtained from HEK 293T cells in the abence or presence of mimics. i IF staining images of the intercellular transfer of miR-142-3p, 4 h or 24 h following the co-culture of HCC-515 (expressing an empty GFP vector) with astrocytes that have been loaded with Cy-3-labeled miR142-3p. GFAP (Alexa 647 with magenta as a pseudo-colour) was utilized as an astrocytic marker to distinguish them from cancer cells. Scale bar is 50 μm. j Bar graph representation of the results from i) counted at 20× magnification in eight randomly selected microscopic fields. k Western blot analysis of HCC-515 after variable overnight treatments followed by probing with the indicated antibodies. Normalized densitometric values represent the average of three independent experiments. l Western blot analysis of HCC-515 cells 6 h post-transfection with the indicated constructs following their overnight treatment with exosomes. The blot was probed with the indicated antibodies. In the above, error bars, s.d. (n = 3 biological replicates). *P ≤ 0.05 and **P ≤ 0.01 by two-tailed Student’s t test

References

    1. Torre LA, et al. Global cancer statistics, 2012. CA. Cancer J. Clin. 2015;65:87–108. doi: 10.3322/caac.21262. - DOI - PubMed
    1. Amos CI, et al. P1.04: defining the genetic architecture of lung cancer etiology: track: prevention, early detection, epidemiology and tobacco control. J. Thorac Oncol. 2016;11:S182. doi: 10.1016/j.jtho.2016.08.026. - DOI - PubMed
    1. Bilello KS, Murin S, Matthay RA. Epidemiology, etiology, and prevention of lung cancer. Clin. Chest Med. 2002;23:1–25. doi: 10.1016/S0272-5231(03)00057-1. - DOI - PubMed
    1. Dela Cruz CS, Tanoue LT, Matthay RA. Lung cancer: epidemiology, etiology, and prevention. Clin. Chest Med. 2011;32:605–644. doi: 10.1016/j.ccm.2011.09.001. - DOI - PMC - PubMed
    1. Langley RR, Fidler IJ. The seed and soil hypothesis revisited--the role of tumour-stroma interactions in metastasis to different organs. Int. J. Cancer. 2011;128:2527–2535. doi: 10.1002/ijc.26031. - DOI - PMC - PubMed

Publication types