Clinical Trial
. 2017 Oct 16;7(1):13191.
doi: 10.1038/s41598-017-13510-0.

Interacting Learning Processes during Skill Acquisition: Learning to control with gradually changing system dynamics

Affiliations
Clinical Trial

Interacting Learning Processes during Skill Acquisition: Learning to control with gradually changing system dynamics

Nicolas Ludolph et al. Sci Rep. .

Abstract

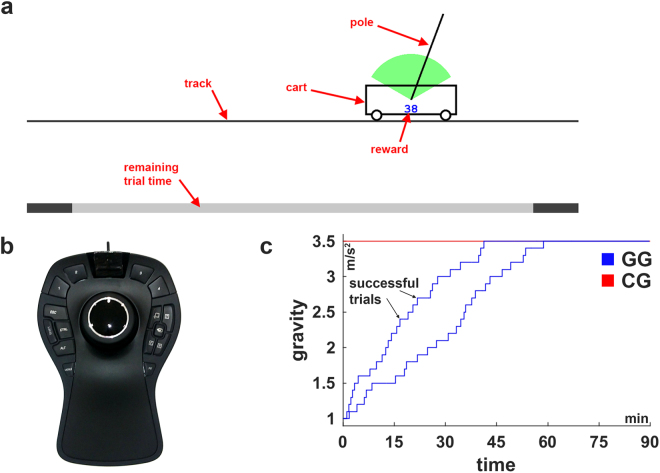
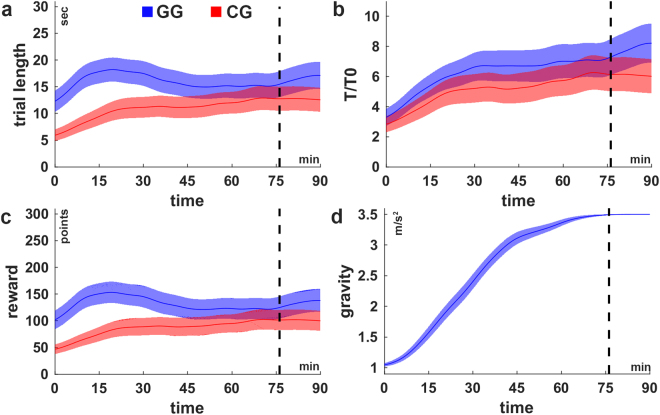
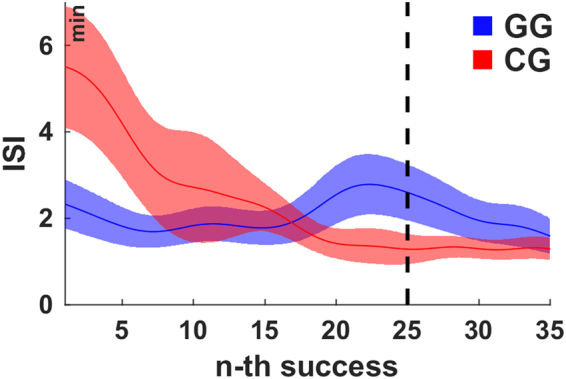
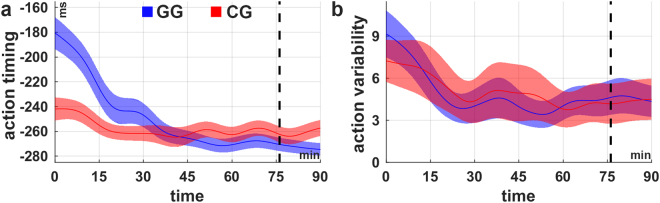
There is increasing evidence that sensorimotor learning under real-life conditions relies on a composition of several learning processes. Nevertheless, most studies examine learning behaviour in relation to one specific learning mechanism. In this study, we examined the interaction between reward-based skill acquisition and motor adaptation to changes of object dynamics. Thirty healthy subjects, split into two groups, acquired the skill of balancing a pole on a cart in virtual reality. In one group, we gradually increased the gravity, making the task easier in the beginning and more difficult towards the end. In the second group, subjects had to acquire the skill on the maximum, most difficult gravity level. We hypothesized that the gradual increase in gravity during skill acquisition supports learning despite the necessary adjustments to changes in cart-pole dynamics. We found that the gradual group benefits from the slow increment, although overall improvement was interrupted by the changes in gravity and resulting system dynamics, which caused short-term degradations in performance and timing of actions. In conclusion, our results deliver evidence for an interaction of reward-based skill acquisition and motor adaptation processes, which indicates the importance of both processes for the development of optimized skill acquisition schedules.


Conflict of interest statement

The authors declare that they have no competing interests.

Figures

Figure 1
Figure 1
Illustrations of the cart-pole system, the used input device and experimental conditions. (a) Cart-pole system. (b) Input device. The knob of the input device can be shifted and rotated into all directions. The left-right translation was used to control the virtual force, which is applied to the cart from either side. (c) Experimental conditions: gradual gravity (GG) and constant gravity (CG). For the condition GG, the course of the gravity is shown for two representative subjects to illustrate the individual, performance-dependent increase. Gravity was increased after every successful balancing attempt.
Figure 2
Figure 2
Learning curves. (a) Trial length, (b) normalized trial length (T/T0), (c) cumulated reward per trial across the experimental duration in the conditions GG (blue) and CG (red). The normalized trial length (b) reveals a monotonic improvement for both groups whereas the other measures (trial length and reward) are non-monotonic. (d) The average increase of the gravity of subject in condition GG. The shaded areas indicate the inter-subject-variability (±1SEM). The black dashed lines indicate the time at which all subjects in condition GG have reached maximum gravity (gmax = 3.5 m/s2) latest. For the purpose of illustration, the curves were smoothed over time using the weighted running average method.
Figure 3
Figure 3
The average inter-success intervals for the first 35 successes. The inter-success intervals (ISI) in condition CG decrease monotonically whereas in condition GG an intermediate increase is observable just before subjects reached the maximum gravity after 25 successes. The shaded areas indicate the inter-subject-variability (±1 SEM). The black dashed line indicates the time at which all subjects in condition GG have reached maximum gravity (gmax = 3.5 m/s2) latest. For the purpose of illustration, the curves were smoothed over time using the weighted running average method.
Figure 4
Figure 4
Action timing and variability over the course of learning. Average (a) action timing and (b) action variability over the course of the experiment for the conditions GG (blue) and CG (red). In both conditions the action timing as well as the action variability decline (actions are timed earlier, variability decreases) over time. Both measures were calculated in bins of 5 minutes length. The shaded areas indicate the inter-subject-variability (±1 SEM). The shaded areas indicate the inter-subject-variability (±1 SEM). The black dashed lines indicate the time at which all subjects in condition GG have reached maximum gravity (gmax = 3.5 m/s2) latest. For the purpose of illustration, the curves were smoothed over time using the weighted running average method.
Figure 5
Figure 5
Change of trial length, action timing and variability as function of gravity changes (group GG). Change in (a) trial length, (b) action timing and (c) action variability for the subjects in the group GG. On the left, the measures are shown for each gravity step, and on the right, the average over all steps is shown for each measure with error bars (±1 SEM). Subjects improve (increase in trial length, more predictive actions, less variable actions) within and get worse (decrease in trial length, less predictive actions) across the gravity steps (see Methods and Fig. 7d). Excluding the first three gravity steps reveals also for the action variability a significant negative influence of the increments in the gravity. Significance codes: ***p < 0.001, *p < 0.05.
Figure 6
Figure 6
Relationship between task performance, normalized action timing and variability. Action timing and variability were normalized to remove the coherent influence of learning (see Methods: Relationship between action timing and task performance) and can therefore take negative values. (a) In both groups, there is a strong relationship between the normalized action timing and trial length (task performance). Generally, the more predictive actions are performed (negative action timing) the better the task performance. (b) Subjects in the group CG show a higher action variability for low task performances (trial length shorter than 5 seconds). The action variability is not significantly related to the task performance for subjects in the group GG. The shaded areas indicate the inter-subject variability (±1 SEM). For the purpose of illustration, the curves were smoothed over time using the weighted running average method.
Figure 7
Figure 7
Schematic of the action timing and the change of measures as function of the gravity. (a) All pole angles investigated as events (integer valued pole angles from −25 to 25°). The arrows indicate the direction of the pole movement. (b) Pole angle (blue) and input force (orange) trajectories in a representative trial illustrating two event occurrences (black crosses) and corresponding two force segments (thick lines). Negative force values correspond to a leftwards force. Aligning all segments that correspond to one event and averaging the segments over different trials in a window of 2 minutes yields similar curves to those shown in panel c. (c) Average force segments of a representative subject for two periods during learning (first 15 minutes: purple, last 15 minutes: dark green) for illustrating the action timing and variability measures. The circles indicate the time (action timing) when the subjects changed the direction of the force relative to the occurrence of the event (zero time lag). Negative and positive time lags represent the time before and after the event. As expected, early (first 15 minutes, purple) during learning actions are performed rather in reaction to event occurrences (towards positive time lags) whereas learning leads to the ability to make actions predictively (more negative time lag, dark green). Coloured areas illustrates the variability in force segments. The dark coloured areas indicate the action variability. It is the average standard deviation of the force segments ± 60ms around the zero crossing (action timing). The variance in input force round the zero crossing (action variability) is lower for actions late during learning (last 15 minutes), suggesting more consistency. (d) Illustration of the procedure to examine changes in different measures relative to an increase in gravity. We here show exemplarily the trial length (red curve) in relation to the gravity (dashed line). The light grey areas illustrate the periods under investigation. Subtracting the average trial length in the highlighted periods yields the change within (P2,g − P1,g) and across (P1,g+1 − P2,g) the gravity step(s).

References

    1. Prablanc C, Tzavaras A, Jeannerod M. Adaptation of hand tracking to rotated visual coordinates. Perception & Psychophysics. 1975;17:325–328. doi: 10.3758/BF03203218. - DOI
    1. Shadmehr R, Smith MA, Krakauer JW. Error Correction, Sensory Prediction, and Adaptation in Motor Control. Annual Review of Neuroscience. 2010;33:89–108. doi: 10.1146/annurev-neuro-060909-153135. - DOI - PubMed
    1. Shadmehr R, Mussa-Ivaldi FA. Adaptive representation of dynamics during learning of a motor task. The Journal of Neuroscience. 1994;14:3208–3224. - PMC - PubMed
    1. Bastian AJ. Learning to predict the future: the cerebellum adapts feedforward movement control. Current Opinion in Neurobiology. 2006;16:645–649. doi: 10.1016/j.conb.2006.08.016. - DOI - PubMed
    1. Blakemore S-J, Wolpert DM, Frith C. Why can’t you tickle yourself? Neuroreport. 2000;11:R11–R16. doi: 10.1097/00001756-200008030-00002. - DOI - PubMed

Publication types

LinkOut - more resources