

Structural variability and complexity of the giant Pithovirus sibericum particle revealed by high-voltage electron cryo-tomography and energy-filtered electron cryo-microscopy
- PMID: 29038566
- PMCID: PMC5643343
- DOI: 10.1038/s41598-017-13390-4
Structural variability and complexity of the giant Pithovirus sibericum particle revealed by high-voltage electron cryo-tomography and energy-filtered electron cryo-microscopy
Abstract
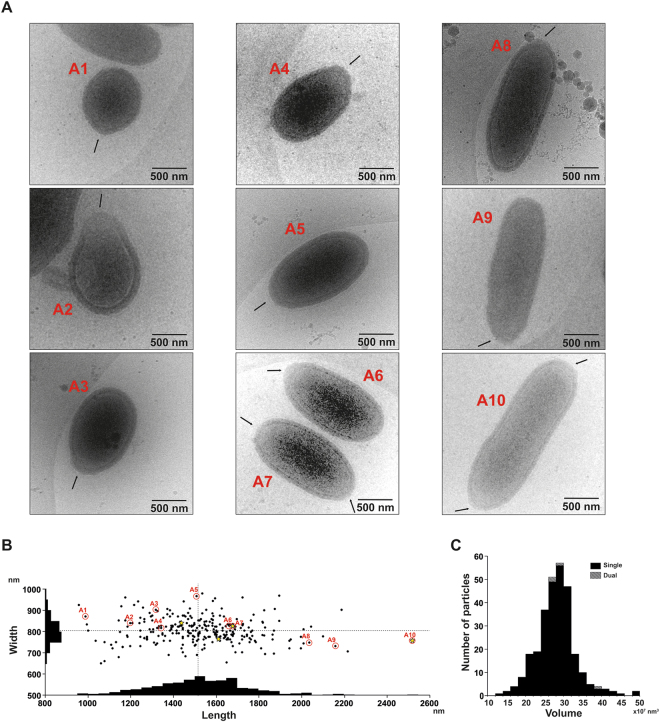
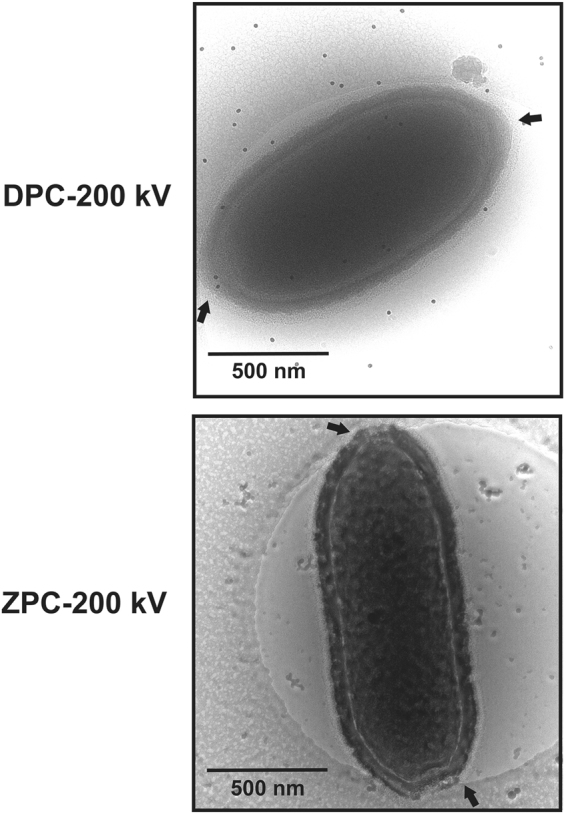
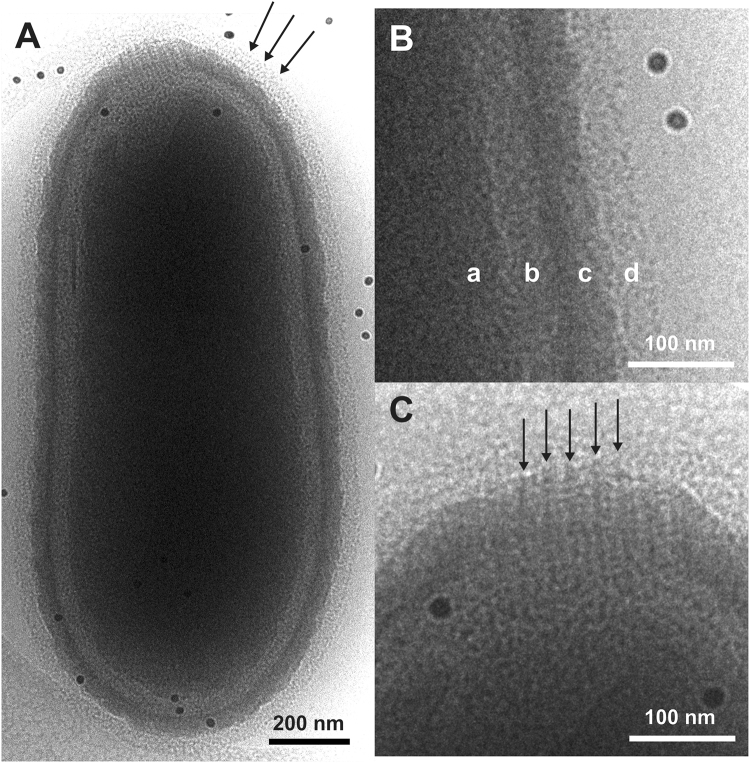
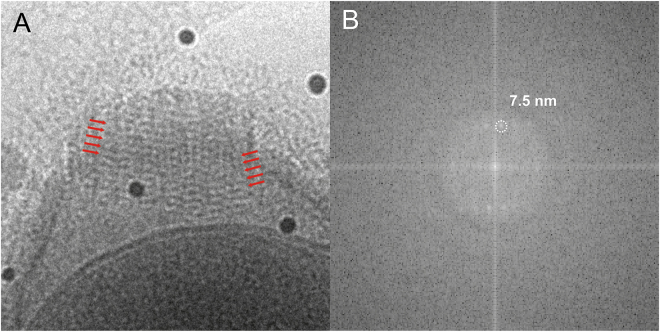
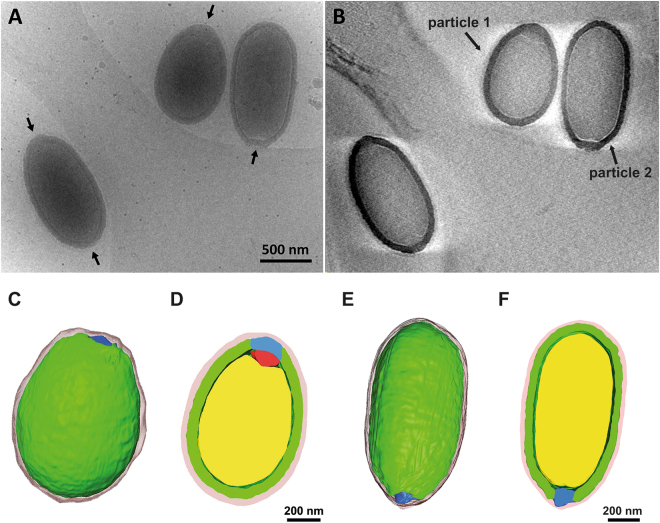
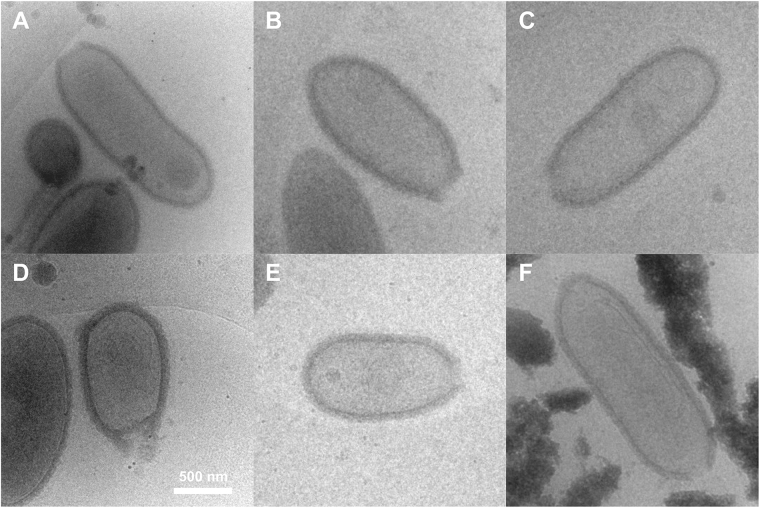
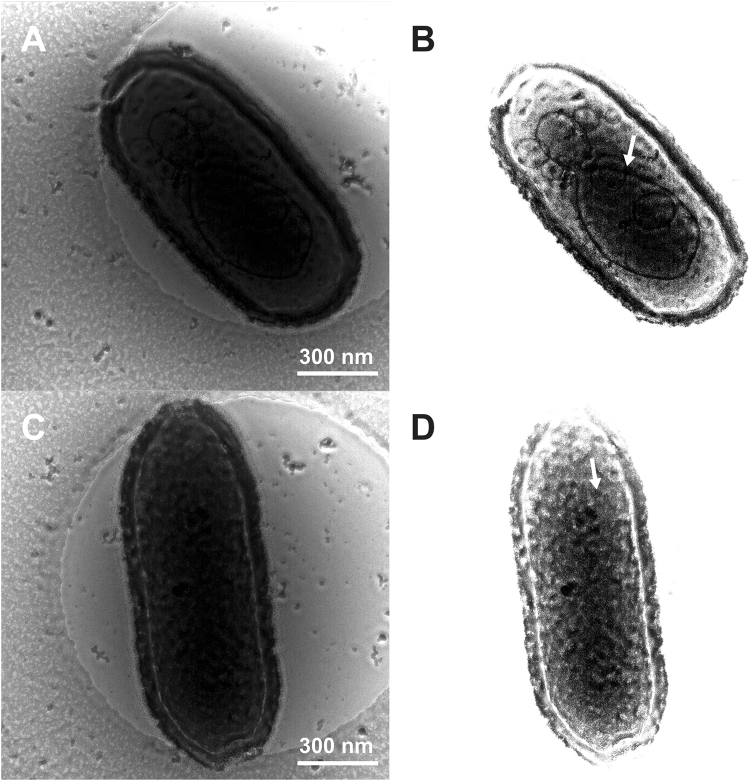
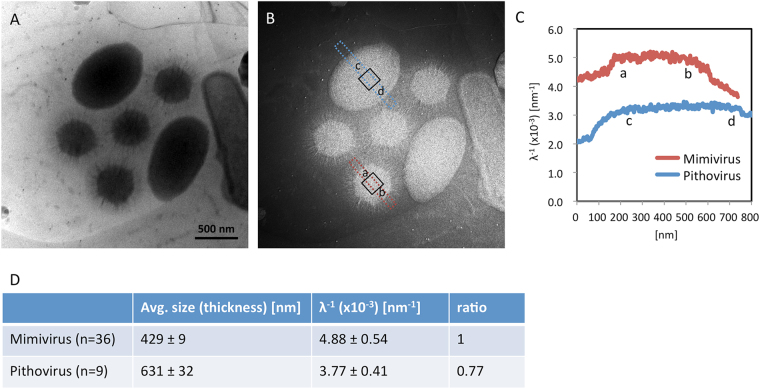
The Pithoviridae giant virus family exhibits the largest viral particle known so far, a prolate spheroid up to 2.5 μm in length and 0.9 μm in diameter. These particles show significant variations in size. Little is known about the structure of the intact virion due to technical limitations with conventional electron cryo-microscopy (cryo-EM) when imaging thick specimens. Here we present the intact structure of the giant Pithovirus sibericum particle at near native conditions using high-voltage electron cryo-tomography (cryo-ET) and energy-filtered cryo-EM. We detected a previously undescribed low-density outer layer covering the tegument and a periodical structuring of the fibres in the striated apical cork. Energy-filtered Zernike phase-contrast cryo-EM images show distinct substructures inside the particles, implicating an internal compartmentalisation. The density of the interior volume of Pithovirus particles is three quarters lower than that of the Mimivirus. However, it is remarkably high given that the 600 kbp Pithovirus genome is only half the size of the Mimivirus genome and is packaged in a volume up to 100 times larger. These observations suggest that the interior is densely packed with macromolecules in addition to the genomic nucleic acid.
Conflict of interest statement
The authors declare that they have no competing interests.
Figures
Similar articles
-
Conventional Electron Microscopy, Cryogenic Electron Microscopy, and Cryogenic Electron Tomography of Viruses.Subcell Biochem. 2024;105:81-134. doi: 10.1007/978-3-031-65187-8_3. Subcell Biochem. 2024. PMID: 39738945 Review.
-
The Morphology and Assembly of Respiratory Syncytial Virus Revealed by Cryo-Electron Tomography.Viruses. 2018 Aug 20;10(8):446. doi: 10.3390/v10080446. Viruses. 2018. PMID: 30127286 Free PMC article.
-
Complex Membrane Remodeling during Virion Assembly of the 30,000-Year-Old Mollivirus Sibericum.J Virol. 2019 Jun 14;93(13):e00388-19. doi: 10.1128/JVI.00388-19. Print 2019 Jul 1. J Virol. 2019. PMID: 30996095 Free PMC article.
-
Visualizing the virus world inside the cell by cryo-electron tomography.J Virol. 2024 Dec 17;98(12):e0108523. doi: 10.1128/jvi.01085-23. Epub 2024 Nov 4. J Virol. 2024. PMID: 39494908 Free PMC article. Review.
-
Structure of complex viruses and virus-infected cells by electron cryo tomography.Curr Opin Microbiol. 2006 Aug;9(4):437-42. doi: 10.1016/j.mib.2006.06.016. Epub 2006 Jul 10. Curr Opin Microbiol. 2006. PMID: 16829161 Review.
Cited by
-
Breaking Symmetry in Viral Icosahedral Capsids as Seen through the Lenses of X-ray Crystallography and Cryo-Electron Microscopy.Viruses. 2018 Feb 7;10(2):67. doi: 10.3390/v10020067. Viruses. 2018. PMID: 29414851 Free PMC article. Review.
-
Analysis of the Genomic Features and Evolutionary History of Pithovirus-Like Isolates Reveals Two Major Divergent Groups of Viruses.J Virol. 2023 Jul 27;97(7):e0041123. doi: 10.1128/jvi.00411-23. Epub 2023 Jul 3. J Virol. 2023. PMID: 37395647 Free PMC article.
-
Discovery and Further Studies on Giant Viruses at the IHU Mediterranee Infection That Modified the Perception of the Virosphere.Viruses. 2019 Mar 30;11(4):312. doi: 10.3390/v11040312. Viruses. 2019. PMID: 30935049 Free PMC article. Review.
-
Host Range and Coding Potential of Eukaryotic Giant Viruses.Viruses. 2020 Nov 21;12(11):1337. doi: 10.3390/v12111337. Viruses. 2020. PMID: 33233432 Free PMC article. Review.
-
Refining the taxonomy of pithovirus-related giant DNA viruses within the order Pimascovirales.Arch Virol. 2025 Apr 24;170(5):111. doi: 10.1007/s00705-025-06297-3. Arch Virol. 2025. PMID: 40268777
References
Publication types
MeSH terms
LinkOut - more resources
Full Text Sources
Other Literature Sources
