

Higher-order Network Analysis of Fine Particulate Matter (PM 2.5) Transport in China at City Level
- PMID: 29038572
- PMCID: PMC5643331
- DOI: 10.1038/s41598-017-13614-7
Higher-order Network Analysis of Fine Particulate Matter (PM 2.5) Transport in China at City Level
Abstract
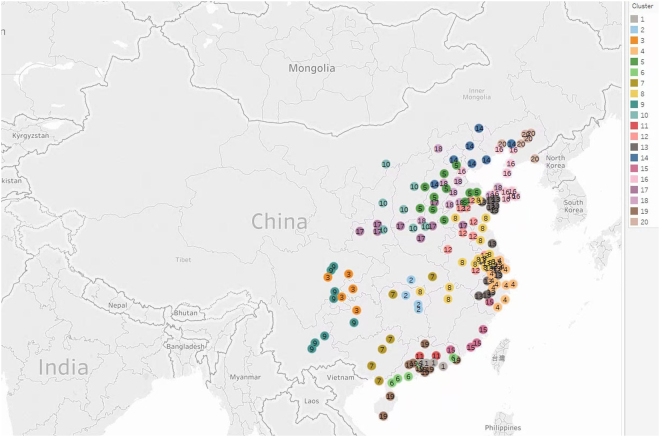
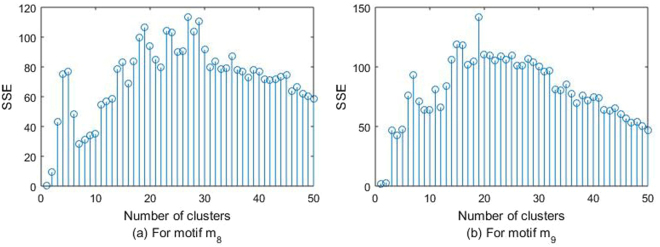
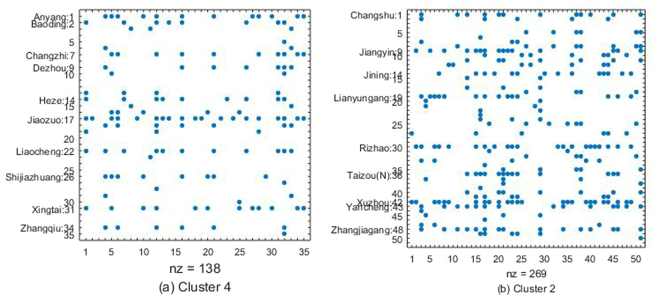
Specification of PM 2.5 transmission characteristics is important for pollution control and policymaking. We apply higher-order organization of complex networks to identify major potential PM 2.5 contributors and PM 2.5 transport pathways of a network of 189 cities in China. The network we create in this paper consists of major cities in China and contains information on meteorological conditions of wind speed and wind direction, data on geographic distance, mountains, and PM 2.5 concentrations. We aim to reveal PM 2.5 mobility between cities in China. Two major conclusions are revealed through motif analysis of complex networks. First, major potential PM 2.5 pollution contributors are identified for each cluster by one motif, which reflects movements from source to target. Second, transport pathways of PM 2.5 are revealed by another motif, which reflects transmission routes. To our knowledge, this is the first work to apply higher-order network analysis to study PM 2.5 transport.
Conflict of interest statement
The authors declare that they have no competing interests.
Figures


References
-
- Zheng G, et al. Exploring the severe winter haze in Beijing: the impact of synoptic weather, regional transport and heterogeneous reactions. Atmospheric Chemistry and Physics. 2015;15:2969–2983. doi: 10.5194/acp-15-2969-2015. - DOI
-
- Wang H, et al. Chemical composition of pm 2.5 and meteorological impact among three years in urban Shanghai, China. Journal of Cleaner Production. 2016;112:1302–1311. doi: 10.1016/j.jclepro.2015.04.099. - DOI
Publication types
LinkOut - more resources
Full Text Sources
Other Literature Sources
