. 2017 Oct 16;7(1):13244.
doi: 10.1038/s41598-017-13802-5.

Tissue and plasma levels of galectins in patients with high grade serous ovarian carcinoma as new predictive biomarkers

Affiliations

Tissue and plasma levels of galectins in patients with high grade serous ovarian carcinoma as new predictive biomarkers

Marilyne Labrie et al. Sci Rep. .

Abstract

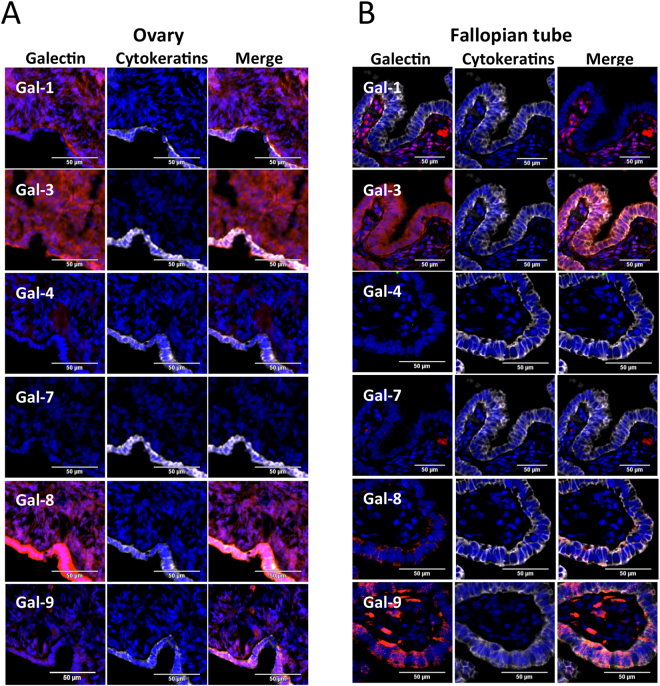
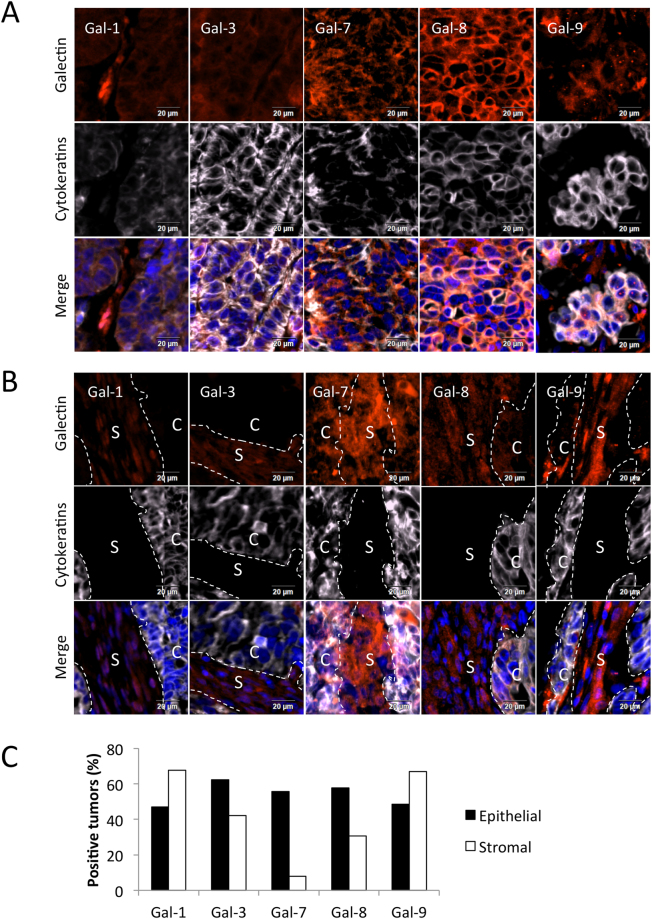
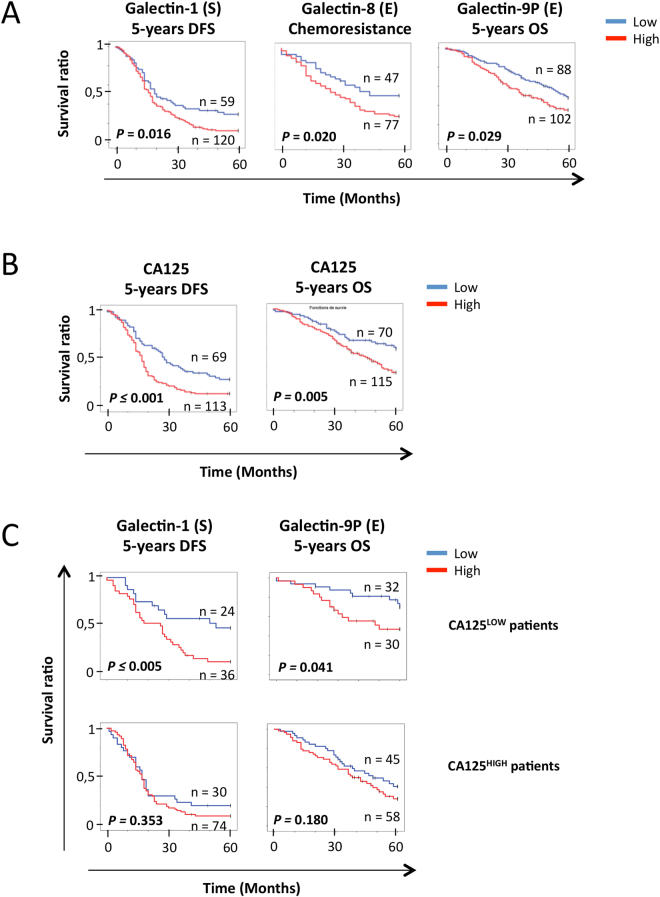
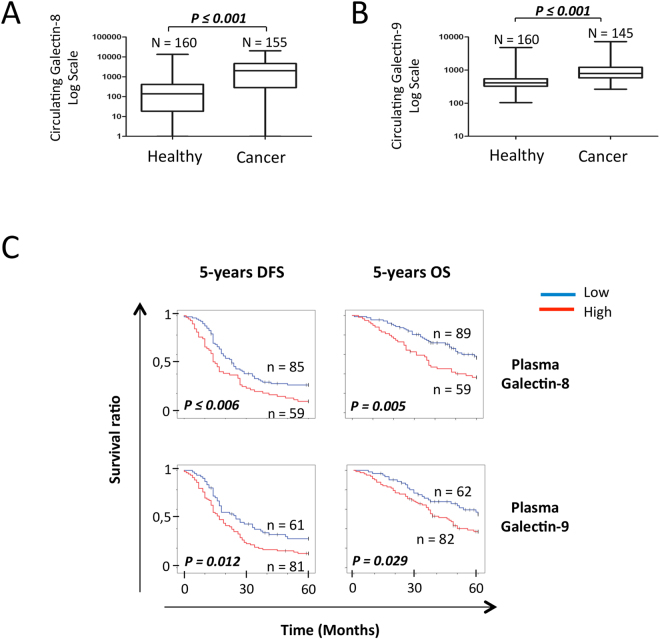
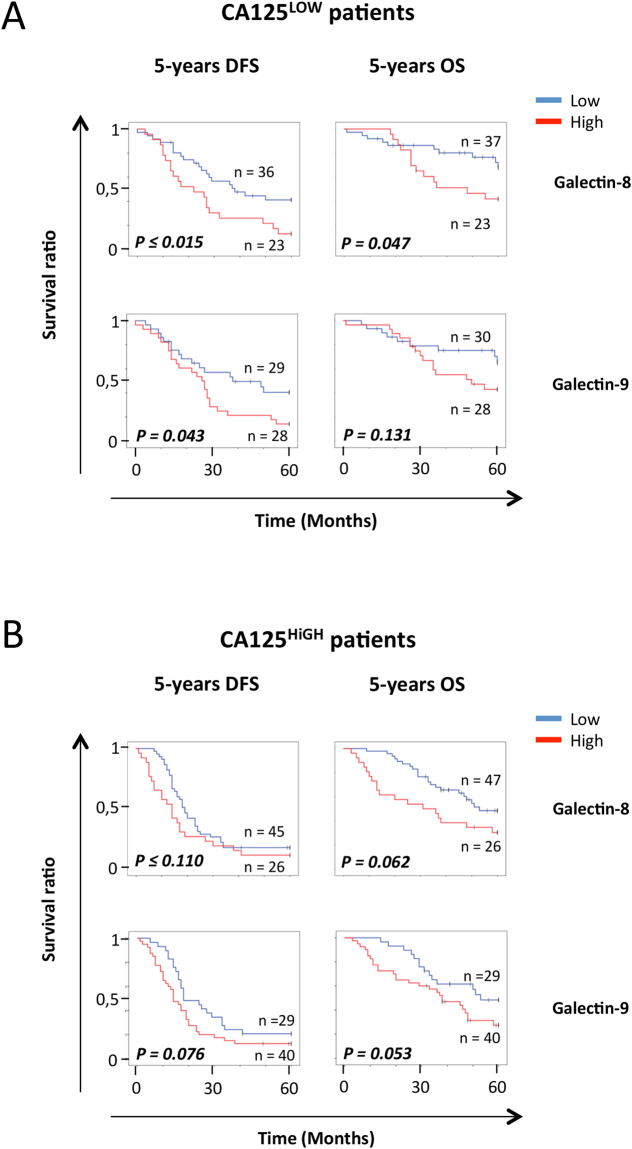
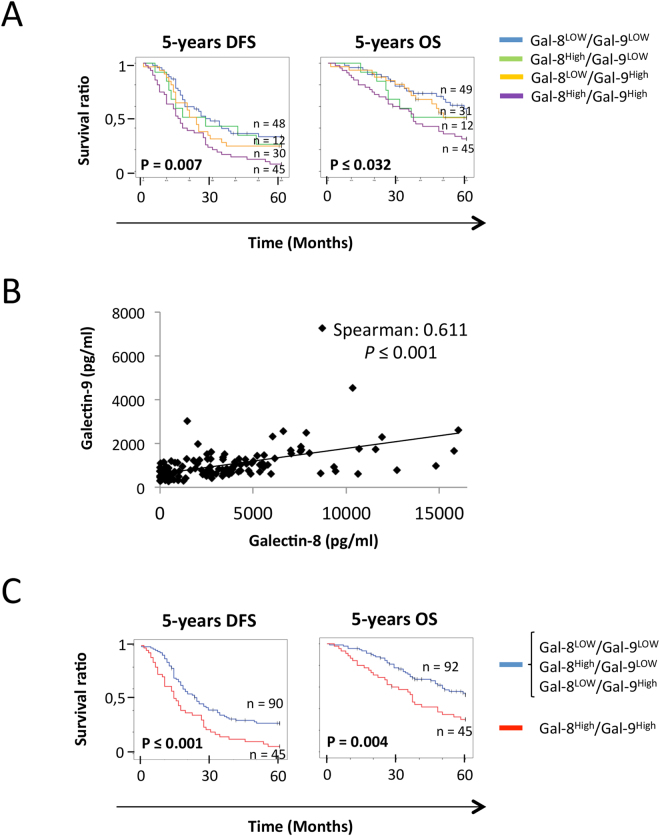
Galectins are moving closer to center stage in detecting glycosylation aberration in cancer cells. Here, we have investigated the expression of galectins in ovarian cancer (OC) and examined their potential as biomarkers in tissues and blood plasma samples of high grade serous ovarian carcinoma (HGSC) patients. In tissues, we found that increased protein expression of stromal gal-1 and epithelial gal-8/9 was associated with a poor response to treatment of HGSC patients. Gal-8/9 were both independent predictors of chemoresistance and overall survival (OS), respectively. This galectin signature increased the predictive value of the cancer antigen 125 (CA125) on 5-year disease-free survival (DFS), post-chemotherapy treatment and 5-year OS. In CA125LOW patients, epithelial gal-9 was associated with a lower 5-year OS while stromal gal-1 and epithelial gal-8 were both associated with a lower 5-year DFS. Such negative predictive value of gal-8 and gal-9 was also found using plasma samples. In both cases, high plasma levels of gal-8 and gal-9 was associated with a lower OS and DFS. Overall, these data suggest that galectins may be promising biomarkers to identify subgroups of HGSC patients with poorer prognosis. Our study also contributes to better define the heterogeneity of the disease.


Conflict of interest statement

The authors declare that they have no competing interests.

Figures

Figure 1
Figure 1
Galectins expression in normal ovarian and fallopian tube tissues. IF staining of gal-1, -3, -4, -7 -8 and -9 (Red) in normal (A) ovarian and (B) fallopian tube tissues. The characteristic cytosolic staining of cytokeratin staining (white) and DAPI were used to identify epithelial cells and nucleus, respectively. Cytokeratin negative tissue was considered as stroma. The merged images were used to determine localization of each galectins in both epithelial and stromal compartments. Bar represent 50 µm.
Figure 2
Figure 2
Galectins expression and tissular distribution in HGSC. Representative staining of gal-1, -3, -7, -8 and -9 (red fluorescence) in HGSC cancer cells (A) and peritumoral stromal cells (B). Cytokeratin staining (white fluorescence) and DAPI were used to identify epithelial cancer cells (compartment C) and nucleus, respectively. Cytokeratin negative tissue was considered as stroma (compartment S). Bar represent 20 µm. (C) Percentage of positive tumors expressing galectins in the cancer cells and the stroma of 209 HGSC specimens.
Figure 3
Figure 3
Galectins predictive value of OS, DFS and chemoresistance. (A) Kaplan-Meier curves of 5-years OS, 5-years DFS and chemoresistance according to stromal gal-1, epithelial gal-8 and gal-9P in HGSC samples. Blue bar: galectin low expression, red bar: galectin high expression. (B) Kaplan-Meier curves of 5-years OS and 5-years DFS according to the presence of circulating CA125. Blue bar: CA125LOW samples, red bar: CA125HIGH samples. (C) Kaplan-Meier curves of 5-years OS according to gal-9P presence and 5-years DFS according to stromal gal-1 presence in the tumors of CA125HIGH or CA125LOW patients. Blue bar: galectin low expression, red bar: galectin high expression. (S): Stroma; (E): Epithelium.
Figure 4
Figure 4
Predictive value of circulating galectins on the OS and DFS. (A) Gal-8 and (B) gal-9 concentration in the plasma of healthy donors and ovarian cancer patients. (C) Kaplan-Meier curves of the 5-years OS and 5-years DFS according to the presence of gal-8 and gal-9 in the plasma of HGSC patients. Blue bar: galectin negative samples, red bar: galectin positive samples.
Figure 5
Figure 5
Predictive value of circulating galectin-8 and -9 according to CA-125 levels. Kaplan-Meier curves of 5-years OS and 5-years DFS according to the presence of circulating gal-8 and gal-9 in the plasma of (A) CA125LOW or (B) CA125HIGH patients. Blue bar: galectin negative samples, red bar: galectin positive samples.
Figure 6
Figure 6
Combining gal-8 and gal-9 increases the predictive value for OS and HFS. (A) Kaplan-Meier curves of the 5-years OS and 5-years DFS according to the presence of either or both gal-8 and gal-9 in the plasma of HGSC patients. Blue bar: Gal-8LOW/Gal-9LOW, green bar: Gal-8High/Gal-9LOW, Yellow bar: Gal-8LOW/Gal-9High, Magenta bar: Gal-8High/Gal-9HIGH. (B) Correlation between the concentration of gal-8 and gal-9 in the plasma of HGSC patients. (C) Kaplan-Meier curves of the 5-years OS and 5-years DFS according to the presence of both gal-8 and gal-9 in the plasma of HGSC patients. Blue bar: Gal-8LOW/Gal-9LOW, Gal-8High/Gal-9LOW or Gal-8LOW/Gal-9High sample; Red bar: Gal-8High/Gal-9HIGH samples. Patients with plasma gal-8 ≥ 2.7 ng/ml or plasma gal-9 ≥ 0.73 ng/ml were considered Gal-8High and Gal-9High, respectively.

Similar articles

Cited by

References

    1. Suh DH, et al. Major clinical research advances in gynecologic cancer in 2016: 10-year special edition. Journal of Gynecologic Oncology. 2017;28:e45. doi: 10.3802/jgo.2017.28.e45. - DOI - PMC - PubMed
    1. Salomon-Perzynski A, Salomon-Perzynska M, Michalski B, Skrzypulec-Plinta V. High-grade serous ovarian cancer: the clone wars. Archives of Gynecology and Obstetrics. 2017;295:569–576. doi: 10.1007/s00404-017-4292-1. - DOI - PMC - PubMed
    1. Le Page C, Huntsman DG, Provencher DM, Mes-Masson AM. Predictive and prognostic protein biomarkers in epithelial ovarian cancer: recommendation for future studies. Cancers. 2010;2:913–954. doi: 10.3390/cancers2020913. - DOI - PMC - PubMed
    1. Felder M, et al. MUC16 (CA125): tumor biomarker to cancer therapy, a work in progress. Molecular Cancer. 2014;13:129. doi: 10.1186/1476-4598-13-129. - DOI - PMC - PubMed
    1. Mogensen O, Mogensen B, Jakobsen A. Predictive value of CA 125 during early chemotherapy of advanced ovarian cancer. Gynecologic Oncology. 1990;37:44–46. doi: 10.1016/0090-8258(90)90305-5. - DOI - PubMed

Publication types