Comparative Study
. 2017:2017:8503754.
doi: 10.1155/2017/8503754. Epub 2017 Sep 6.

db/ db Mice Exhibit Features of Human Type 2 Diabetes That Are Not Present in Weight-Matched C57BL/6J Mice Fed a Western Diet

Affiliations
Comparative Study

db/ db Mice Exhibit Features of Human Type 2 Diabetes That Are Not Present in Weight-Matched C57BL/6J Mice Fed a Western Diet

Susan J Burke et al. J Diabetes Res. 2017.

Abstract

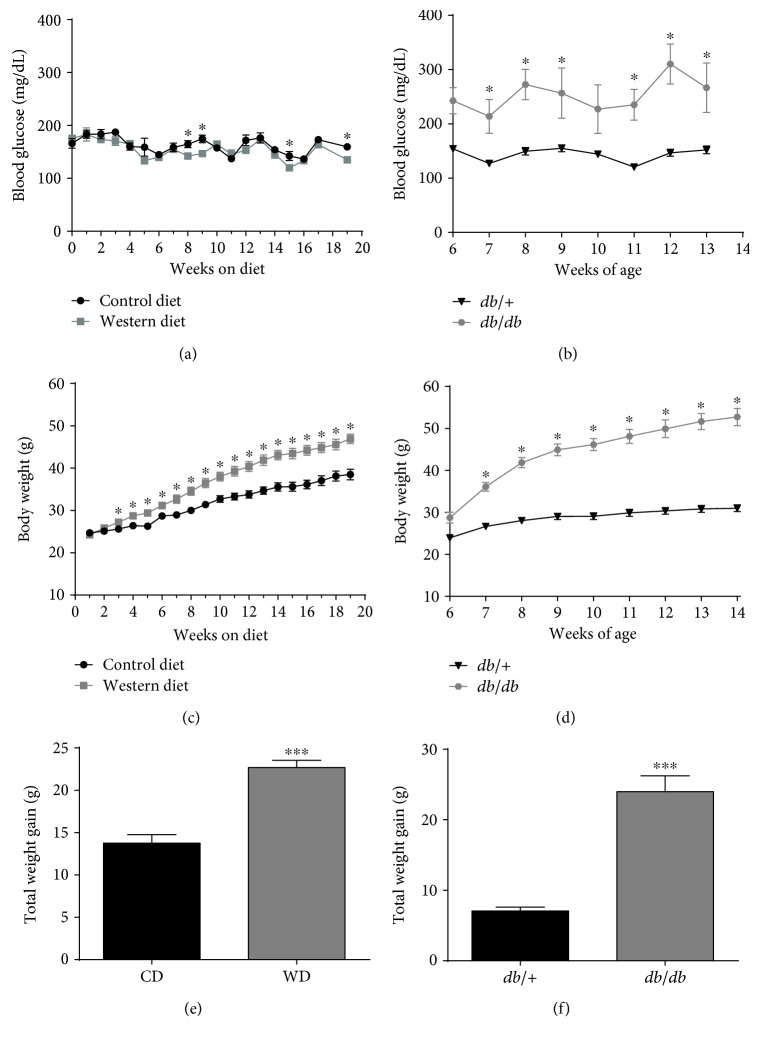
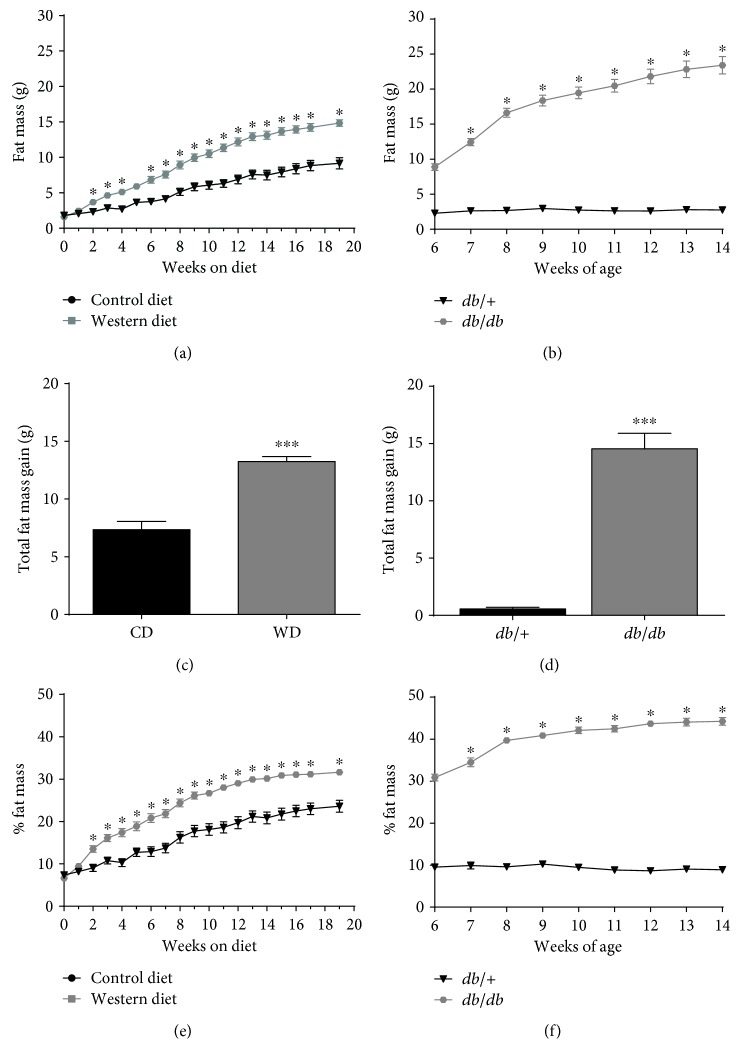
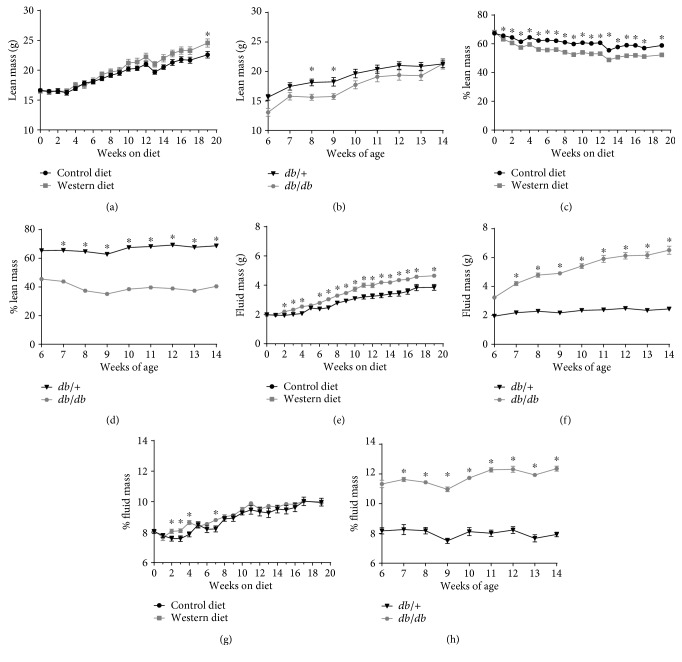
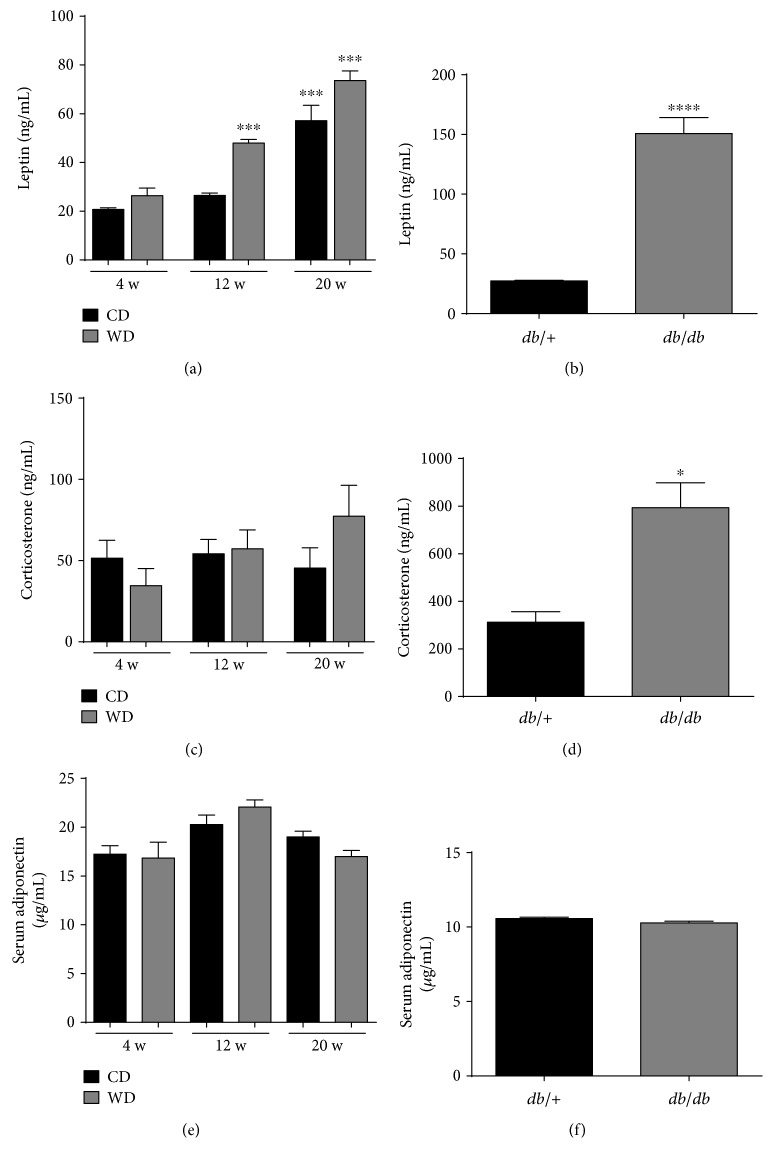
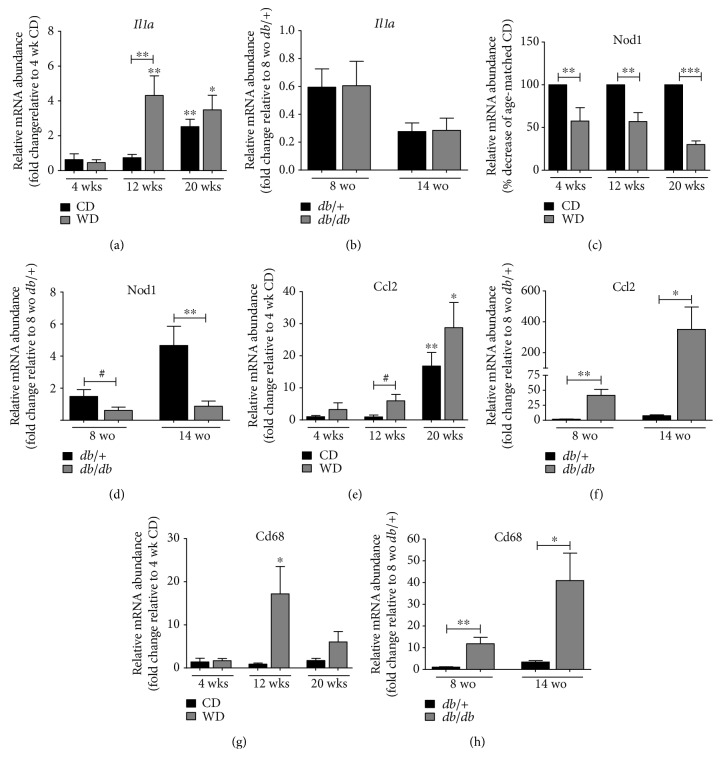
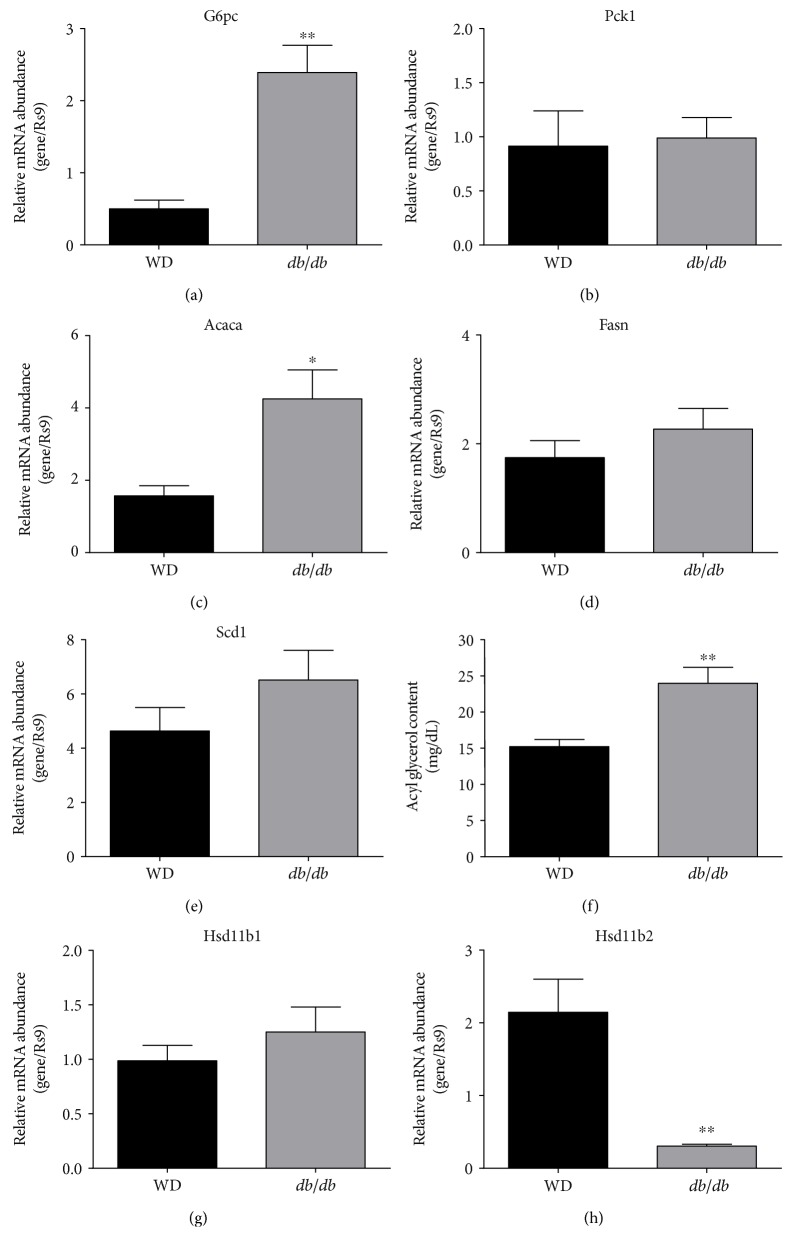
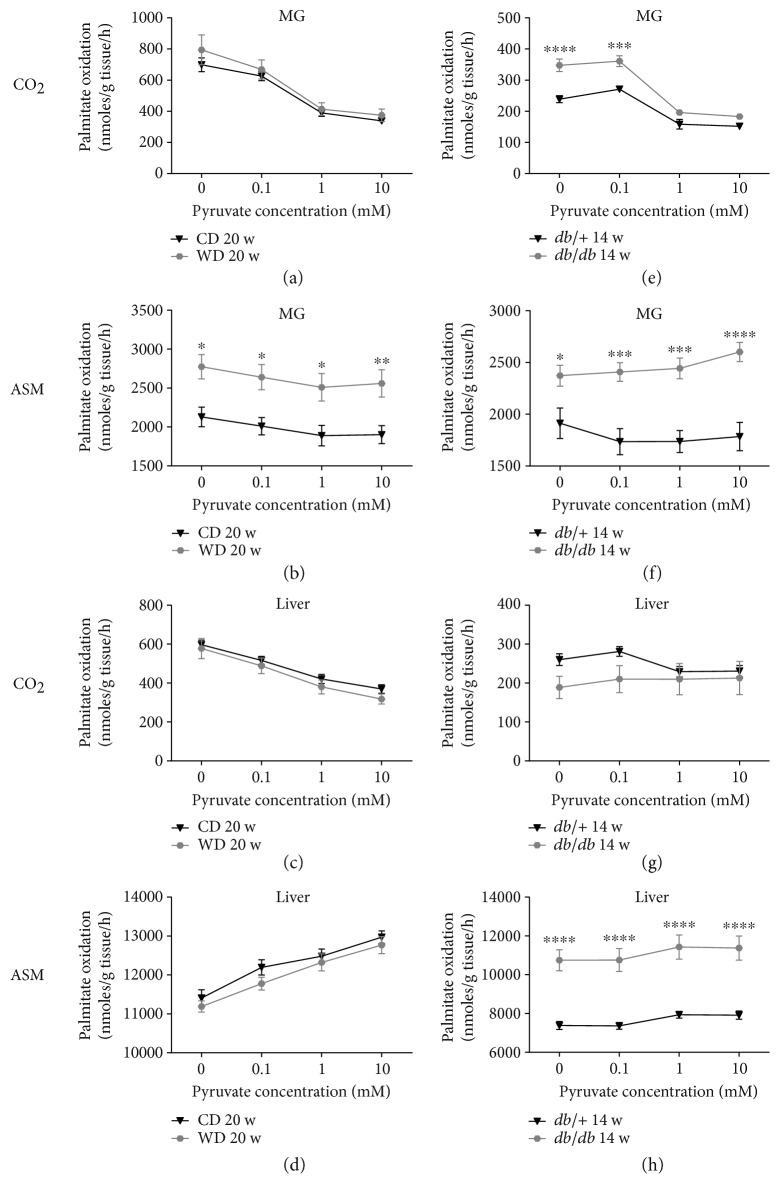
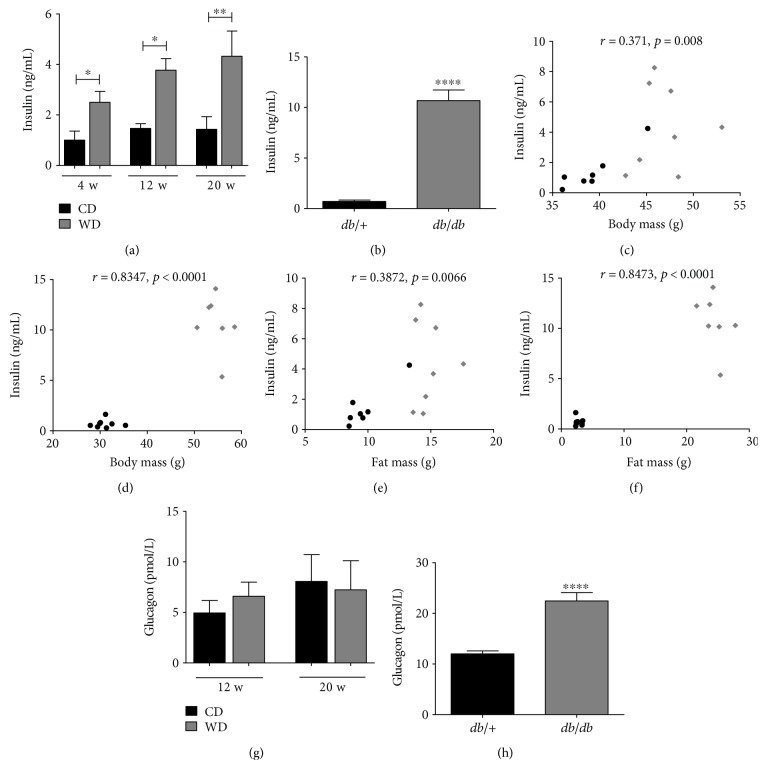
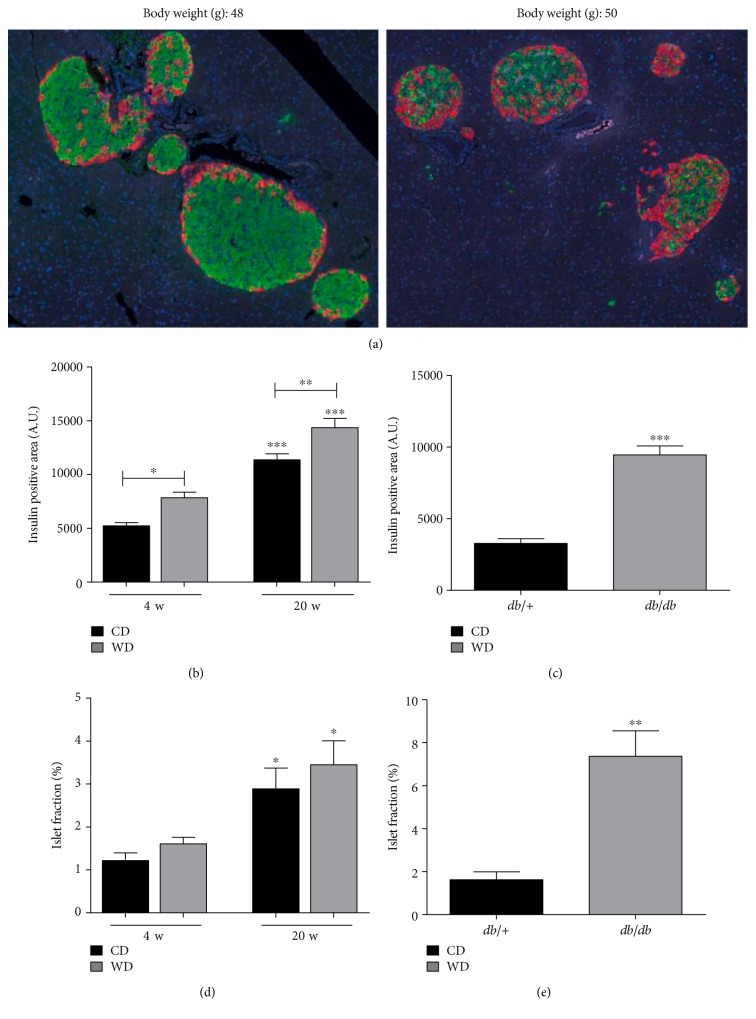
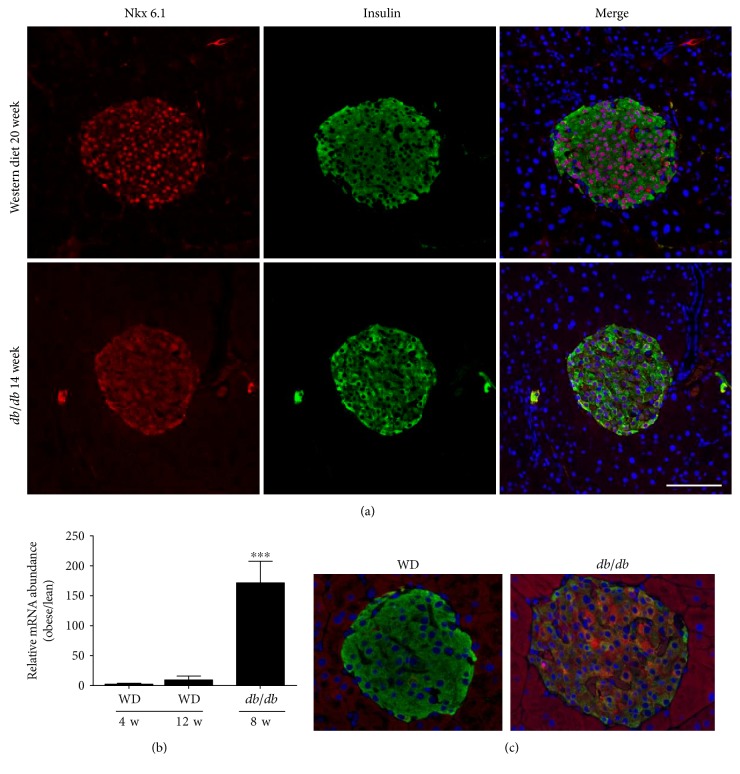
To understand features of human obesity and type 2 diabetes mellitus (T2D) that can be recapitulated in the mouse, we compared C57BL/6J mice fed a Western-style diet (WD) to weight-matched genetically obese leptin receptor-deficient mice (db/db). All mice were monitored for changes in body composition, glycemia, and total body mass. To objectively compare diet-induced and genetic models of obesity, tissue analyses were conducted using mice with similar body mass. We found that adipose tissue inflammation was present in both models of obesity. In addition, distinct alterations in metabolic flexibility were evident between WD-fed mice and db/db mice. Circulating insulin levels are elevated in each model of obesity, while glucagon was increased only in the db/db mice. Although both WD-fed and db/db mice exhibited adaptive increases in islet size, the db/db mice also displayed augmented islet expression of the dedifferentiation marker Aldh1a3 and reduced nuclear presence of the transcription factor Nkx6.1. Based on the collective results put forth herein, we conclude that db/db mice capture key features of human T2D that do not occur in WD-fed C57BL/6J mice of comparable body mass.


Figures

Figure 1
Figure 1
Hyperglycemia develops in genetically driven, but not diet-induced obesity. Blood glucose (a) and body weight (c) in male C57BL/6J mice fed either control or Western diet for 20 weeks. Total weight gain (e) at the end of the 20-week feeding period. Blood glucose (b) and body weight (d) in male db/+ and db/db mice between 6 and 14 weeks of age. Total weight gain by 14 weeks of age (f). For body weight measurements (c and d), y-axes are set to the same scale for comparison between study groups. n = 8 per group; means ± SEM; ∗∗∗p < 0.001 versus control; p < 0.05 versus control by repeated measures ANOVA. CD: control diet; WD: Western diet.
Figure 2
Figure 2
Increased fat mass occurs in both diet-induced and genetically driven forms of obesity. Fat mass (a) and % fat mass (e) in male C57BL/6J mice fed either control or Western diet for 20 weeks. Total fat mass gain (c) at the end of the 20-week feeding period. Fat mass (b) and % fat mass (f) in male db/+ and db/db mice between 6 and 14 weeks of age. Total fat mass gain by 14 weeks of age (d). For fat mass measurements, y-axes are set to the same scale for comparison between study groups. n = 8 per group; means ± SEM; ∗∗∗p < 0.001 versus control; p < 0.05 versus control by repeated measures ANOVA. CD: control diet; WD: Western diet.
Figure 3
Figure 3
Lean and fluid mass profiles in WD-fed and genetically obese db/db mice. Lean mass (a), % lean mass (c), fluid mass (e), and % fluid mass (g) in male C57BL/6J mice fed either control or Western diet for 20 weeks. Lean mass (b), % lean mass (d), fluid mass (f), and % fluid mass (h) in male db/+ and db/db mice between 6 and 14 weeks of age. n = 8 per group; means ± SEM; p < 0.05 versus control by repeated measures ANOVA.
Figure 4
Figure 4
Elevated corticosterone in serum of db/db mice but not WD-fed mice. Serum levels of leptin (a, b), corticosterone (c, d), and adiponectin (e, f) in C57BL/6J mice fed either control or Western diet for 4, 12, and 20 weeks (a, c, e) or 14-week-old db/+ and db/db mice (b, d, f). n = 8 per group; means ± SEM. ∗∗∗∗p < 0.0001; ∗∗∗p < 0.001; p < 0.05. CD: control diet; WD: Western diet; HFD.
Figure 5
Figure 5
Increased expression of inflammatory markers is evident in epididymal adipose tissue from both genetic and diet-induced obesity. Relative mRNA abundance of the inflammatory genes Il1a (a, b), Nod1 (c, d), Ccl2 (e, f), and Cd68 (g, h) in epididymal adipose tissue from either C57BL/6J mice fed either control or Western diet for 4, 12, and 20 weeks (a, c, e, g) or 8- and 14-week-old db/+ and db/db mice (b, d, f, h). n = 8 per group. Data are normalized to the reference gene Ppia and are represented as means ± SEM. ∗∗∗p < 0.001; ∗∗p < 0.01; p < 0.05; #p < 0.1 by one-way ANOVA with Tukey's post hoc analysis. (a), (e), and (g) p values versus respective 4-week dietary group unless denoted by bar. CD: control diet; WD: Western diet; wo: weeks old.
Figure 6
Figure 6
Livers from db/db mice displayed enhanced expression of glucose 6-phosphatase, acetyl Co-A carboxylase, and elevated acyl glycerol content when compared with livers from WD-fed mice. Relative mRNA abundance of the G6pc (a), Pck1 (b), Acaca (c), Fasn (d), Scd1 (e), Hsd11b1 (g), and Hsd11b2 (h) genes in the liver tissue from either C57BL/6J mice fed either Western diet for 20 weeks (black panels) or 14-week-old db/db mice (gray panels). Acyl glycerol content (f) was quantified using 30 mg of liver tissue from either Western diet-fed C57BL/6J mice (20 weeks on diet; black panels) or 14-week-old db/db mice (gray panels). n = 8 per group. Data are represented as means ± SEM. ∗∗p < 0.01; p < 0.05.
Figure 7
Figure 7
Derangements in the skeletal muscle and liver fat oxidation occur in db/db mice, while diet-induced obesity only negatively impacts skeletal muscle fat oxidation. Using [1-14C] palmitate (100 μM), substrate switching was assessed by measuring complete (CO2) and incomplete (acid soluble metabolite (ASM)) fat oxidation ± varying doses of pyruvate as a competing substrate. Assays were run using homogenates from mixed gastrocnemius (MG) skeletal muscle (a, b, e, f) and liver (c, d, g, h) from diet-induced (control diet versus Western diet for 20 weeks; a–d) and a genetically obese model (db/+ versus db/db mice aged 14 weeks; e–h) of obesity. n = 8 per group; means ± SEM. ∗∗∗∗p < 0.0001 versus control; ∗∗∗p < 0.001 versus control; ∗∗p < 0.01 versus control; p < 0.05 versus control by two-way repeated measures ANOVA with Bonferroni post hoc test for multiple comparisons.
Figure 8
Figure 8
Circulating insulin levels are elevated in both mouse models of obesity, but glucagon is increased only in the db/db mice. Serum insulin (a, b) and glucagon (g, h) in C57BL/6J mice fed either control or Western diet for the indicated number of weeks (a, g) or 14-week-old db/+ and db/db mice (b, h). Serum insulin correlated to body mass or fat mass in C57BL/6J mice fed Western diet for 20 weeks (c and e, resp.) and in 14-week-old db/db mice (d and f, resp.) by Spearman's correlation. n = 8 per group; means ± SEM; ∗∗∗∗p < 0.0001; ∗∗p < 0.01; p < 0.05. CD: control diet; WD: Western diet.
Figure 9
Figure 9
Islet size and insulin-positive area increase in both db/db and WD-fed mice. (a) Immunofluorescent images from pancreatic sections stained for insulin (green), glucagon (red), and DAPI nuclear stain (blue) from C57BL/6J fed WD for 20 weeks (left panel) or 14-week-old db/db mice (right panel). Insulin-positive area (b and c) and calculations of islet area relative to total pancreatic area, that is, islet fraction (d and e) are shown for C57BL/6J mice fed either control or Western diet for 4 or 20 weeks (b, d) and 14-week-old db/+ compared with db/db mice (c, e). Insulin-positive area and islet fraction were quantified using 8 mice per group. Data are shown as mean ± S.E.M. ∗∗∗p < 0.001; ∗∗p < 0.01; p < 0.05. CD: control diet; WD: Western diet.
Figure 10
Figure 10
Markers of dedifferentiation are present in islets of db/db, but not weight-matched WD-fed mice. (a) Immunofluorescent analysis of islets from weight-matched WD-fed mice (top row) and db/db mice (bottom row) showing Nkx6.1 (red), insulin (green), and DAPI (blue). In the merged image, note the loss of double-positive nuclei (DAPI plus Nkx6.1; purple color) in the db/db mice but not in the WD-fed mice. (b) Expression of the Aldh1a3 gene in islets isolated from mice fed a WD for 4 or 12 weeks normalized to mice fed a control diet compared with db/db mice at 8 weeks of age (normalized to lean db/+ controls). ∗∗∗p < 0.001 versus both WD groups by one-way ANOVA. (c) Staining for Aldh1a3 protein (red) and insulin (green) in islets from weight-matched WD-fed mice (20 weeks on diet) versus db/db mice (14 weeks of age).

Similar articles

Cited by

References

    1. Muoio D. M., Newgard C. B. Mechanisms of disease: molecular and metabolic mechanisms of insulin resistance and beta-cell failure in type 2 diabetes. Nature Reviews Molecular Cell Biology. 2008;9(3):193–205. doi: 10.1038/nrm2327. - DOI - PubMed
    1. Samuel V. T., Shulman G. I. Mechanisms for insulin resistance: common threads and missing links. Cell. 2012;148(5):852–871. doi: 10.1016/j.cell.2012.02.017. - DOI - PMC - PubMed
    1. Bray G. A. Overweight is risking fate. Definition, classification, prevalence, and risks. Annals of the New York Academy of Sciences. 1987;499:14–28. - PubMed
    1. Bray G. A. Obesity increases risk for diabetes. International Journal of Obesity and Related Metabolic Disorders. 1992;16(Supplement 4):S13–S17. - PubMed
    1. Gregor M. F., Hotamisligil G. S. Inflammatory mechanisms in obesity. Annual Review of Immunology. 2011;29:415–445. doi: 10.1146/annurev-immunol-031210-101322. - DOI - PubMed

Publication types

MeSH terms